KhalidAbualrob
Last seen
Ideas
4Scripts
0Joined Feb 18, 2021
All Types
Type
All Types
Indicators
Strategies
Libraries
All Accesses
Script access
All Accesses
Open
Protected
Invite-only
Public & Private
Privacy
Public & Private
Public
Private
The falling wedge pattern is a continuation pattern formed when price bounces between two downward sloping, converging trendlines. It is considered a bullish chart formation but can indicate both reversal and continuation patterns As always you will need to wait for a daily close above the trend line. P.S. wait for a potential pull back to retest the broken...
7
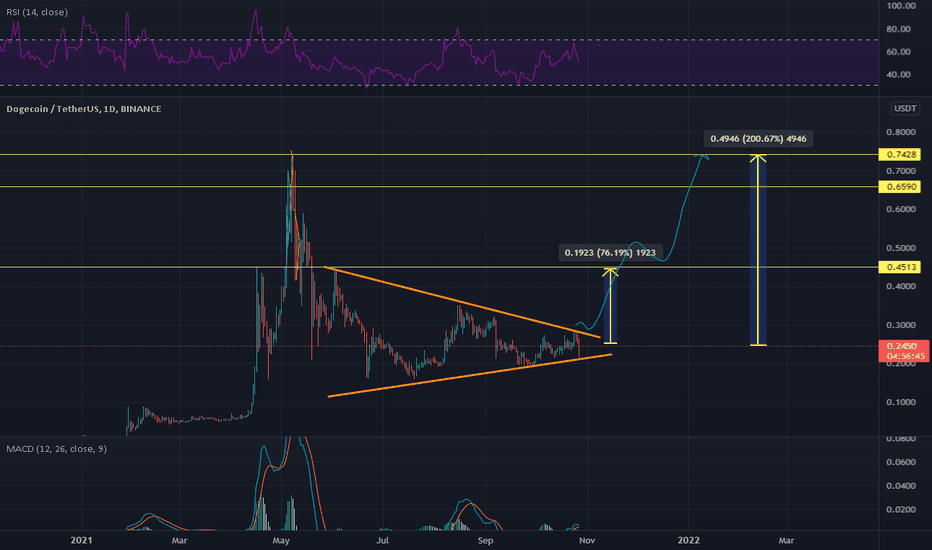
DOGE is looking good to accumulate now as it is on trendline support on 1D and forming symmetrical triangle on ID timeframe. it can pump hard anytime from this zone. So buy and hold. TP1: 80% TP2: 200%
28
Expecting ascending channel near soon Thank you . . .
10
3
2
2
Message
Follow
Following
Unfollow
1
0
0
Message
Follow
Following
Unfollow
0
0
0
Message
Follow
Following
Unfollow
1
0
1
Message
Follow
Following
Unfollow
2
1
0
Message
Follow
Following
Unfollow
9
1
22
Message
Follow
Following
Unfollow
0
0
0
Message
Follow
Following
Unfollow
1
1
0
Message
Follow
Following
Unfollow
0
0
0
Message
Follow
Following
Unfollow
Online
5083
607
7426
Message
Follow
Following
Unfollow
858
590
1921
Message
Follow
Following
Unfollow
4807
1951
8859
Message
Follow
Following
Unfollow
12443
982
37573
Message
Follow
Following
Unfollow
2
1
0
Message
Follow
Following
Unfollow
Type
Script access
Privacy


