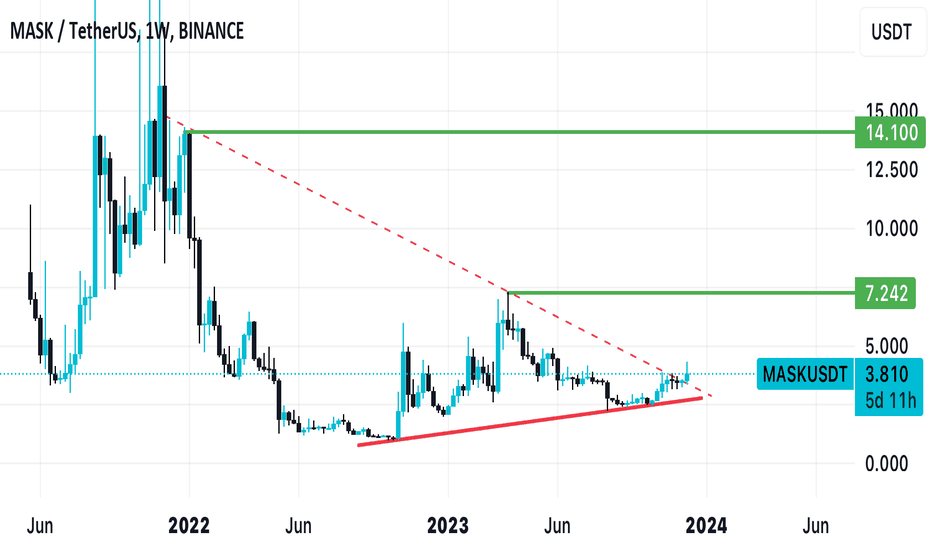
$MASK one of Communications & Social Media tokens made its way out of the resistance in the one week Chart. $7 and $14 are my targets in the near future. #Mask
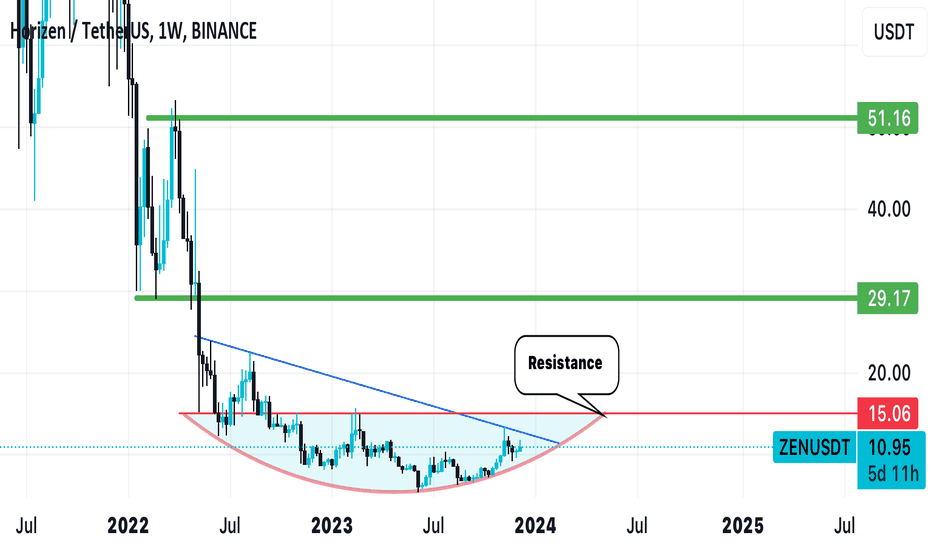
LSE:ZEN one of the #Masternodes looks very bullish for me I’m expecting a target to the resistance at $15 If we break above that level which I think we will then these green lines will be my targets in the near future #ZEN #ZENUSDT
Update on #XRP #XRP is slowly moving in Sequence looks bullish is the weekly chart, resistance at 0.94 and big target between $1.4 and $1.5 This chart is the future!
BNB has been accumulating for a long time now, will be moving up soon following this scenario
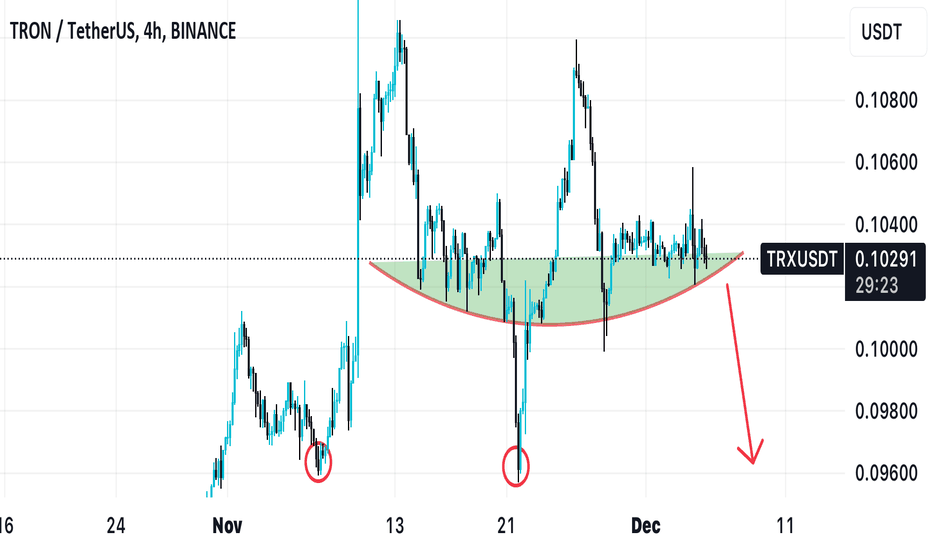
Update on AMEX:TRX if we still hold the green area then i will still consider the trend up, until we break the red line then i will consider the direction of the arrow below as my target #TRX #TRXUSDT
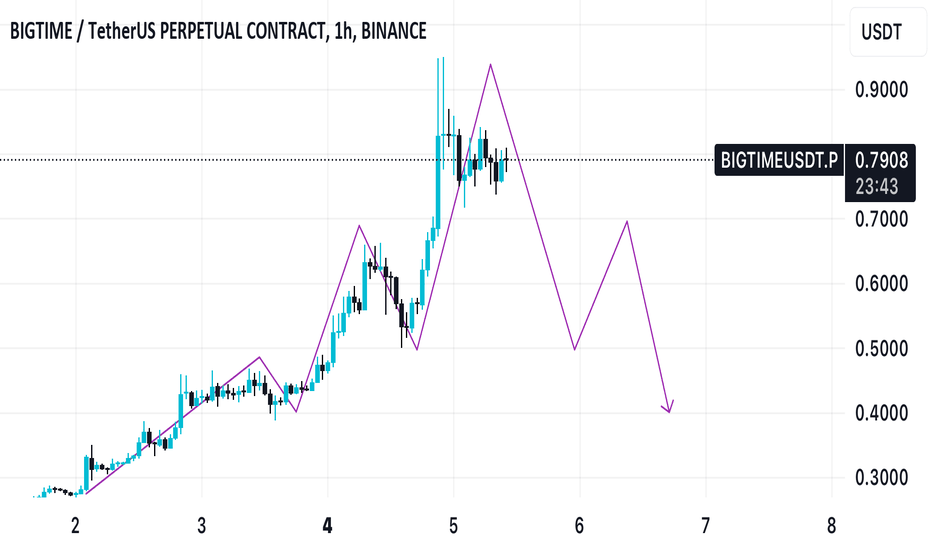
Bigtime looks bearish to me looking at the market structure in the 1H timeframe
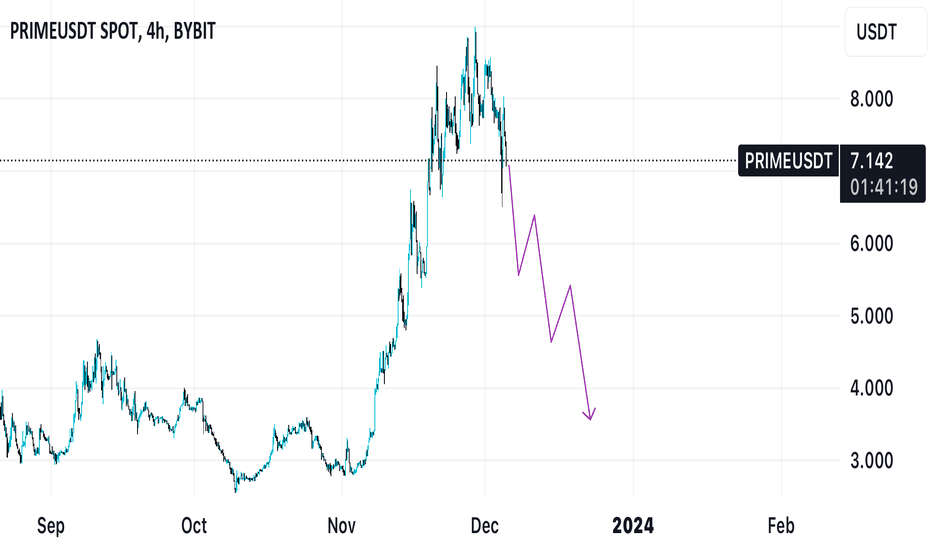
SET:PRIME looks bearish, it will continue sideways until we get to the final target
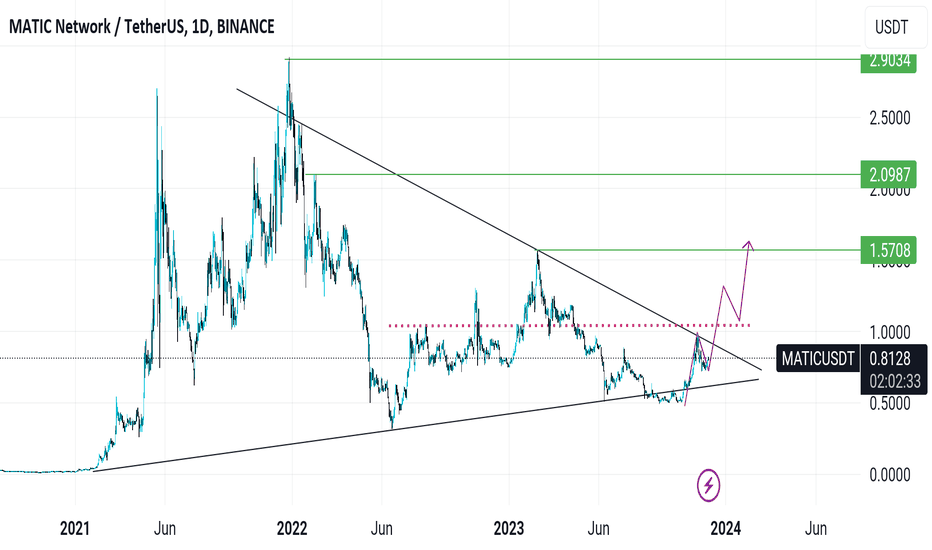
Never tremble when I say buy CRYPTOCAP:MATIC Past successful historical calls by me should motivate you to hold lots of #MATIC Trend looks super clean, I'm looking forward to breaking the red resistance line soon to fully crack the shell for the bulls to run out. #Polygon
FX:EURUSD looks bearish to me, I expect a move down to at least 1.07300 before the upside move #Eurusd #Forex
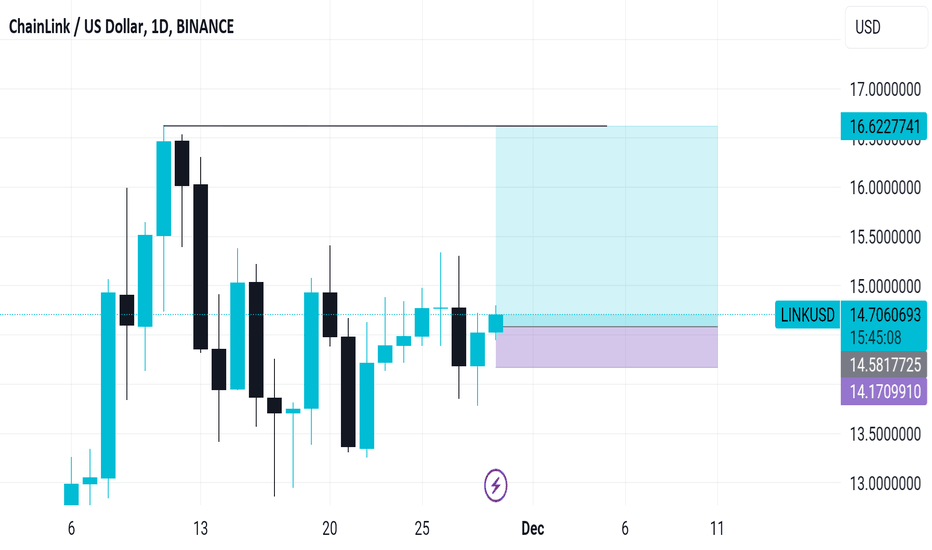
Bullish setup for BIST:LINK , lots of resistance below, should be going up soon
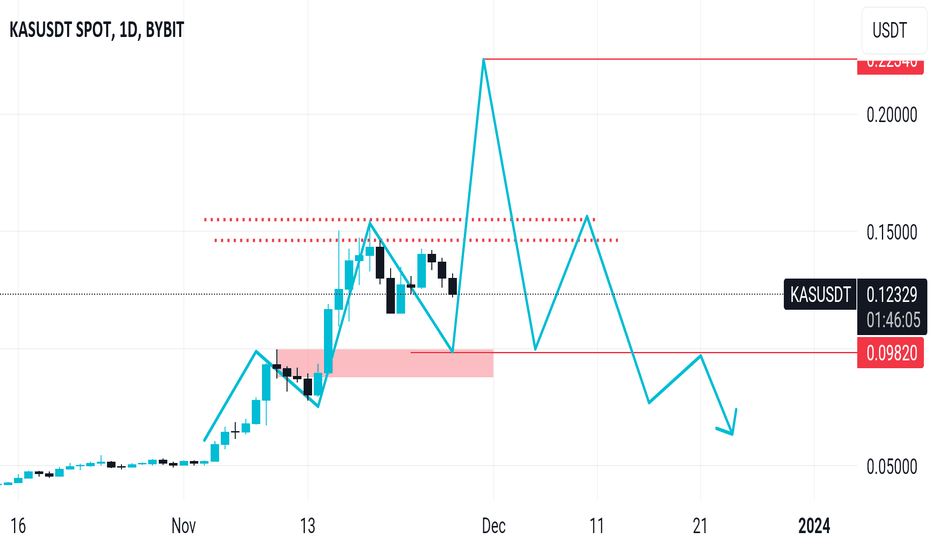
Full sentiment on #KAS Market structure, I'm still expecting new lows according to the market structure before new highs. Remember in market structure price movements mostly change but this scenario is a good roadmap for KAS Good luck Traders 😊
Buying Dot at this accumulation stage is the best long time investment, the Orange color price highlight is the best buy option for me, hold and wait for the distribution stage. Goodluck.
Bitcoin is forming a big rally to $48,000 to $50,000. At 48K is BOS and in the history of BOS a short rally is expected before retracement to $28,000
Today I will be teach on how to analyze Chart for possible Long/Short holds. We have three stages of market structure: >Distribution >Accumulation >Distribution Before you go into any trade, look at the higher time frame (1W 1D 4H) for a clear view of the market structure. Don't get this twisted, Accumulation stage can form either at the top to drive a bearish...
Today I will be teach on how to analyze Chart for possible Long/Short holds. We have three stages of market structure: >Distribution >Accumulation >Distribution Before you go into any trade, look at the higher time frame (1W 1D 4H) for a clear view of the market structure. Don't get this twisted, Accumulation stage can form either at the top to drive a bearish...
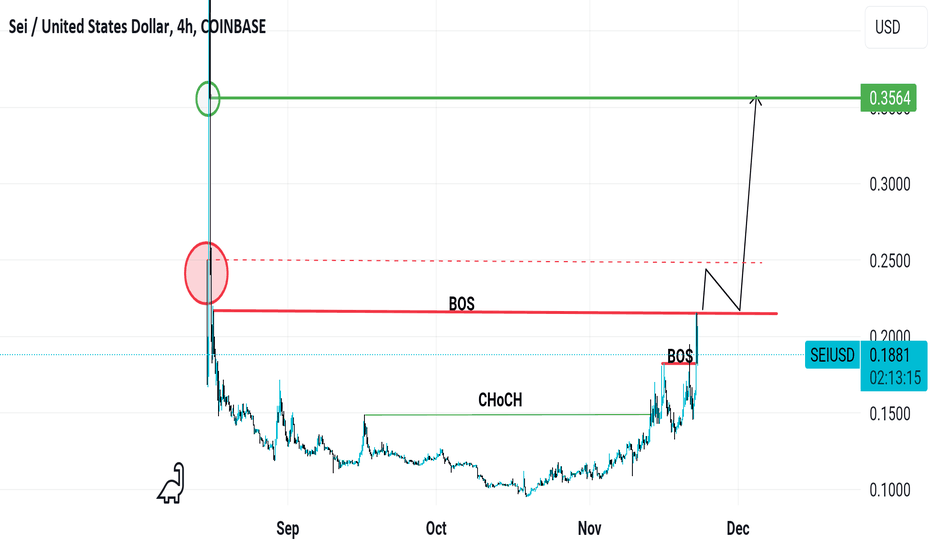
According to my previous analysis on SEI we successfully got a first BOS and I'm leaning towards breaking the main structure so we can seat comfortably for a good rocket ride to my green price highlight
CHFJPY looks extremely bullish, OB has been reached and it's in to put smiles on the faces of buyers, the green lines are my target
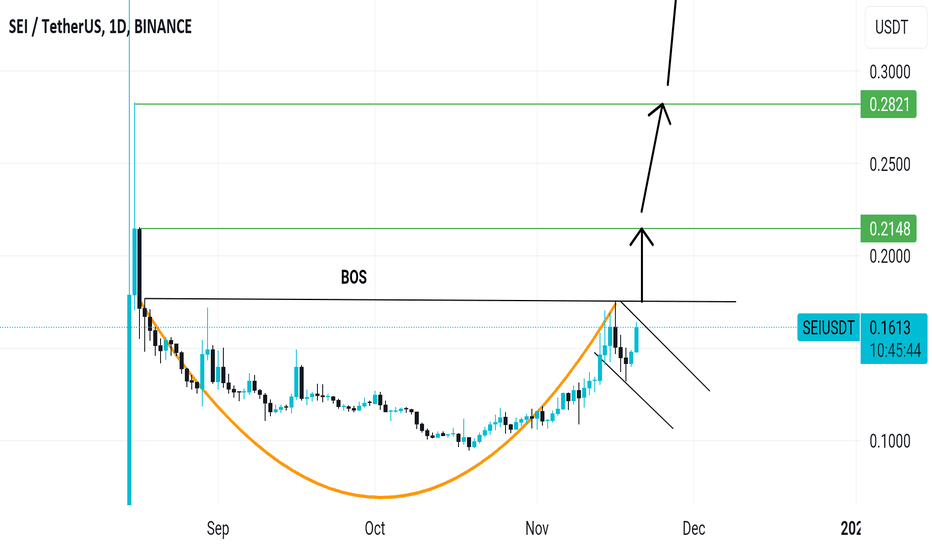
Cup and Handle pattern formed, in this pattern the handle is considered as a restest or support, If we get a successful retest and break the structure I will consider #SEI extremely bullish #SEIUSDT
