MasterAnanda
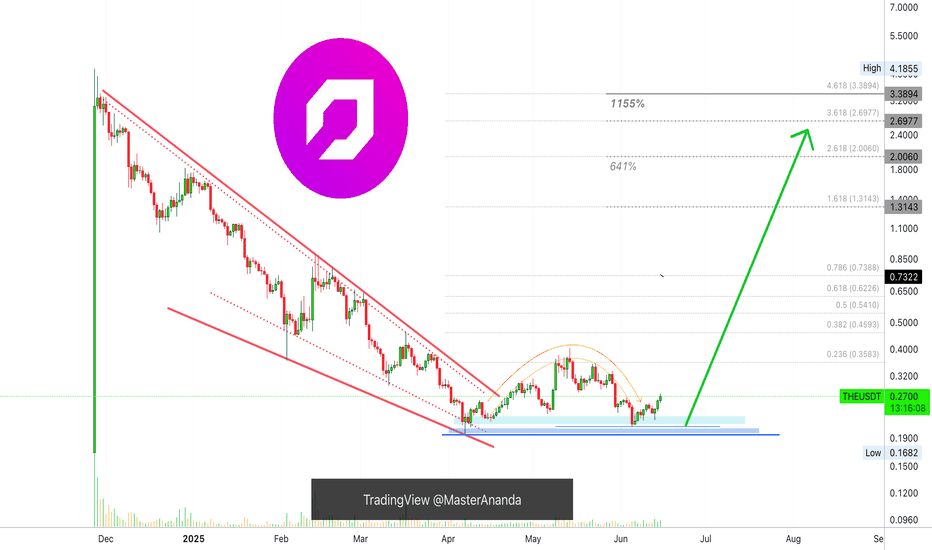
PremiumI don't like to post the same charts because there are just too many options and we cannot even get close to looking at all those, specially with a limit of only ten post per day. But, with that said, here we have Thena again, THEUSDT, why? Because it is ready to move and a great time-based opportunity only comes around so often. When it comes to Cryptocurrencies...
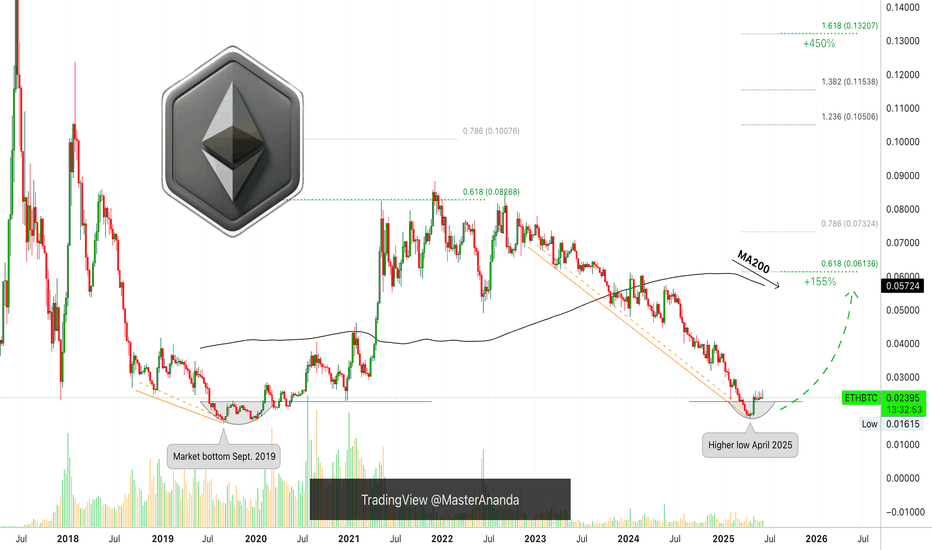
Ethereum is preparing a 155% rise vs Bitcoin, ETHBTC. The bottom is already in and this bullish wave confirmed. The 155% target is the minimum, "back to baseline," and it happens to match MA200 and the 0.618 Fib. extension level. The main signal is a rounded bottom after a major multiple-years long downtrend. The same signal ETHBTC produced back in September 2019...
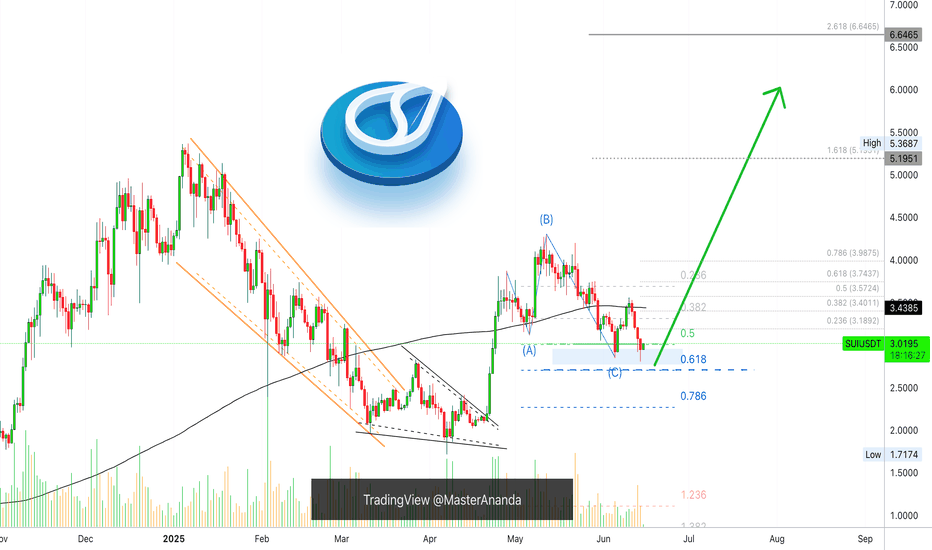
It's been 9 days since my last Sui update. The chart looks good. For context, see the previous analysis: We started at the C wave of an ABC correction. There was an attempt to push prices higher but resistance was found at MA200. The resistance produced retrace and the same support zone is tested and holds. If a new advance develops here, which is exactly what...
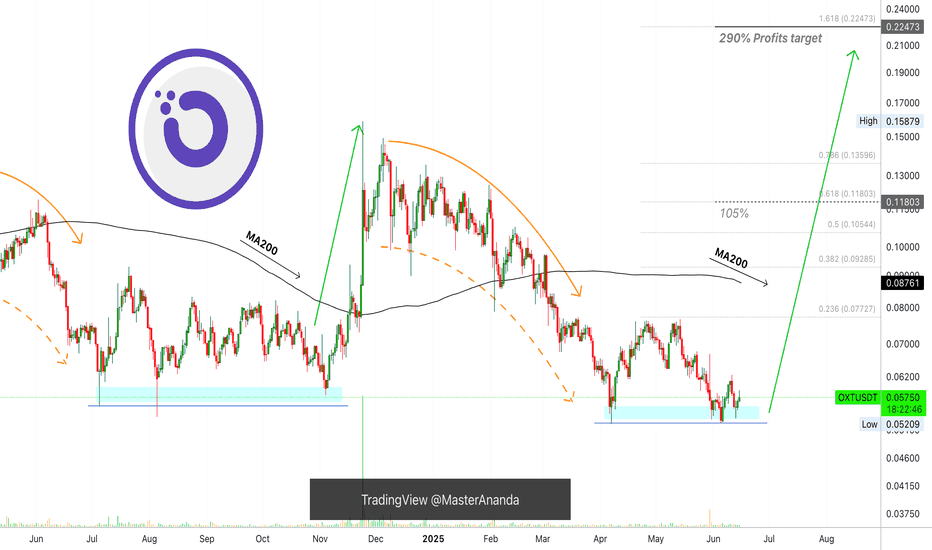
The classic signals are already present on this chart, the double-bottom, etc. But I also have a price action fractal plus an unconventional signal supporting a bullish jump. The easy target here is 290%, it can be hit within months. Not more than two to be more exact after the bullish breakout is confirmed. Long-term there can be more growth. The price action...
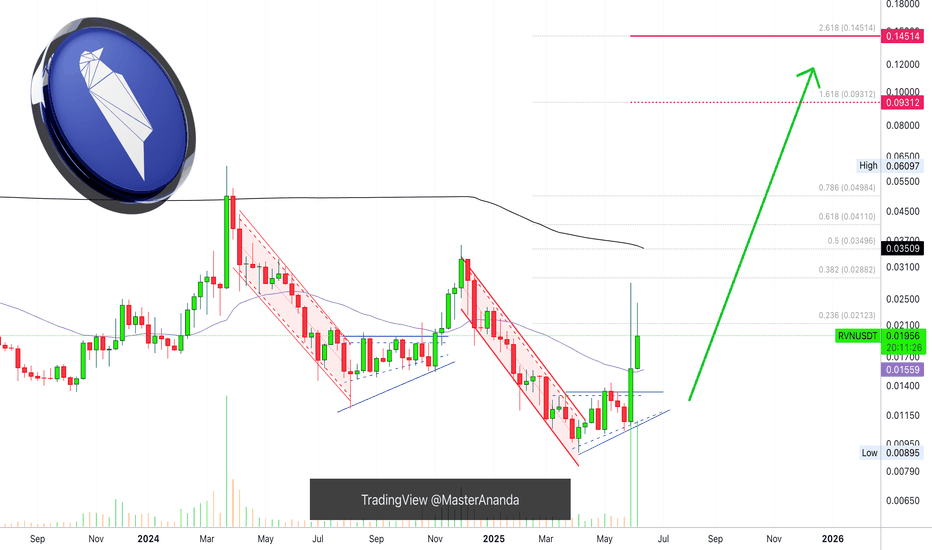
Ravencoin produced a major bullish breakout, we've seen many of those. It happens that you get one of these breakouts but the following week bullish action is dead. That was all, end of story. This isn't the case here and this is truly great news. First, Ravencoin produced some of the biggest volume ever, only once was there a week with higher volume and the...
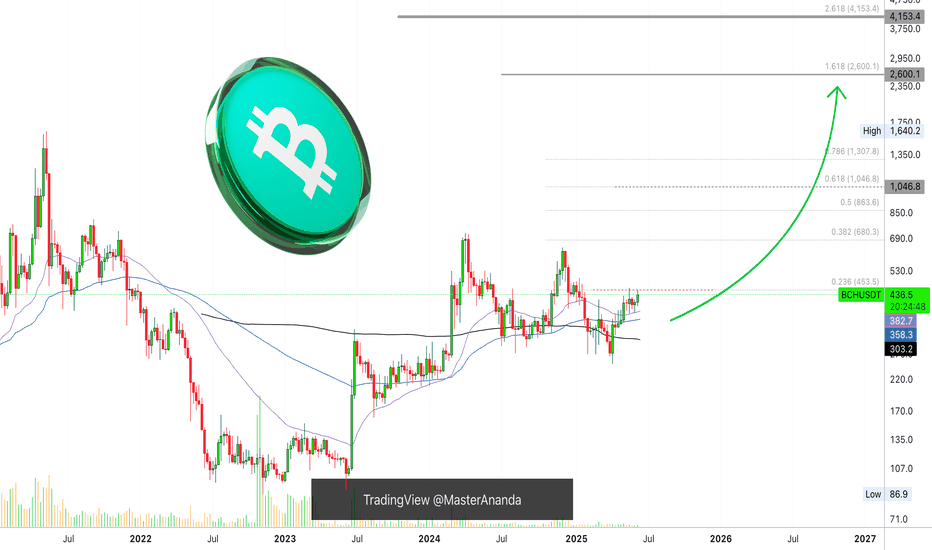
I already looked at Bitcoin Cash recently, this time I want to see how the moving averages are doing here to compare with the other Crypto-projects. Good news for one pair is good news for other projects as well specially when they are in the same category. Bitcoin Cash is one of the big projects. Here we can see BCHUSDT trading weekly above EMA34, EMA89 and...
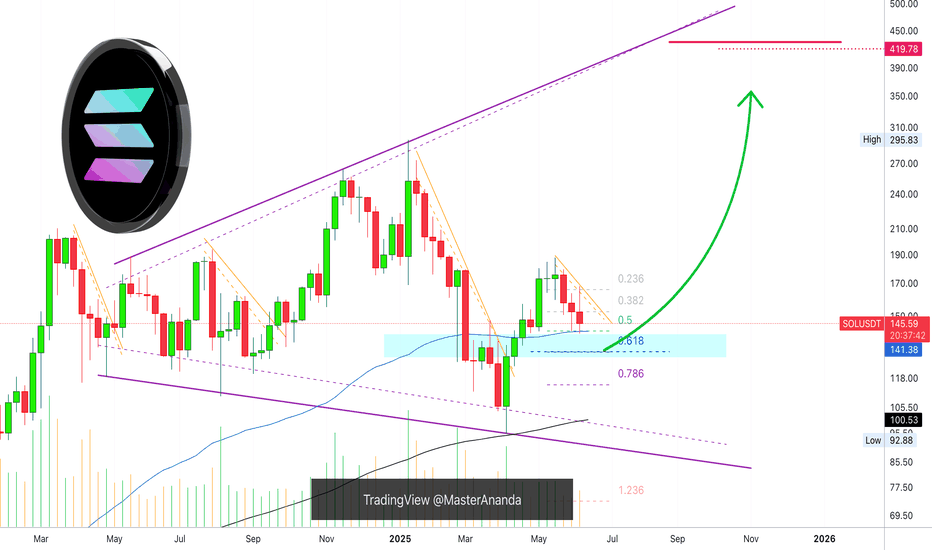
I've gone deeper into Solana's chart and I have good news... You are looking at the weekly timeframe. I looked at EMA34 and MA200 for some of the major Crypto projects, Bitcoin, Dogecoin, XRP, Cardano and Ethereum. You can find these in my profile @MasterAnanda. Some were clearly bullish as the action was happening above both moving averages, others were mixed...
Acala is now five weeks into the fire. If you read often you will understand clearly what I mean; if you are new, this might not make much sense. The low happened 14-April here, ACAUSDT. Some weak action and then red. Five weeks red and the action remains relatively sideways, not much change in price. Current price trades above the 14-April low. The 14-April low...
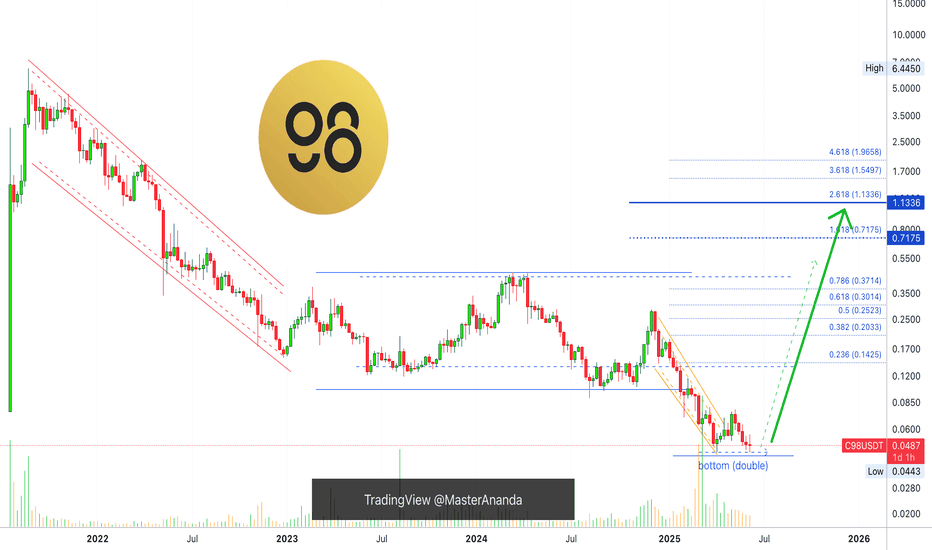
Here C98 breaks the pattern, a channel breakdown after going sideways for years. This is the liquidity hunt event. Two signals reveal that this drop is the bottom and precedes a change of trend. 1) The highest volume ever and since 2021 came in March as C98USDT looked for a new low. 2) We have a double-bottom. The bullish action will start without warning,...
Look at this, Bitcoin closed the day exactly above the 20-Jan 2025 high. This day Bitcoin peaked at $110,265, the all-time high before May; yesterday, 9-June 2025, Bitcoin peaked at $110,577.4 but closed at $110,270, five dollars higher. Is this a bearish or bullish signal? What to expect! Good evening my fellow Cryptocurrency trader, I hope you are having a...
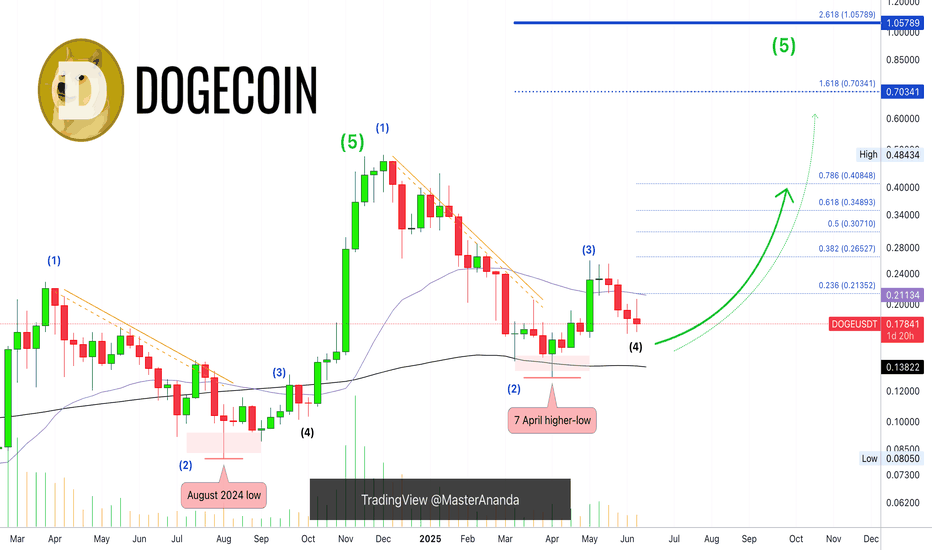
Just to make sure we have a little bit of everything, here we have Dogecoin sandwiched in-between EMA34 and MA200. » XRP is trading above these two levels. » ADA is trading below. » ETH is trading above. » BTC is mixed. Seeing DOGE in-between can reveal a few things. No drama, MA200 will hold. MA200 sits at $0.13822. Notice the drop between December 2024 and...
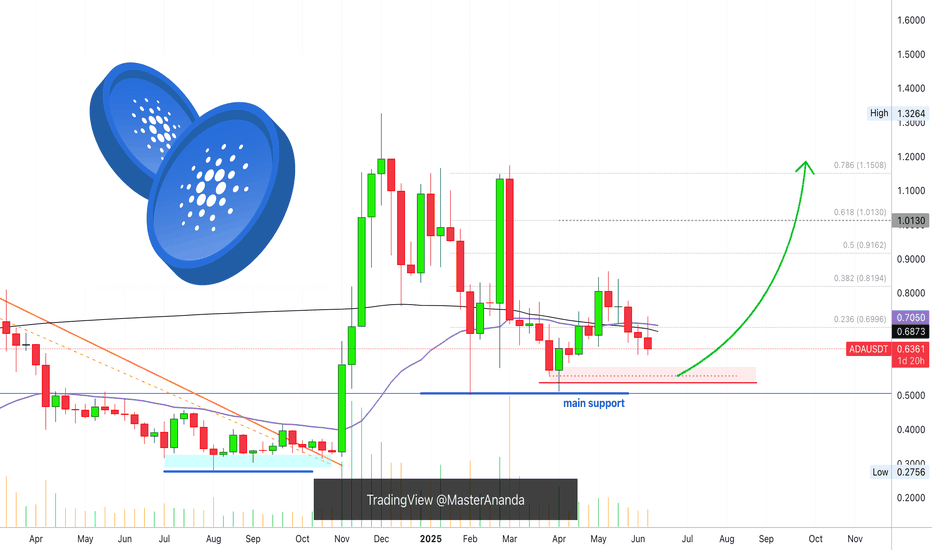
Cardano weekly doesn't look as good as XRP and Ethereum, this is true because I am using the same indicators. Here we can see ADAUSDT trading below EMA34 and MA200. We can even see an attempt this week to move higher followed by a rejection, this means that there can be some more bearish action before higher prices but this bearish action can easily happen...
The line on the chart stands for EMA34. Notice two things about this level: 1) It was challenged 7-April but the action closed above. 2) The action "now" remains above this level but it has not been tested again, this is a bullish signal. When it comes to the weekly timeframe, long-term, XRPUSDT continues bullish, with a bullish bias aiming higher. What we are...
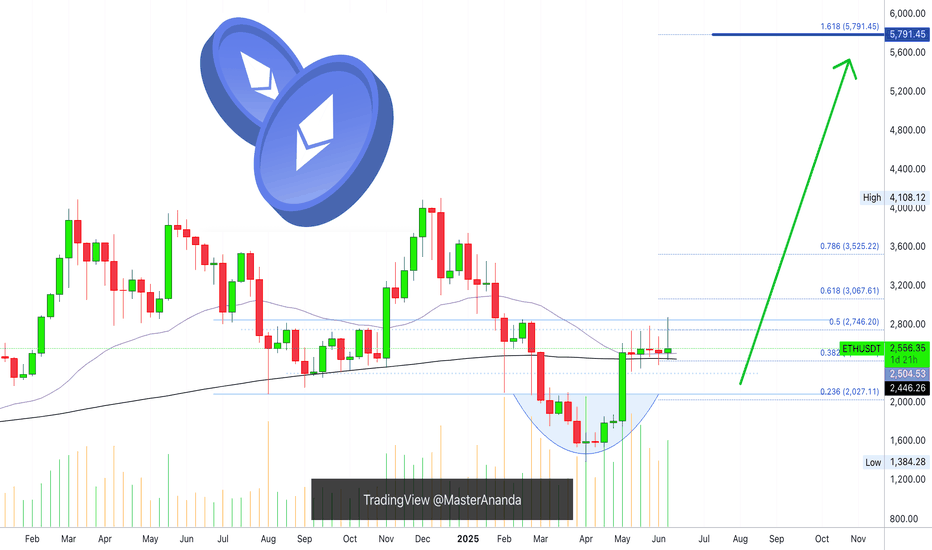
Ethereum has been sideways five weeks straight. Market conditions here are bullish and bearish short-term. Let me explain. The market has bearish potential because of resistance. Ethereum has been facing resistance and fails to move forward for more than one month, but the bias isn't bearish, this is just a potential based on short-term price action. The market...
This is the definitive analysis based on the weekly timeframe. Depending on how the weekly session closes the market trend will be defined. Bitcoin is both bearish and bullish. Let me explain. » If Bitcoin can move and close weekly above $110,000, market conditions are considered bullish and we can expect higher prices. » If Bitcoin moves and closes weekly below...
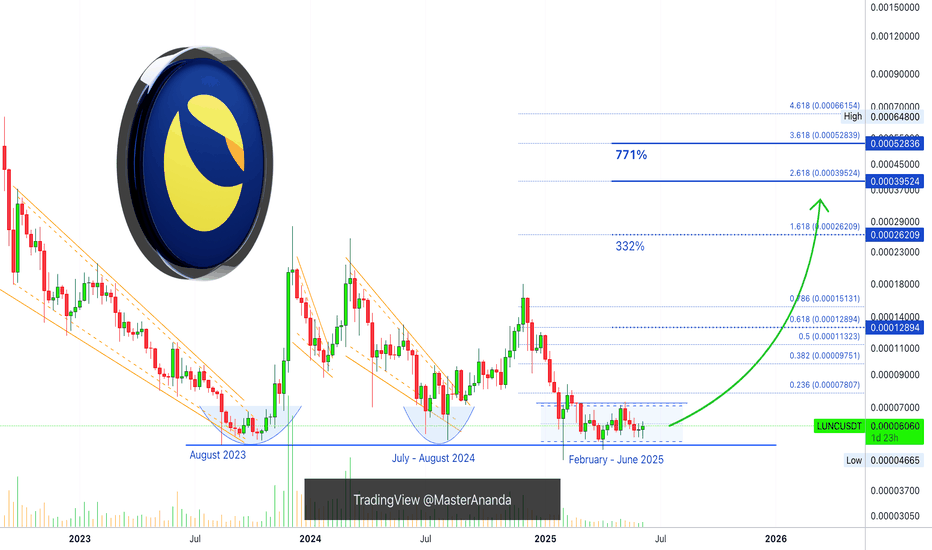
You can say it is a long-term (LT) triple-bottom when taking into consideration the July-August 2024 support. Terra Luna Classic (LUNC) has been reacting at the same level for years. Each time this strong support range gets challenged, what follows is a bullish wave. » August 2023 marked the bottom of the bear market. And this produced a bullish wave. »...
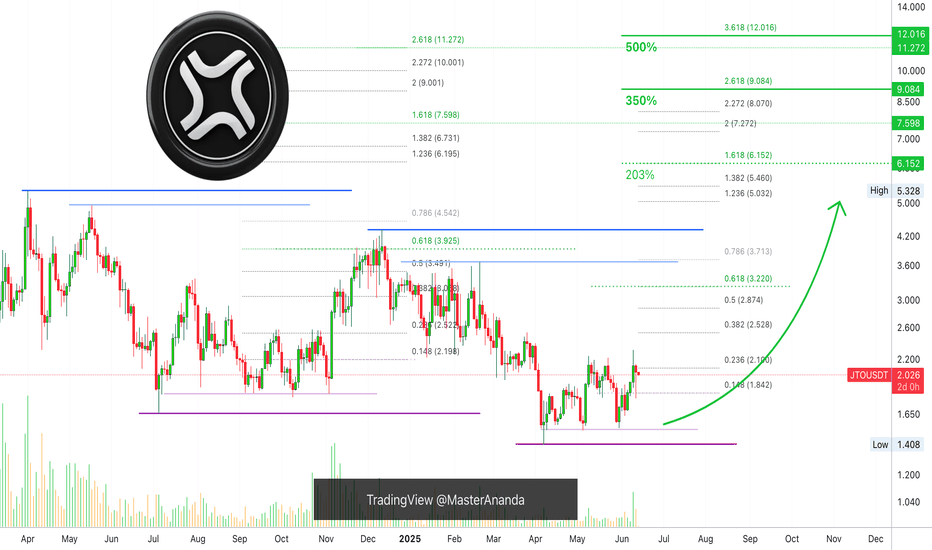
The same market conditions prevail on this chart as with many other altcoins. The low is in. The low has been in for months, since 7-April 2025. The advance has been happening very slowly and this is good. There will be a point where everything is up "out of the blue." No blue here, no surprise. When you see everything goes up 300% or 500% in a matter of weeks,...
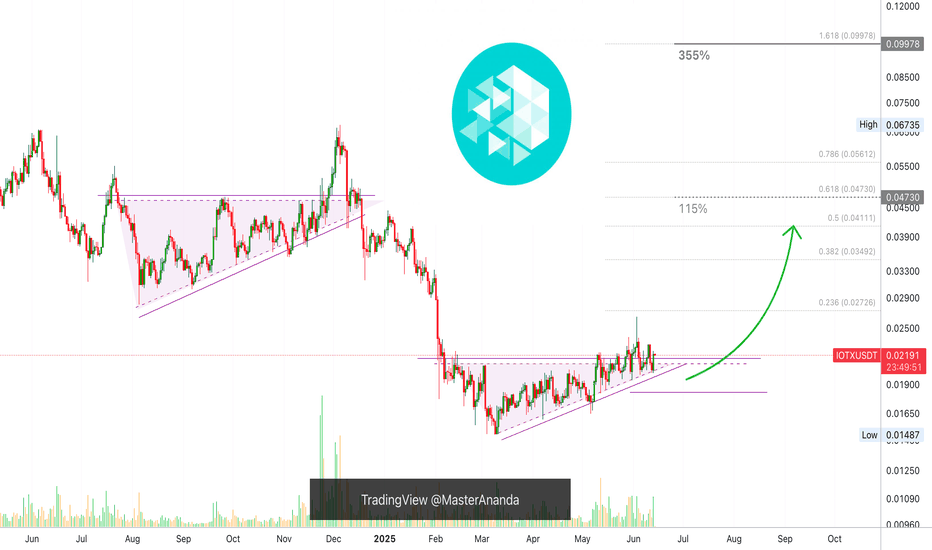
This is one of the best types of chart setups, very low risk and a high potential for reward. Let me explain. IOTXUSDT hit bottom mid-March, after this bottom, it has been consolidating bullish for more than three months. If we take the drop produced in early February as the start of the consolidation phase, we are talking about more than four months sideways,...
