PersaGold
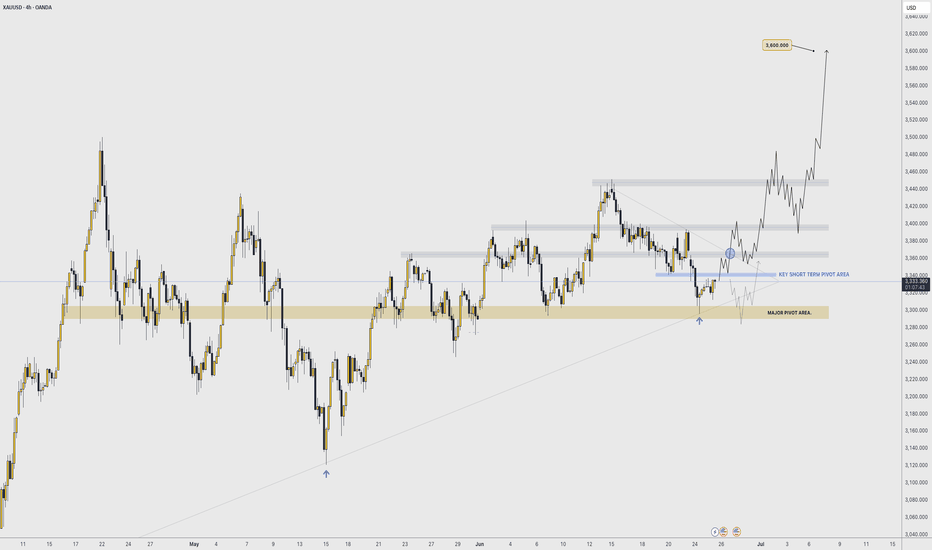
EssentialAs illustrated, Im trying to visualize what a potential bull run could look like starting from what seems to be a "bullish signature" move by gold: a diagonal double bottom. Don't believe me; go back in time and study how gold makes bottoms and how new bull runs start. The fact that it was NY that manipulated BOTH times and got the best price, is a strong...
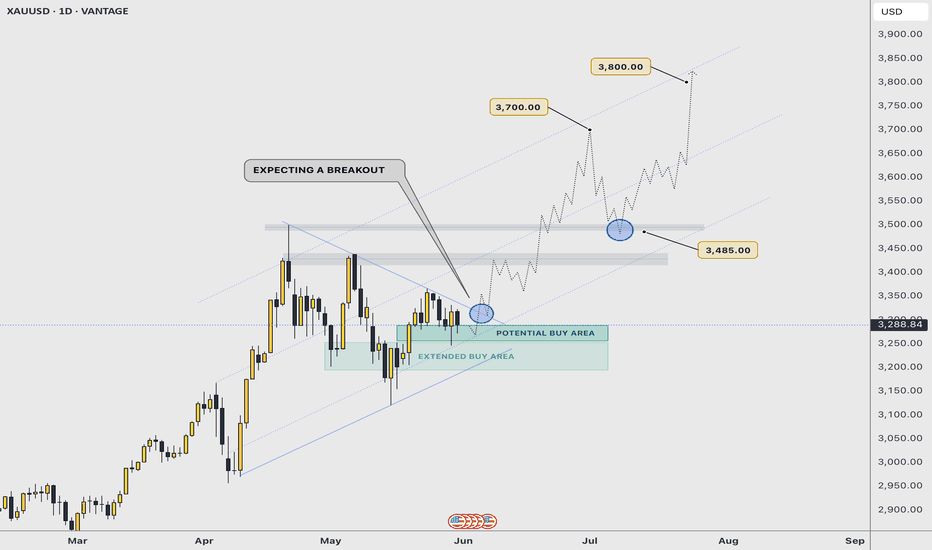
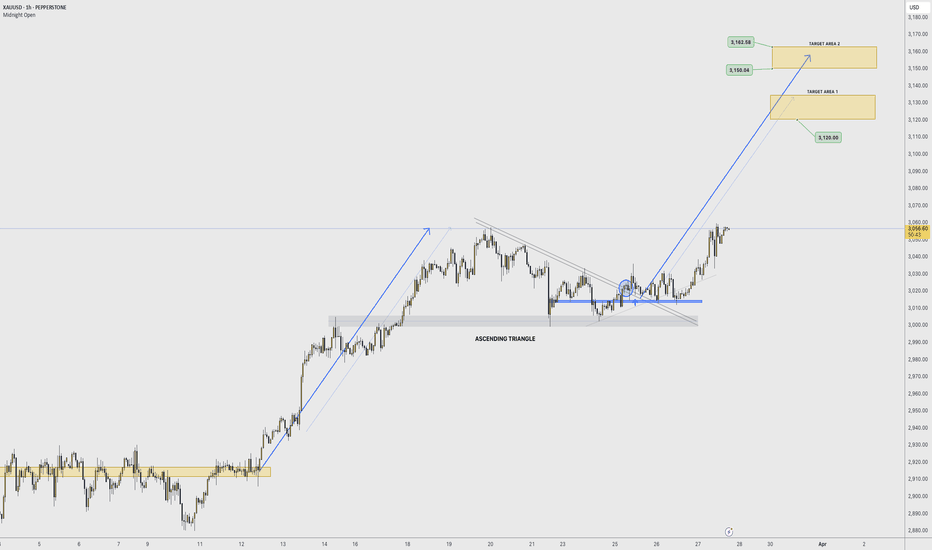
As illustrated, I’m visualising the next potential bullish continuation impulse that would take gold near the $4000 projected price. In this idea, the path projected is based on the breakout of a rising symmetrical triangle that price formed; a strong bullish pattern that tends to be very effective when price successfully breaks out with strength. On a...
As illustrated, Im trying to visualize the beginning of the next impulse toward $4,000 This is an intraday - swing trade opportunity to 1H highs; however, it would be just the first move toward a longer term path to ATH above $3,500 Ride this wave as you can, but know that the yellow metal still has a lot of strength and power to continue growing. June might...
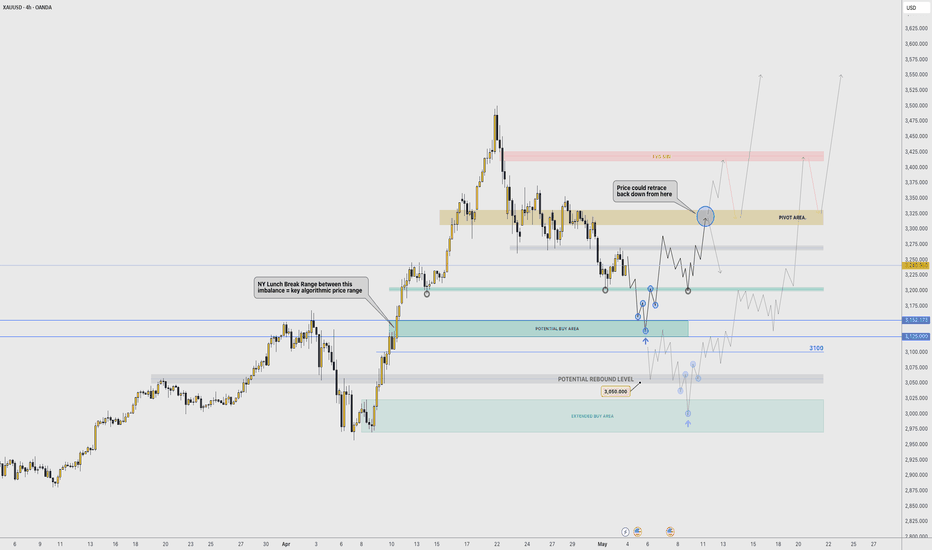
As illustrated, I'm trying to visualize what the next couple of weeks could look like. Taking into consideration the fact that May + June are corrective months for gold historically (don't believe me; check the seasonality tool...) , Is likely for price to range up and down within quite a wide range anywhere between 3300 and 3100 before it enters a bullish...
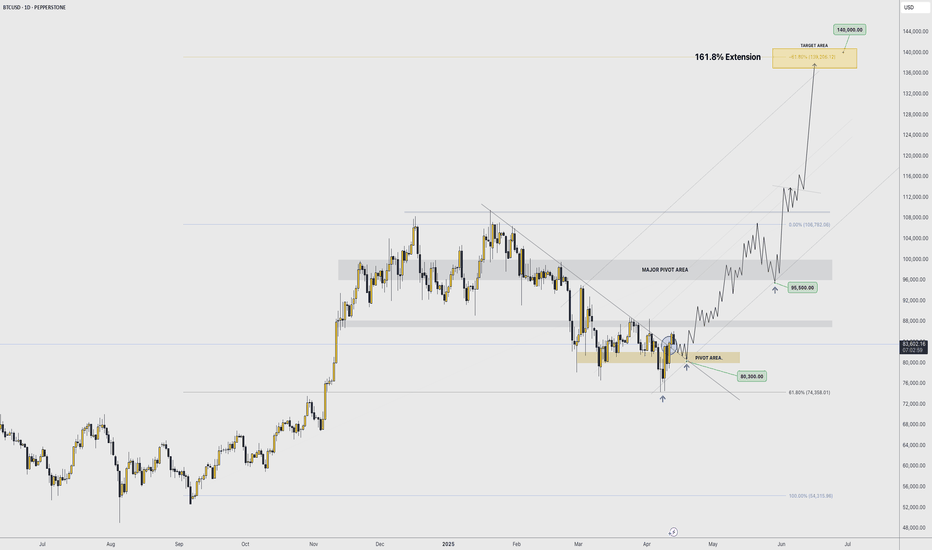
As illustrated, I'm visualizing what the next impulsive wave could look like. Price has broken out of a major daily trend line. It makes sense for the week to have started trading lower to find it's low and potentially bounce with strength sometime this coming up week and into the next. The next pivot area is between the $82,000 - $80,000 range based on...
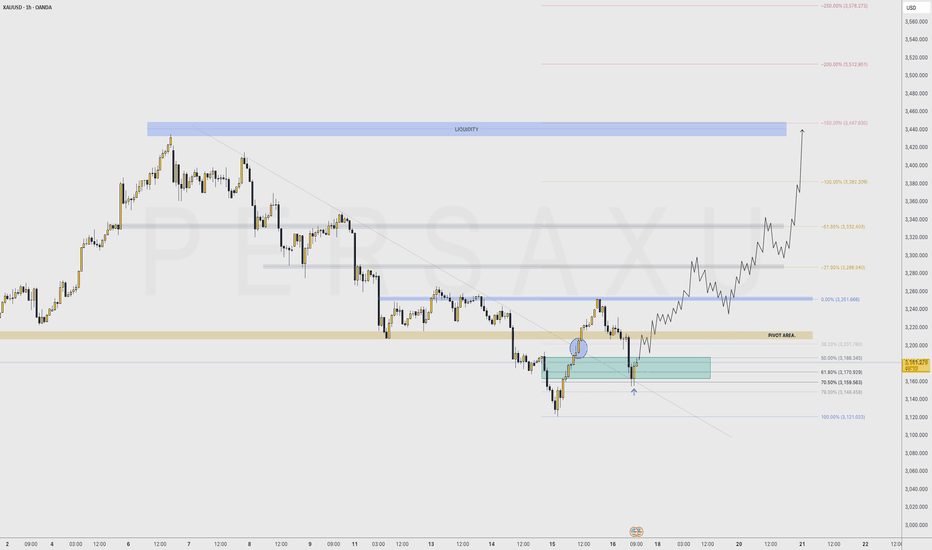
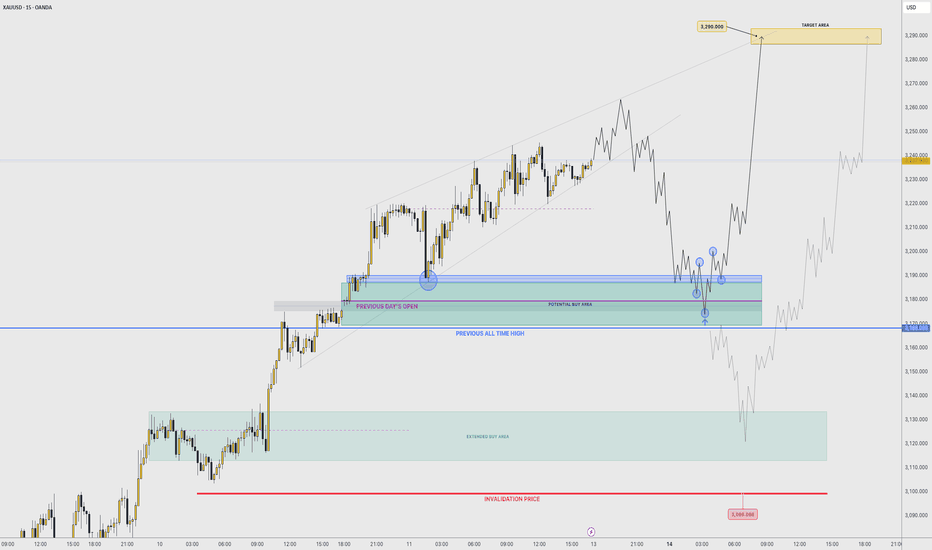
As illustrated, I'm trying to visualize a brief pull back next week making the low of the week early into Monday. Potentially ASIA making the week's low on Monday's open. I was able to visualize the path to 3200, and showed in a past idea how 3200 COULD HOLD as support ... so I wouldn't be surprised if price doesn't even get to 3100, although it could very...
Possible extended correction. Be cautious, be patient. SECURE PROFITS. - GOOD LUCK
Price is likely to re-test NY's lunch break range and grab liquidity below the 13:30PM NY EST low. Asia should distribute strongly toward new ATHs and London would likely retest current resistance levels and bounce as well. NY might enter at fest highs to create yet another manipulation to the downside to grab a discount price level. I'm expecting price to...
Classic bullish continuation pattern. Expect accumulation phases along the way, BUT NOT retracements. Good luck
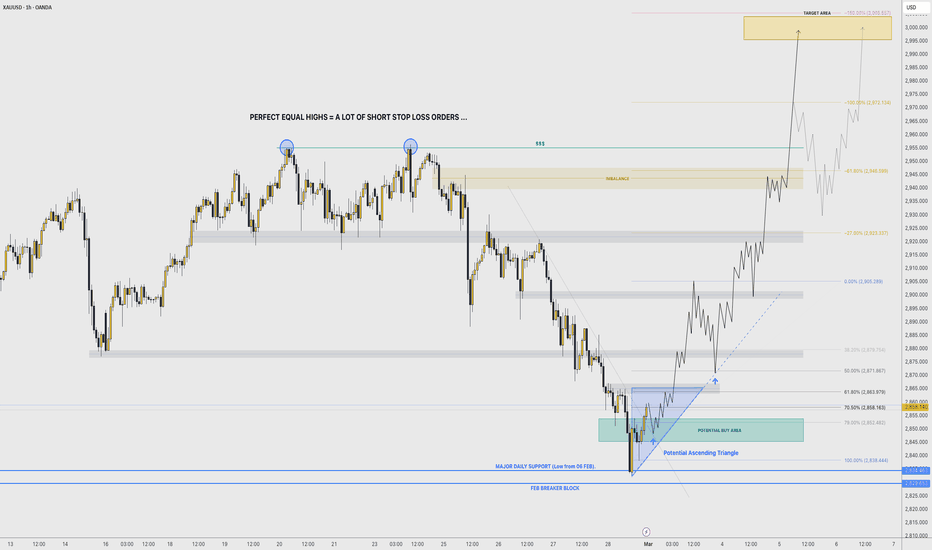
As illustrated, Im visualizing a strong beginning to a historical bullish MARCH. On average in 15, 10, and 5 years, MARCH has been mostly bullish. To anticipate a bullish march, FEB must make sense and leave a few clues that could indicate a healthy setup for a potential buy opportunity. In this case, FEB made a natural correction toward the end of the month...
As illustrated, Im trying to visualize what could have been a bear trap. Price actually consolidated at the ATH level, instead of selling off like it has done in the past when liquidating massively... That behavior goes against "usual" patterns of selling, which leads me to believe that the obvious won't be that easy. Until the market proofs otherwise, I...
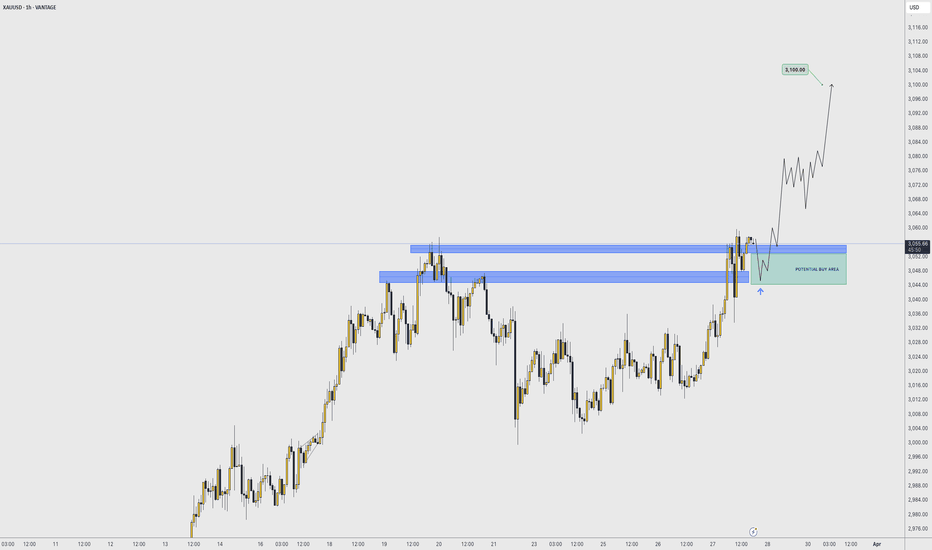
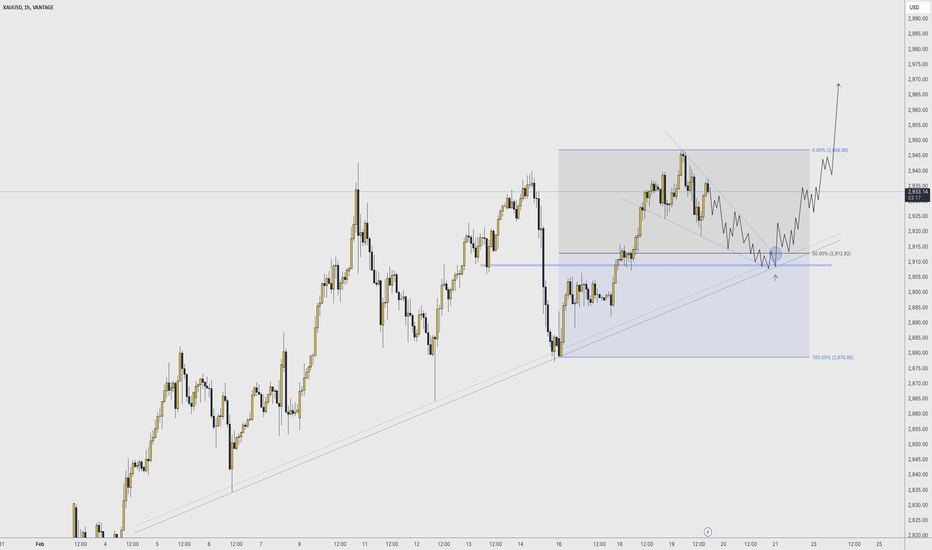
As illustrated, Im trying to visualize a falling wedge pattern into the 50% retracement of Monday's impulsive push, for what could be a potential buy point to continue the uptrend. Nothing to get fancy about. This is just a chart analysis based on a potential corrective pattern that could take place within the next 24 hours and into tomorrow's NY session. It...
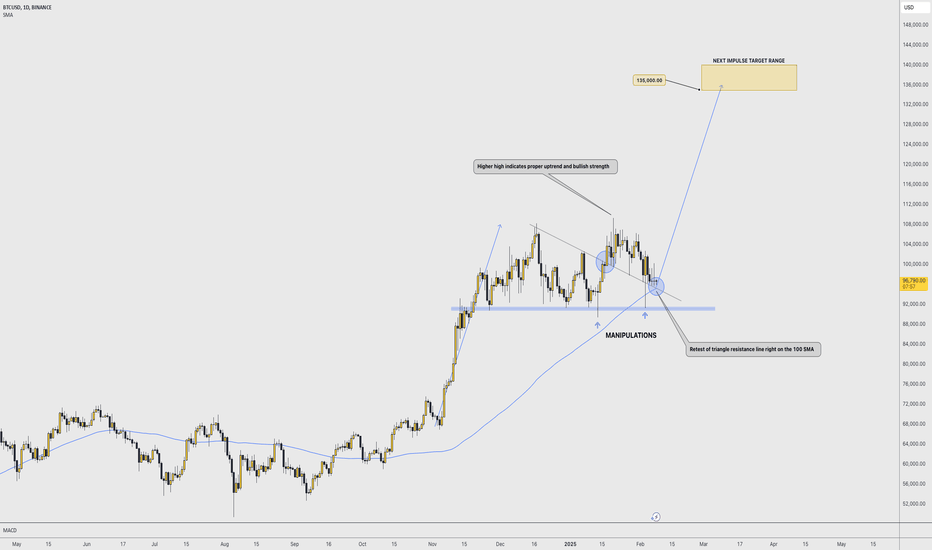
As illustrated, I'm trying to visualize a potential rebound off of the 100SMA that matches the resistance line of what looks to be an ascending triangle that has been broken and retested. Price is showing support at such line that happens to overlap with the 100SMA. I might be "wanting to see" bullishness in the market, but you be the judge of these...
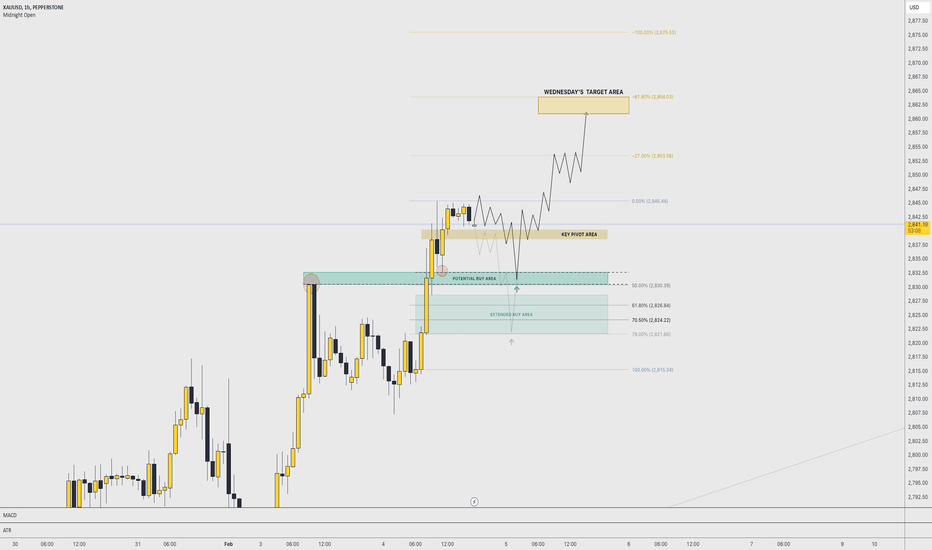
As illustrated, Im visualizing the continuation impulsive move, where price respects SYDNEY'S range as a PIVOT AREA for entry to a new expansive cycle. 1H candles must respect the major support where market has grabbed liquidity. And also close bullish with strength during ASIA's session, indicating their intentions of buying. London would and should follow...
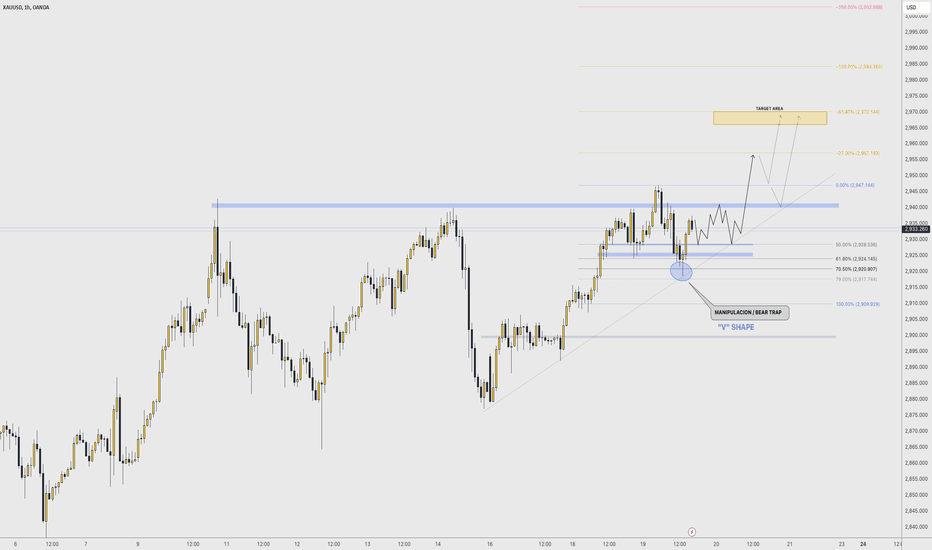
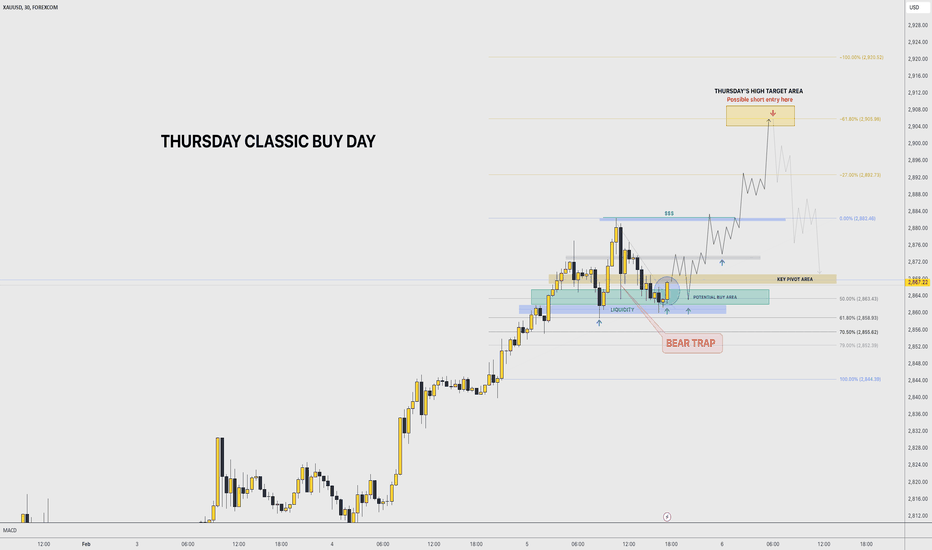
As illustrated, im trying to visualize a bullish classic buy day, where price manipulates under consolidation area that is formed during SYDNEY . The manipulation should occur between 02:00 AM and 03:00 AM NY , during ASIA'S algorithmic price delivery macros. Should there be a "V" SHAPE formed between that time window , that would indicate that a...
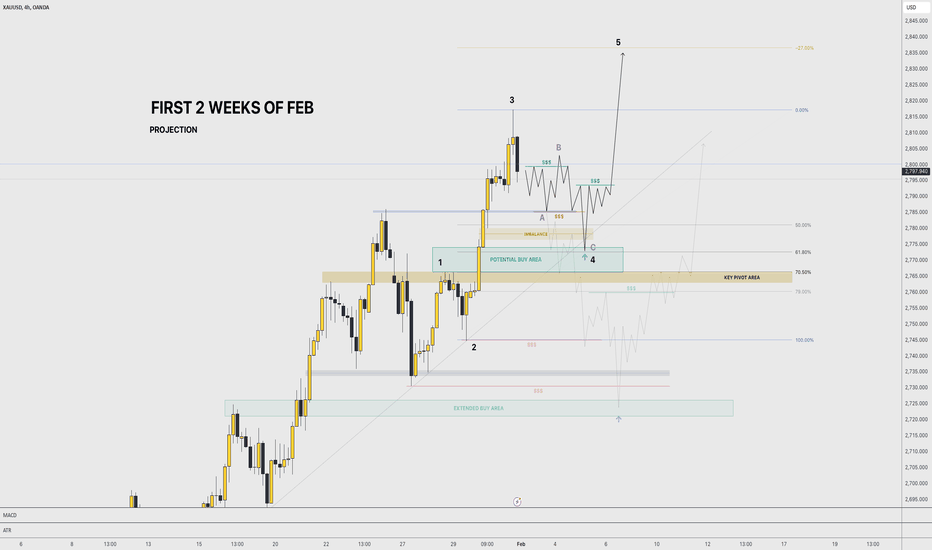
As illustrated, I'm trying yo visualize the first couple of weeks of FEB. If things go according to plan, the market should hold its uptrend as it has shown in a healthy and appropriate manner; in other words, respecting key pivot areas, major trendline, demand areas, and so on. The market structure we are seeing, brings back memories of last year's SEP + OCT...
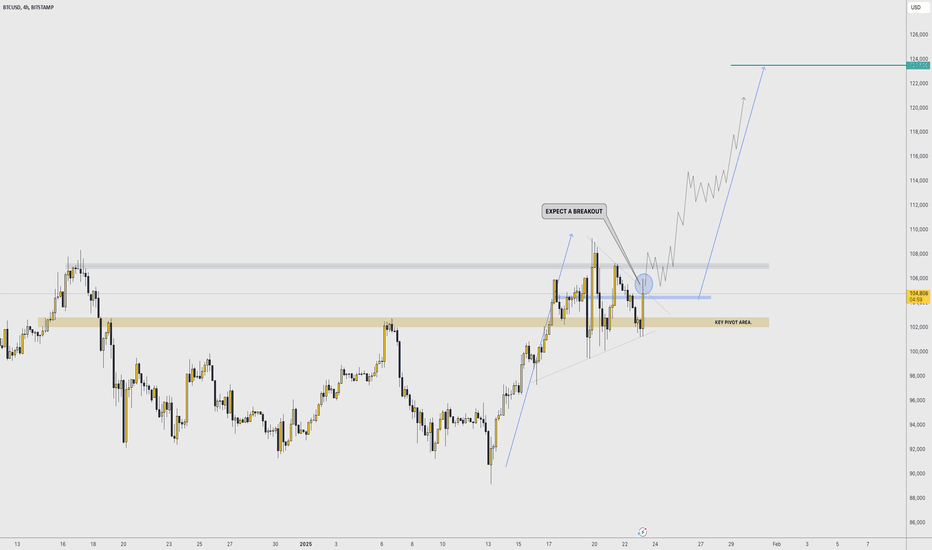
As illustrated, I'm visualizing what could be the breakout of a symmetrical triangle. Because this structure formed above key pivot areas and psychological price level of $100K, there is reasons to believe it indicates a healthy and adequate uptrend, being such pattern a continuation with a potential new bullish impulse that could drive price to new ATH at...
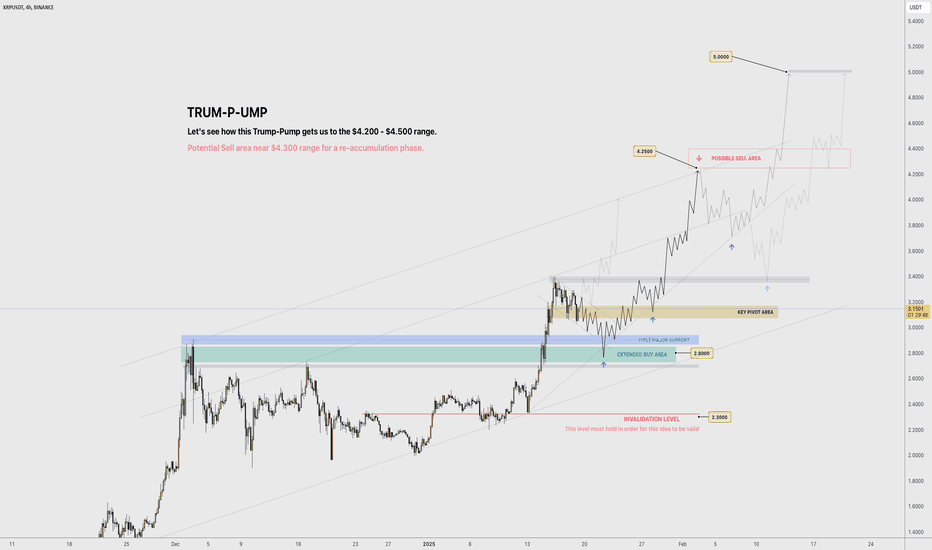
As illustrated, I'm trying to visualize a potential path to ATHs between $4.250 and $4.400 price range. Once there, we could see a sell-off of short term traders liquidating their long positions near the $4.500 psychological price level + long term holders closing a small amount of their profits to secure some cash. That being said, keep an eye for a...
