Princessgirl
PremiumNVDA is continuing downward. I have the target as being around middle of October or later. I used the Heikin Ashi candles: 1: They show more of a directional movement. 2: They tend to filter out the market noise, so you can see the direction better. 3: it reduces false signals, allowing you to stay in the trade longer. 4: And it also gives a smoother appearance...
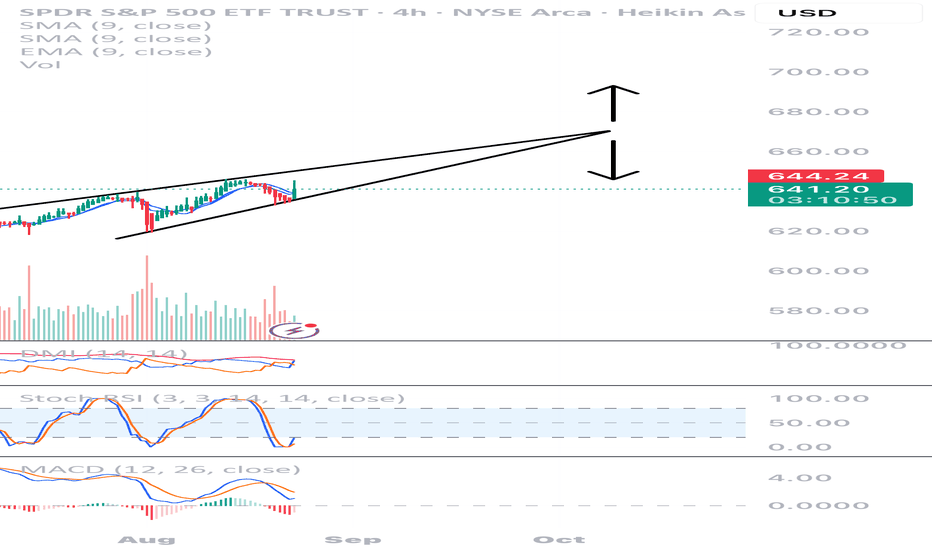
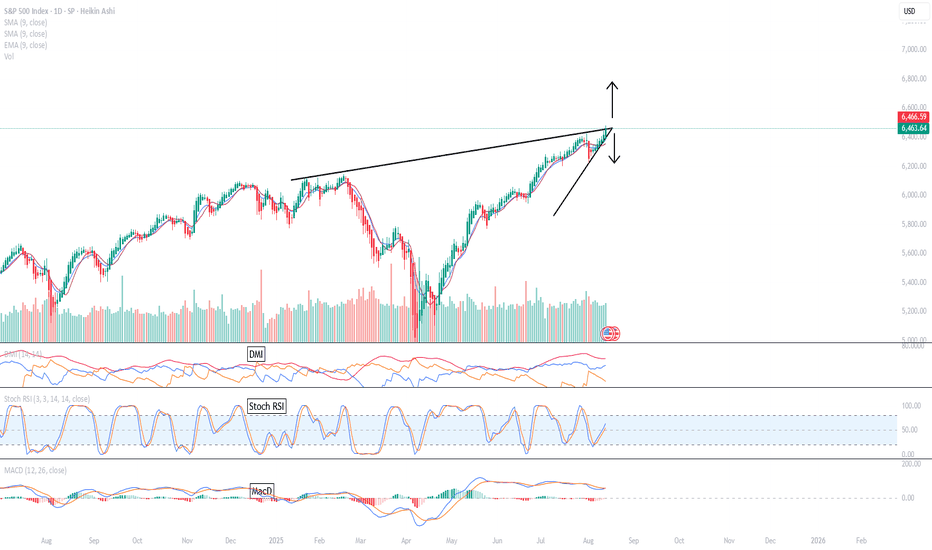
The SPY is continuing upward. I have the target as being around Oct. 9th. There will be a few reports coming out that day including jobless claims, etc. But the market can always exit the triangle prior to the expected date usually around 2/3 to the tip of the triangle. I suspect it will move lower in October but I will wait and see where the indicators are to...
making the tip of the triangle widen a little, therefore putting the tip of the triangle farther out. The tip of the triangle is now at around Sept. 2, 2025. Technically, the equity or whatever you are trading can exit out of the triangle anytime from 2/3 to 3/4 of the triangle length. Since the half and hour and the one hour indicators are indicating a bullish...
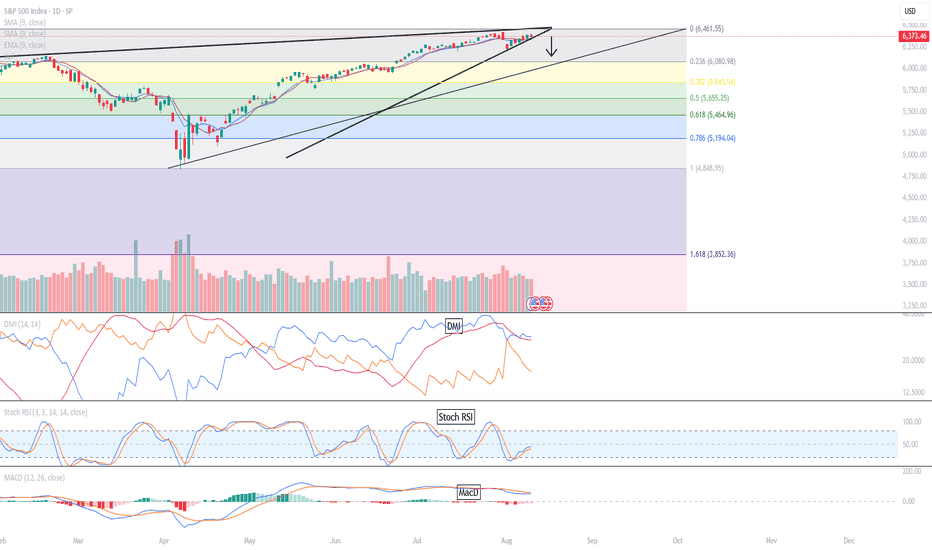
but the daily indicators are looking more to an upward move now. I drew a previous chart anticipating that the market would be bearish. (Please look at my previous chart for more details) But looking at the daily indicators, they look too bullish for me. As well, the S&P technically traded out of the triangle today which indicates a bullish trend. And if you...
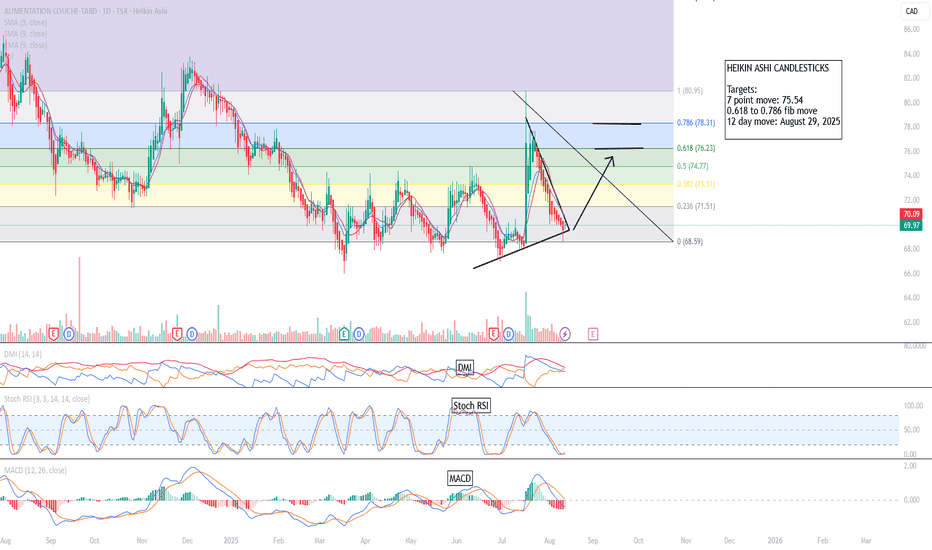
I am working outside my comfort zone today! I usually stick to the DIA or the SPY or SLV, but I am trying to expand my horizons . I may even try another chart if I have time. You should be able to trade any stock or asset regardless of what it is. All charts are the same. It just has a different title on it. I got this stock suggestion of it being bullish from...
After my last BAD trade prediction, I just laid low for a little while, was very sick and visited some relatives for a little while. But I am jumping back on the horse, as they say. I anticipate the market to go down this Thursday when jobless claims are reported. I expect for whatever the news for it to be negative or not as good as expected. I am using the...
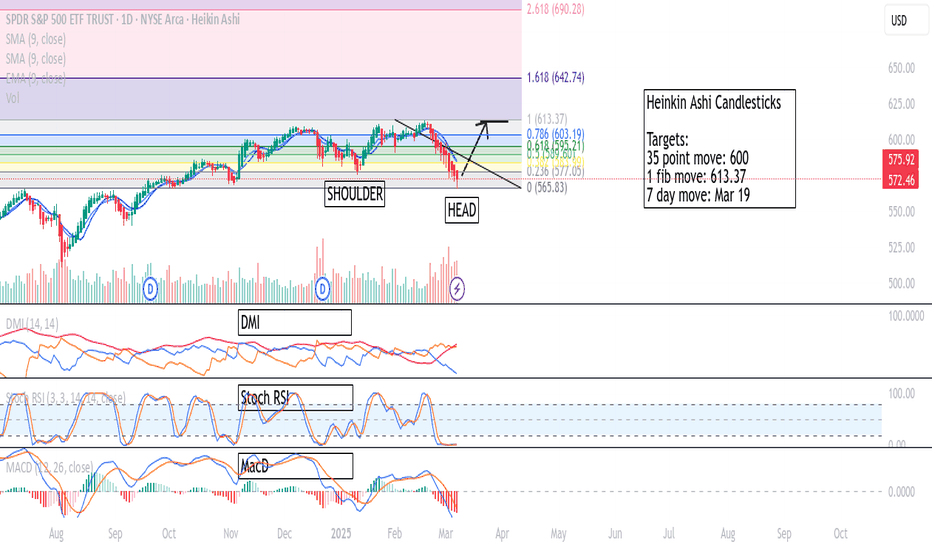
The market is going to be bullish after the bearish move we just witnessed recently. Typically, I switch to the weekly format to see a larger move. You can see on the weekly chart, the Stoch RSI is turning bullish. I recently made a 3-day format which shows the indicators are already showing a bullish trend. I will post the 3 day chart/indicators as well as the...
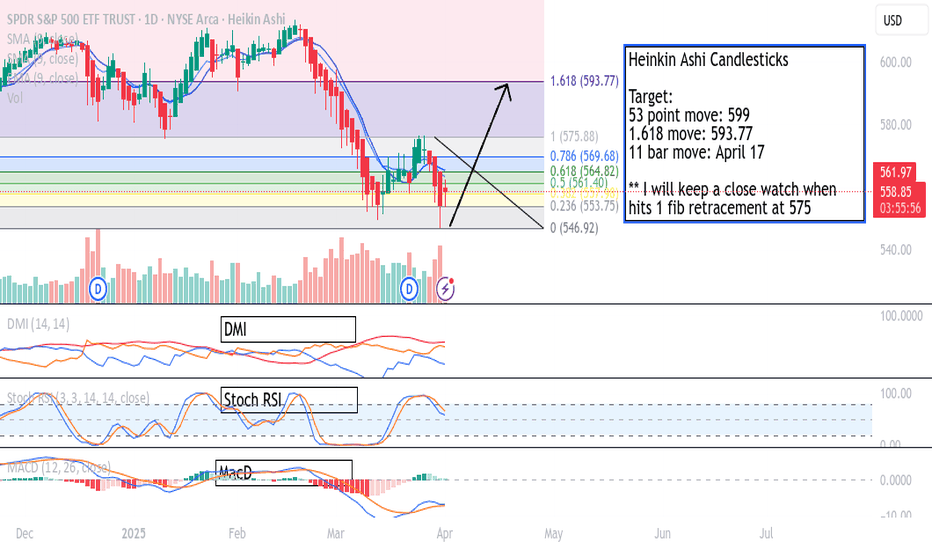
I originally thought this may be a triple top or triple bottom but there may be an inverse head and shoulder pattern forming. We will not know for sure until the next shoulder possibly forms which would be around the end of April, 2025. A typical inverse head and shoulders pattern is a trend reversal pattern that signals a potential reversal in a downtrend.The...
I thought I would update this chart as the triangle has adjusted slightly since my last 2 posts. This makes the tip of the triangle farther out as well as a different projected time of the SPY exiting out of the triangle. The tip of the triangle is now around Mar 18th and there are many events until that time that could push the market out of the triangle such...
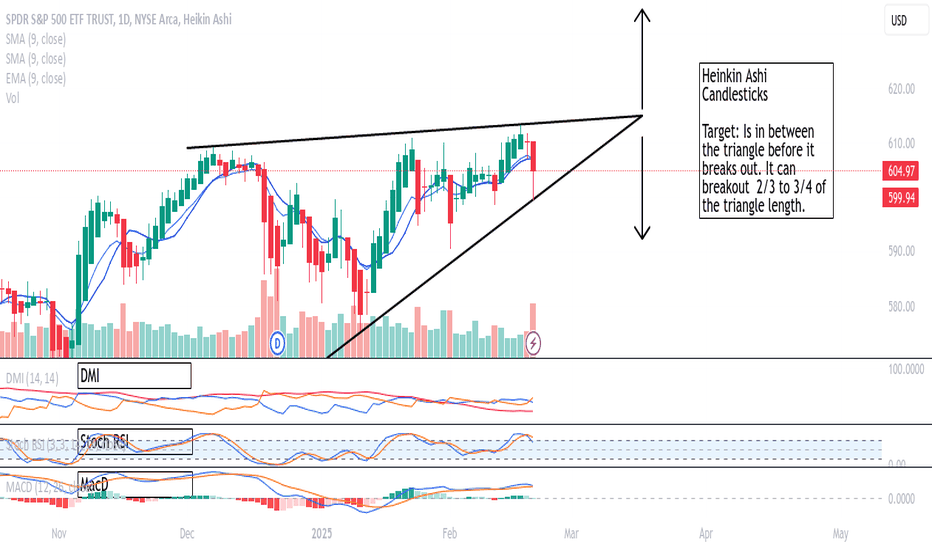
My previous chart may still be valid, but I will build on it with a new chart. We are seeing a triangle formation with the tip forming on Feb. 12. We should see the market breakout, either up or down before the tip. (I typically switch to the hourly charts when drawing my triangle formations to get a more precise drawing. But oftentimes, that will make the lines...
The market will go up for the next 3 more days. I am using the Heikin Ashi candlesticks. Why Heikin Ashi candlesticks? 1) They show more of a directional movement within candlesticks. 2) They tend to filter out the market noise so you can see the market direction better. 3) It reduces false signals, allowing you to stay in the trade longer. 4) And, it gives you a...
The market will go up for the next 10 days. I am using the Heikin Ashi candlesticks as they: 1) show more of a directional movement within candlesticks, 2) they tend to filter out the market noise so you can see the market direction better, 3) it reduces false signals, allowing you to stay in the trade longer, and 4) gives you a smoother appearance making it...
I use the Heikin Ashi candlestick as they show more of a directional move within the candlesticks. Today the market went up, although you cannot see that on the Heikin Ashi Candlesticks (just on the regular candlesticks.) Typically, I would not enter until I see 2 green candlesticks on the Heikin Ashi candlesticks. But you can see on the 1-3 hour charts that...
The SPY will continue going up until Trump's inauguration on Jan 20th. I think there is a high probability it will hit 633 the day after Trump's inauguration on Jan 21st. (I have the arrow pointing to the fib number of 1.618 but I really think it will go higher than that) I typically use Heikin Ashi Candlesticks as they show more of a directional move as opposed...
The SPY will start going up and continue into the New Year for about 14 days which has been the average upward movement in the past few months. I typically use Heikin Ashi Candlesticks as they show more of a directional move as opposed to regular candles. However, since I have used regular candles in the past, I tend to switch back and forth until I get more...
In my last chart I didn't account for the market trading sideways before heading downward so I have decided to do another chart. There is a FED meeting this week. I suspect on the day of the announcement on Wednesday, Dec 18, the SPY will be more volatile like it has been on the last few announcements from the FED. Then on Thursday and Friday following the...
This is going to be quick.... busy right now. You can look at my other charts to see the explanation of why I use the Heikin Ashi candlesticks. The SPY is going to drop until Christmas. You can see the indicators on the daily chart shifting towards a downward move. I believe you will see a zig zag move with this drop. This week the market will drop. Starting...
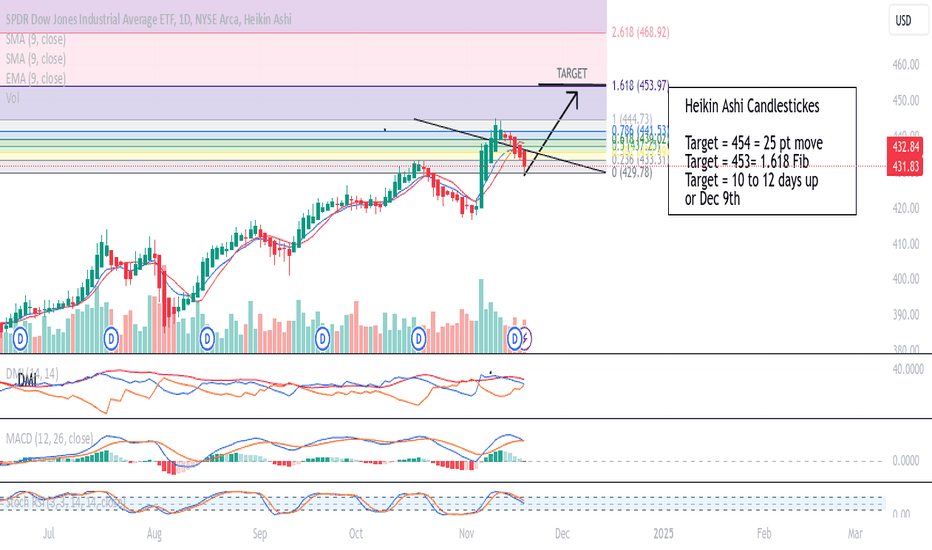
I am using the Heikin Ashi candlesticks as they show more of a directional movement thru the charts. Typically, you should wait until there are 2 green Heikin Ashi green candlesticks before entering. The typical uptrend of the DIA has been about 10-12 days. The typical move of the DIA has been about a 25 pt move per month which is about 454. The target of the...


