ProfittoPath
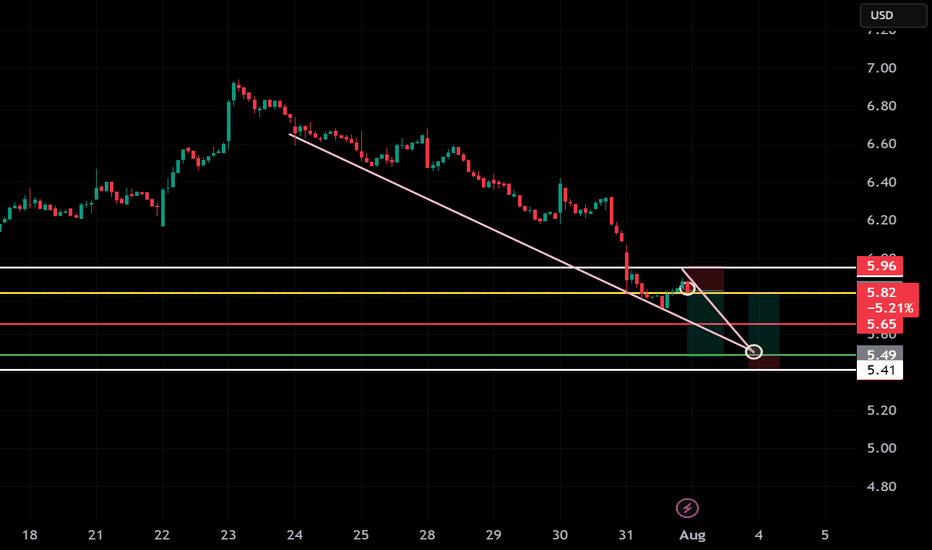
Premium📉 Trade Setup (30m Chart): STKL is in a strong downtrend, showing rejection at the falling trendline and horizontal resistance. Price is respecting structure — clean short setup. 🎯 Short Plan: → Entry: $5.82 → Stop Loss: $5.96 → Target: $5.41 📌 Breakdown continuation + trendline resistance = short with solid R:R. @tcarpenter1227
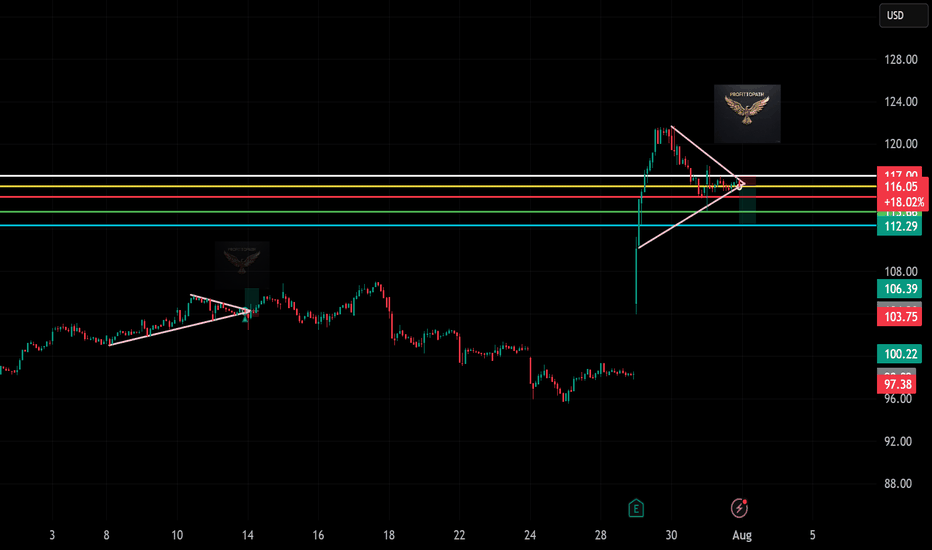
“” 📈 Trade Snapshot (30m Chart): SANM had a strong breakout and is now consolidating in a tight bull flag/triangle. Watching for a clean break above $117.00 to continue momentum. 🎯 Long Setup: → Entry: $116.05 → Stop Loss: ~$113.68 → Target: $117.90+
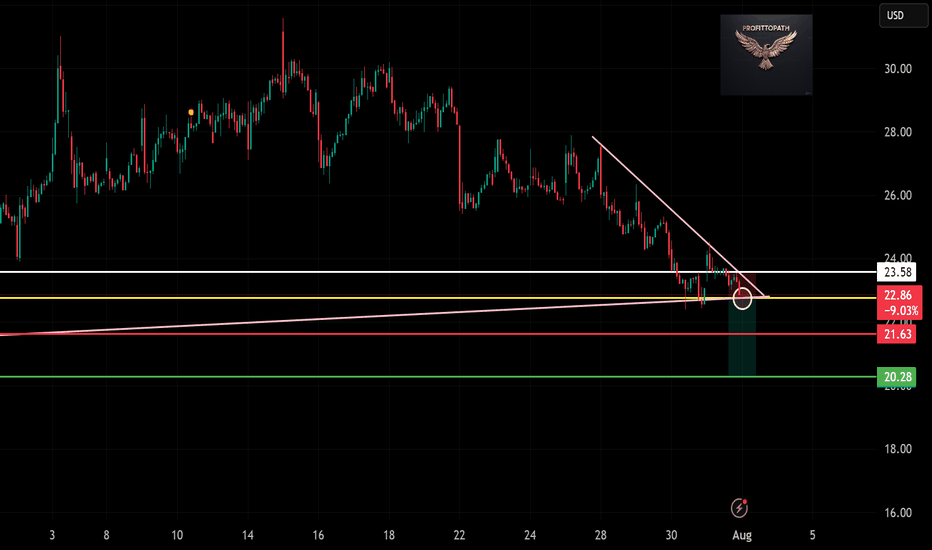
🎯 Short Setup: → Entry: $22.86 → Stop Loss: $23.58 → Target: $20.28 📌 Bear flag breakdown + clean R:R = short opportunity in progress.
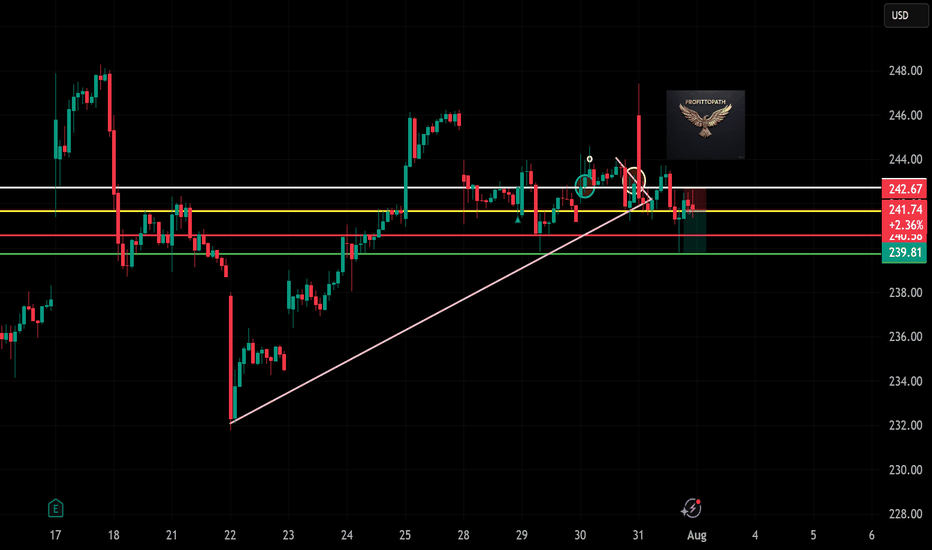
“” 🎯 Setup: → Entry: ~$241.74 → SL: ~$243.00 → Target: $239.81 📌 Bearish rejection + trendline break = short opportunity.
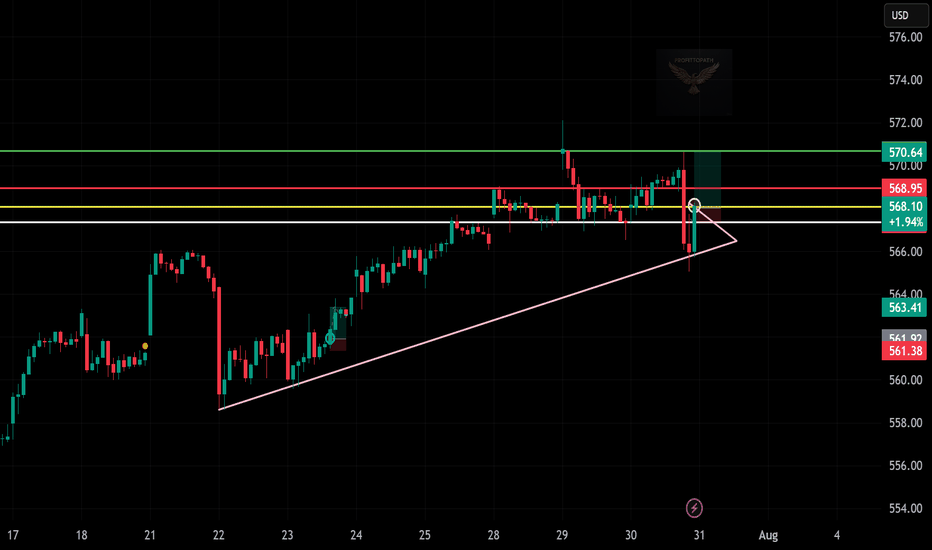
📈 Trade Snapshot: Despite a fakeout drop, QQQ holds the trendline. A break above $568.95 targets $570.64 short-term. 🎯 Setup Details: → Entry: $568.10 → SL: ~$563.41 → Target: $570.64 📌 Strong upward structure, with buyers defending key support. 📋 Hashtags: #QQQ #BreakoutTrade #TrendlineSupport #ProfittoPath #ChartSetup #SwingTrade #PriceAction #SmartTrading
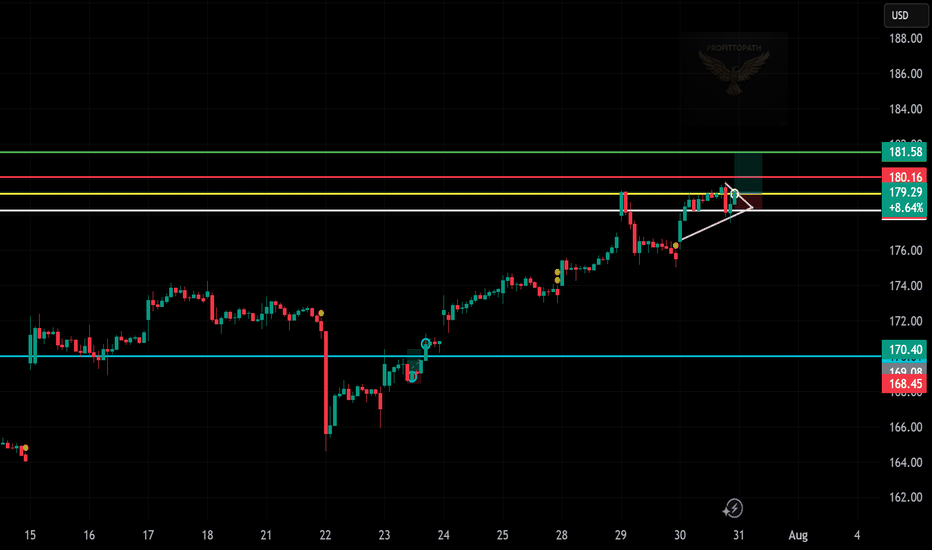
📈 Trade Snapshot: NVDA is forming a mini triangle with higher lows. Breakout above $180.16 could push it toward $181.58. 🎯 Setup: → Entry: $179.29 → SL: ~$176.00 → Target: $181.58 📌 Tight structure + bullish momentum = strong breakout chance. 📋 Hashtags: #NVDA #BreakoutSetup #PriceAction #ProfittoPath #SwingTrade #SmartMoney #TechnicalAnalysis #ChartSetup
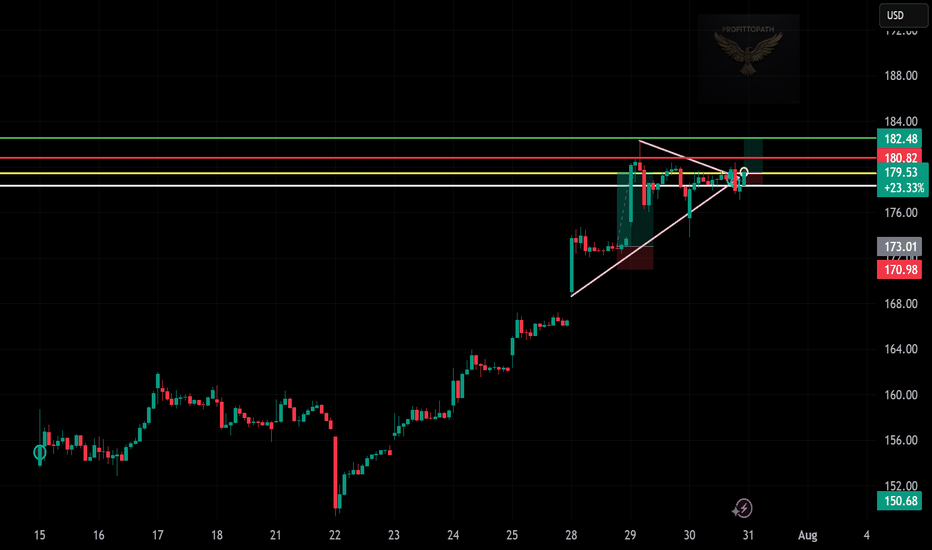
📈 Trade Snapshot: AMD breaks a tight triangle range with momentum. A clean move above $180.82 puts $182.48 in sight. 🎯 Plan: → Entry: $179.53 → SL: ~$173.00 → Target: $182.48 📌 Clear structure, low-risk entry, breakout confirmed. Let it run. 📋 Hashtags: #AMD #BreakoutTrade #ChartSetup #TechnicalAnalysis #ProfittoPath #SwingTrade #PriceAction #SmartMoney
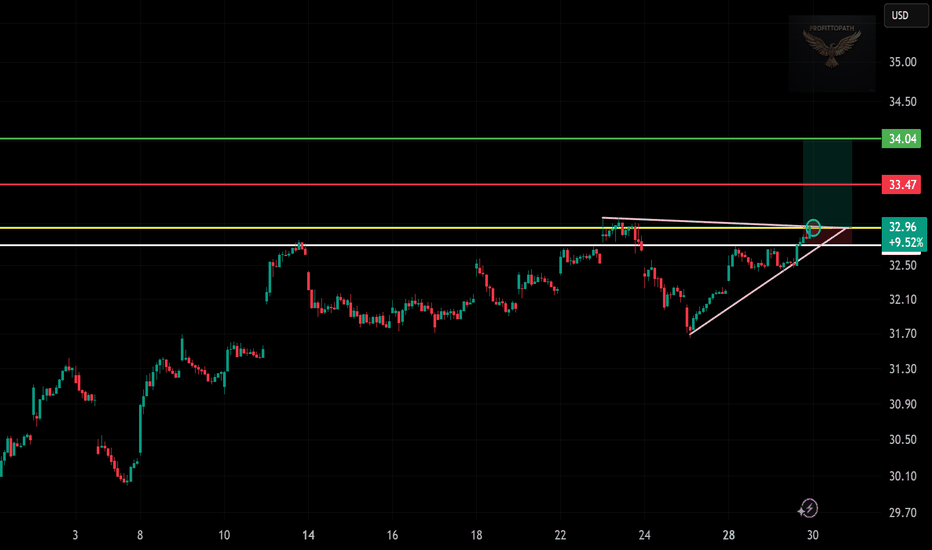
– Triangle Sends a Signal” 📈 Trade Snapshot: BP breaks above resistance with rising volume, forming higher lows on a clean ascending triangle. Breakout above $32.96 opens the door toward $34.04. 🎯 Setup Details: → Entry: $32.96 → SL: ~$32.30 → Target: $34.04 → Resistance to clear: $33.47 📌 Pattern strength + structure breakout = potential momentum run.
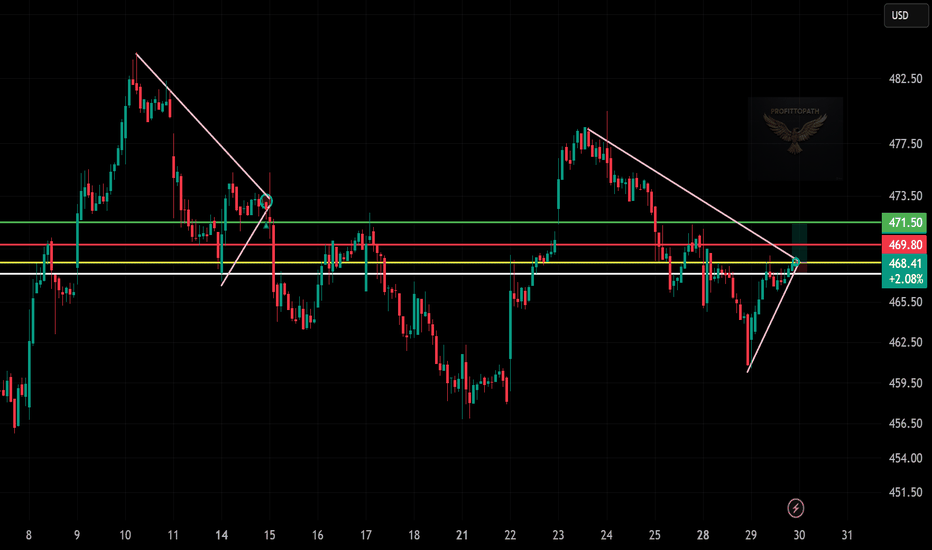
resistance after clean higher lows. A breakout above $469.80 could fuel a move toward $471.50. 🎯 Plan: → Entry: $468.41 → SL: Below $466 → Target: $471.50 ⚠️ Wait for confirmation above structure.
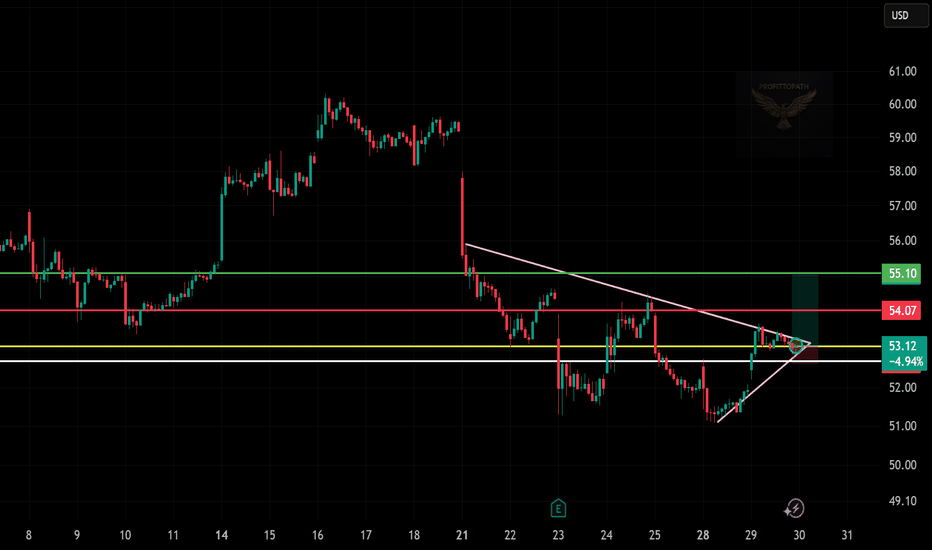
📈 Triangle pattern tightening. Entry: $53.10 | SL: ~$52.00 | Target: $55.10 Break above $54.07 = momentum shift. Let price confirm, then strike. 🧠🎯
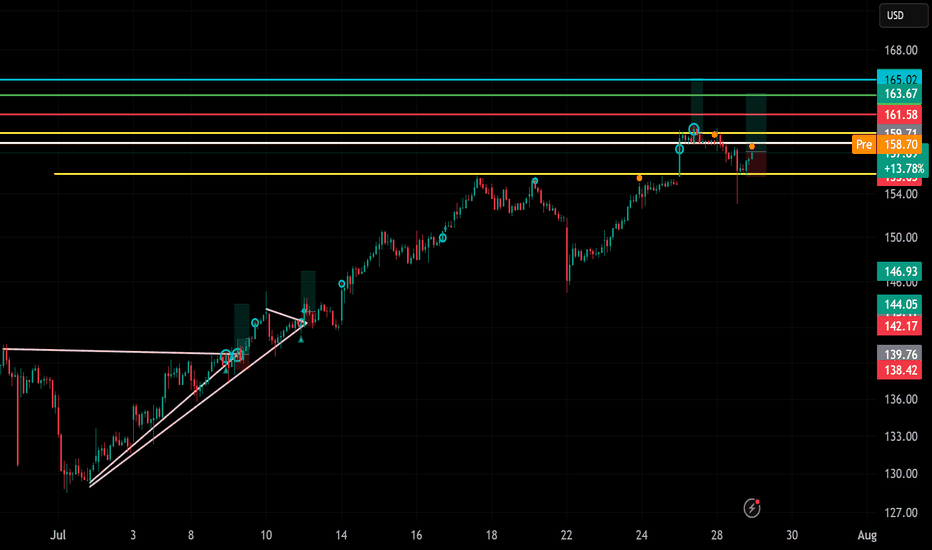
🟢 You’re expecting price to move upward, and your chart reflects a breakout setup with multiple resistance levels marked. 🔍 Key Technical Elements Noted: Ascending triangle breakout: The pink trendlines show an ascending triangle (bullish pattern) that successfully broke out. Support Zone: Around 158.00 – 158.62 (highlighted by the yellow lines), showing a...
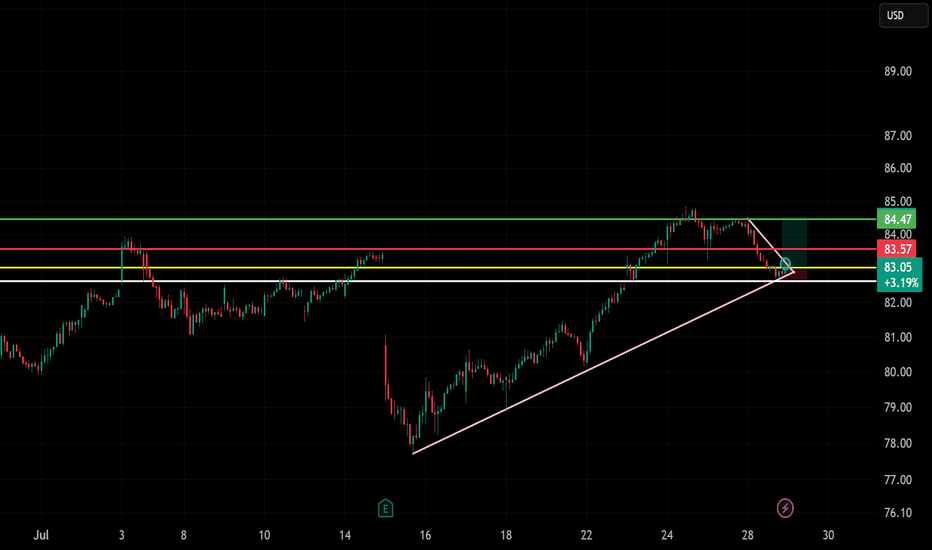
📈 🕰️ Timeframe: 30-minute chart 🔍 Pattern: Bull flag / descending channel breakout 📉 Previous Trend: Uptrend with healthy retracement 🧭 Setup: Breakout from short-term correction, aligning with trendline support 🧩 Technical Breakdown: Support Zones: $83.00 (holding on ascending trendline) $82.50–82.75 (horizontal support near recent consolidation) Entry...
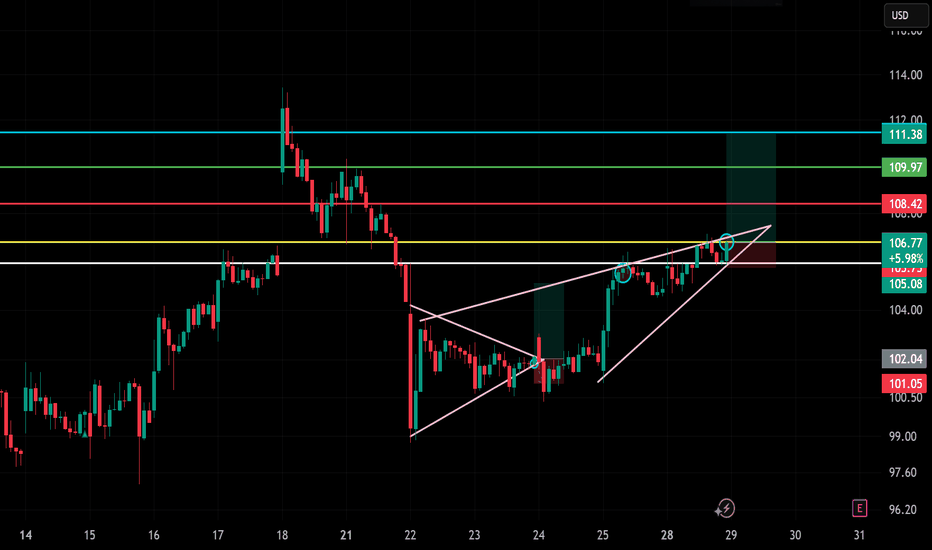
📈 🕰️ Timeframe: 30-minute chart 🔍 Pattern: Ascending wedge breakout 📉 Previous Trend: Bullish continuation from bottom 🧭 Setup: Breakout retest and continuation toward resistance zone 🧩 Technical Breakdown: Breakout Zone: Wedge breakout confirmed around $106.00–106.50 Current price near $106.77, retesting breakout (bullish) Support Zone: $105.00–105.50...
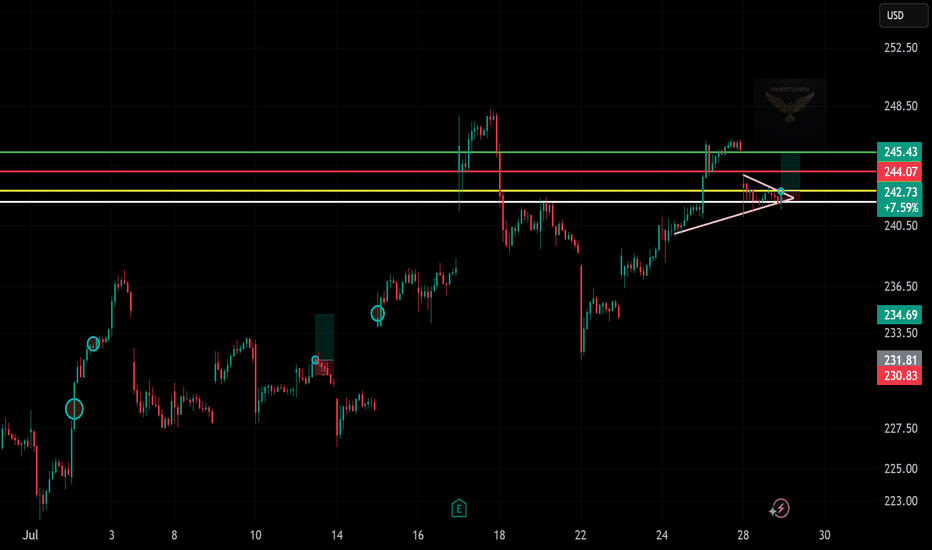
📈 (Taiwan Semiconductor) 🕰️ Timeframe: 30-minute chart 🔍 Pattern: Ascending triangle breakout 📉 Previous Trend: Recovery after drop 🔁 Setup: Bullish continuation with breakout confirmation 🧩 Technical Breakdown: Support Zone: ~$242.50 (yellow horizontal support) Uptrend line holding as dynamic support (pink diagonal) Entry Zone: Around $242.75, just above...
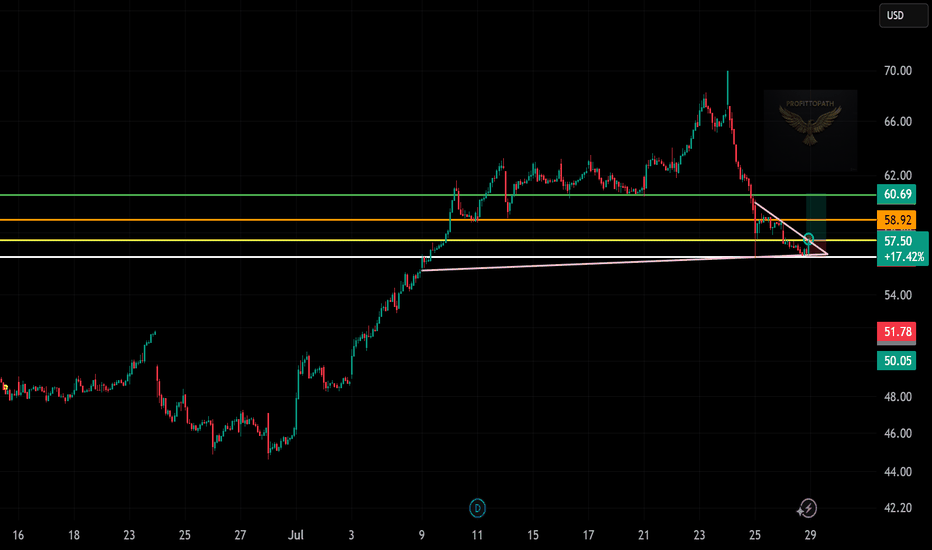
📊 🕰️ Timeframe: 30-minute chart 🔍 Pattern: Falling wedge breakout 📉 Previous Trend: Sharp sell-off 🔁 Setup: Reversal from demand zone with breakout confirmation 🧩 Technical Breakdown: Support Zone: Around $57.00 (highlighted with pink & white lines) Retesting prior breakout + holding demand zone Resistance / Target Zones: TP1: $58.92 (orange line – minor...
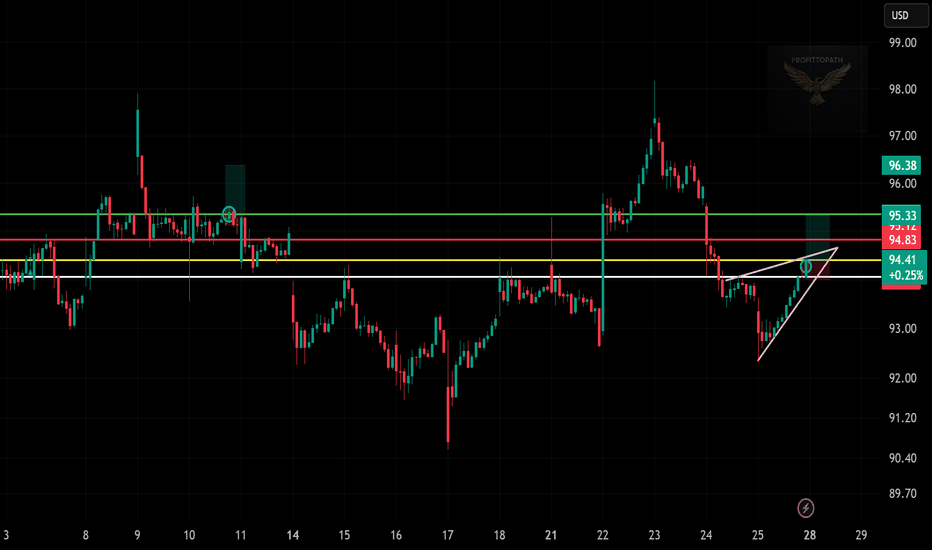
📈 Entry: $94.41 (Breakout above mini wedge) Stop Loss: $93.75 (Below trendline support) Target: $96.38 (Key resistance zone) Pattern: Rising Wedge breakout with bullish momentum Risk-Reward Ratio: ~2.6R Caution Zone: $94.83–$95.33 (multiple rejections in past)
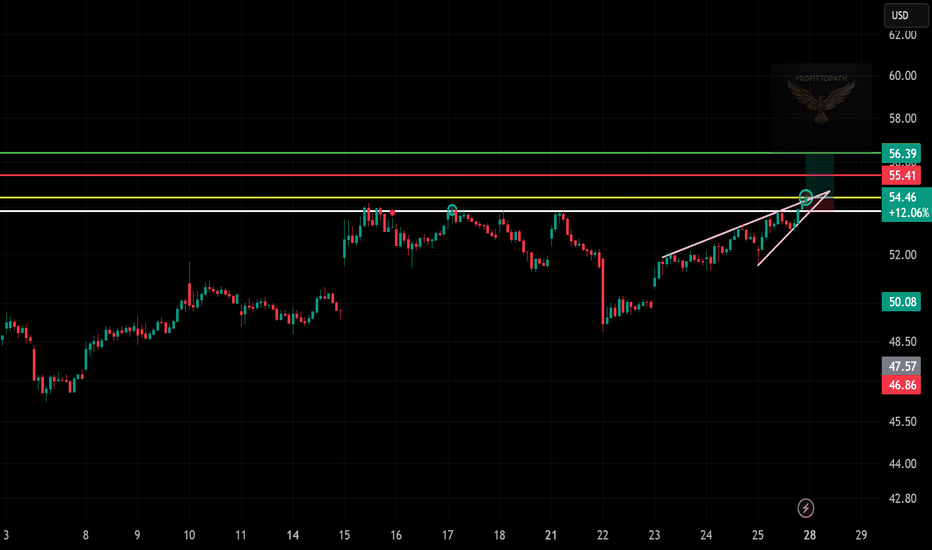
📈 Entry: $54.46 Stop Loss: $53.97 Target: $56.39 Pattern: Rising Wedge Breakout Risk-Reward: ~2R Key Zone: $55.41 (resistance/rejection level to watch)
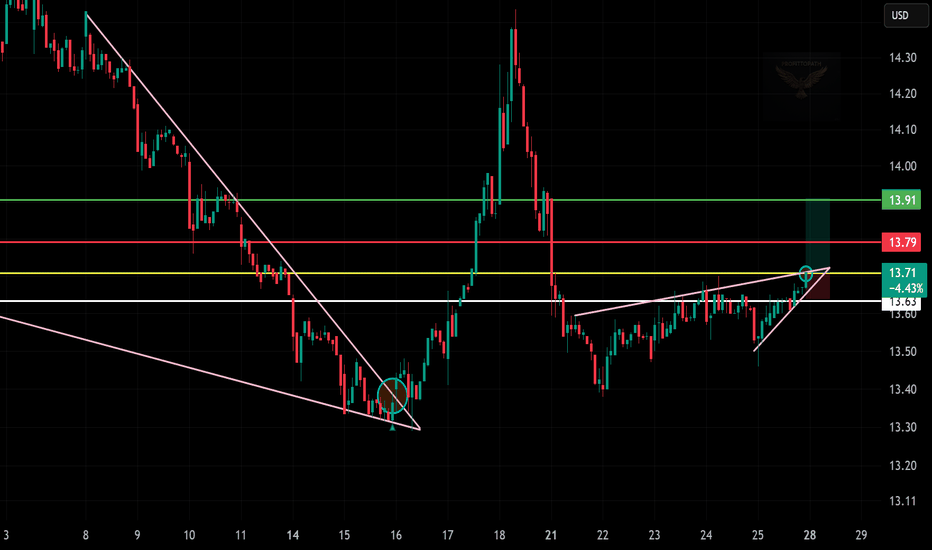
📈 Entry: $13.71 Stop Loss: $13.59 Target: $13.91 Pattern: Ascending Triangle Breakout Risk-Reward: ~1.7R Key Level to Watch: $13.78 (possible resistance)
