RAR-BSJ
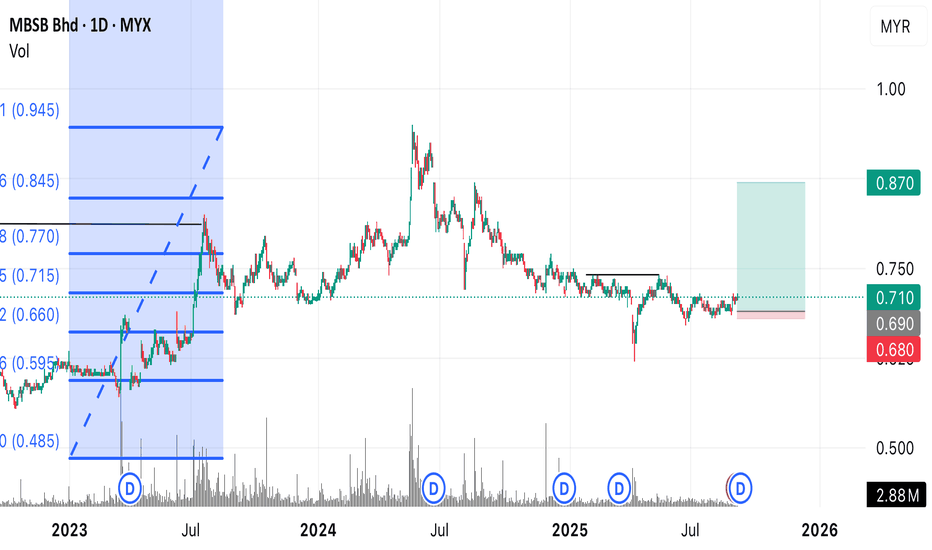
External structure chart - downtrend FIBO still within 50% and below Possible entry between RM0.69 - RM0.70 Stop loss : RM0.67 and below for low risk #TAYOR
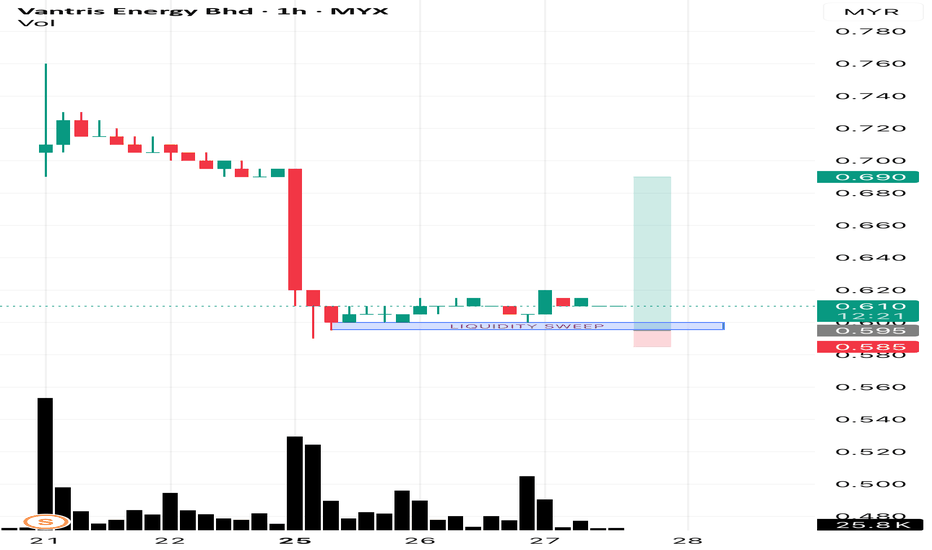
Chart based on 1HR TF more realistic and clear to be analyzed. Possible entry at liquidity sweep zone (in blue box) provided that the volume at the zone is thin. #TAYOR
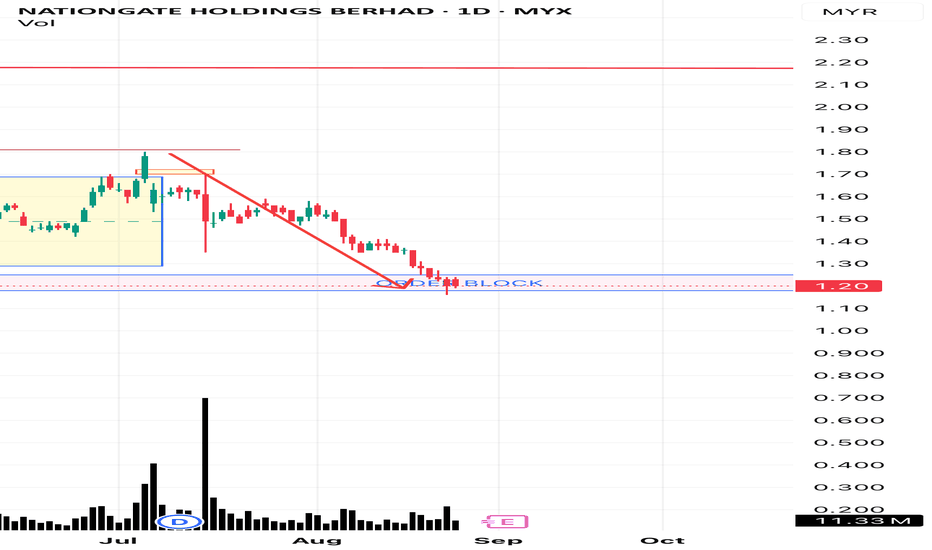
My post dated 4/7/2025 is refers. Currently the price has moved inside the order block zone.
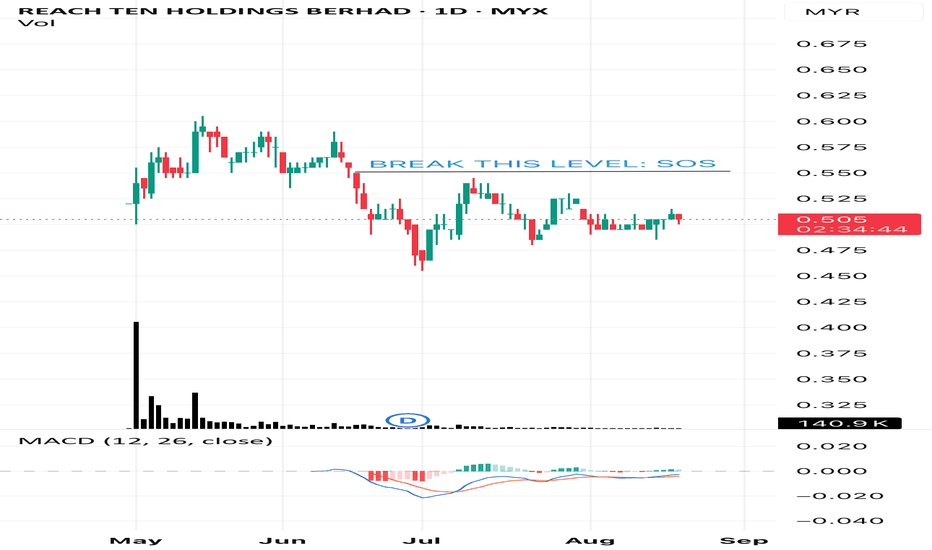
Chart is in accumulation phase. Break above RM0.55 with high volume: Sign of strength (SOS) If price fails to break, the chart is still in sideway mode. #TAYOR
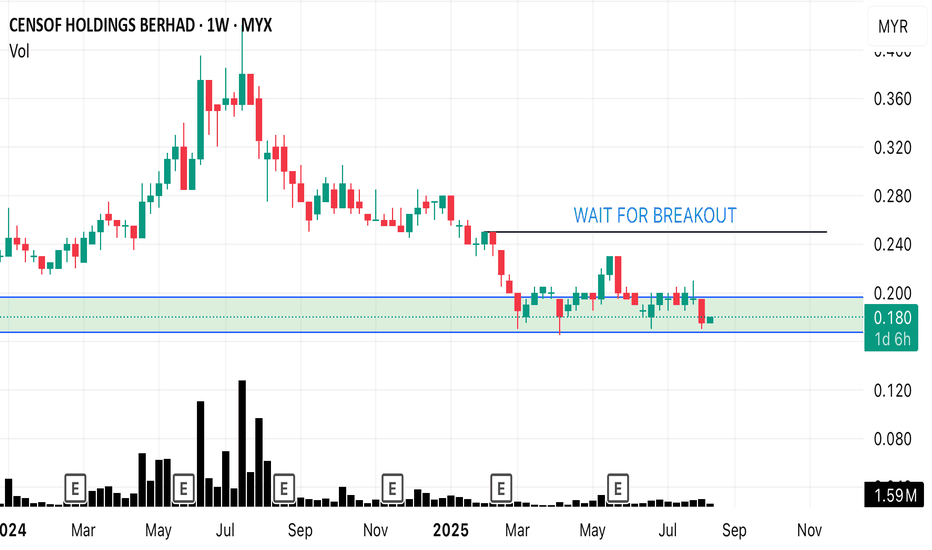
Current trend - reaccumulation If the price succesfully breaks above RM0.25 with high volume, the uptrend will continue. If the price break below the order block zone, sign of weakness where we can put out this stock from watchlist
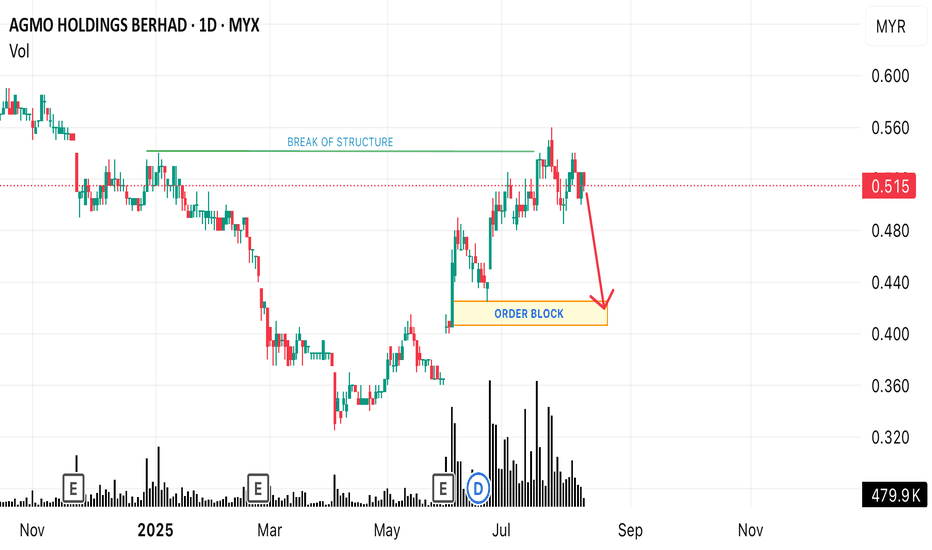
Currently price is in downtrend (in process of distribution) after BOS ( break of structure). Now its going to visit order block zone. So wait patiently till price comes to you. #tayor
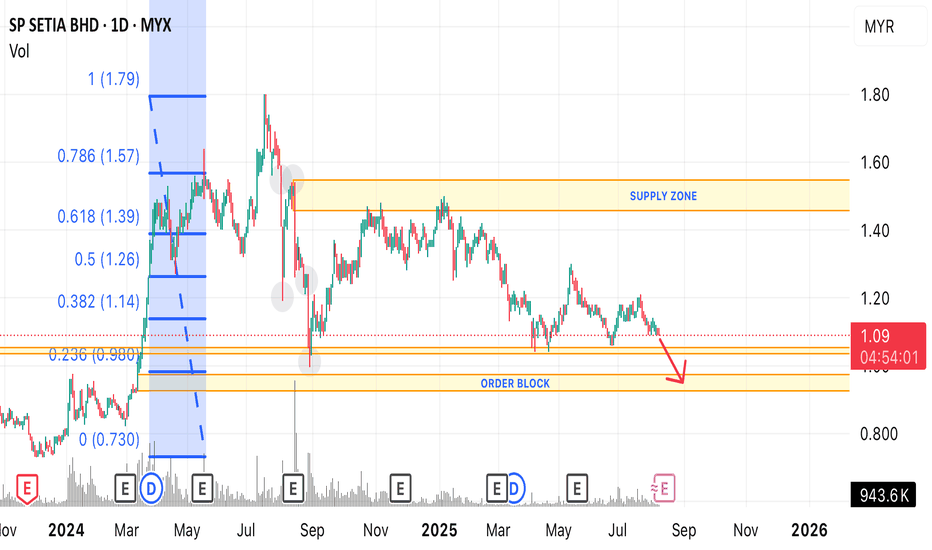
Refers to my post on 1/7/2025. Looks like price failed to reach previous HH. I think the price will move down toward Order Block zone #tayor
Chart: Uptrend on weekly timeframe Price is in the phase of accumulation SL: within swap zone area #trade at your own risk
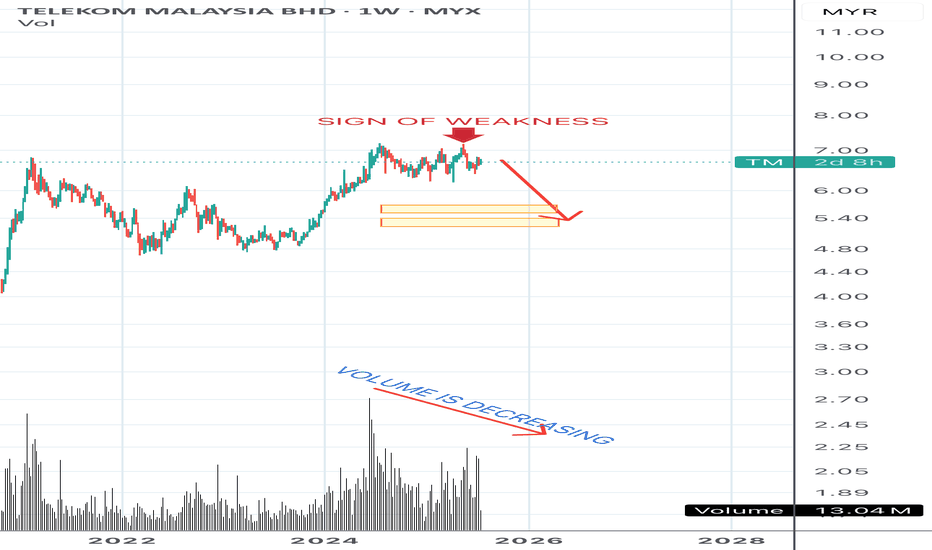
Chart: Uptrend on weekly timeframe Price is in the phase of distribution. Possible to retrace down towards 5.60 & 5.25 zone. Volume -decreasing #trade at your own risk
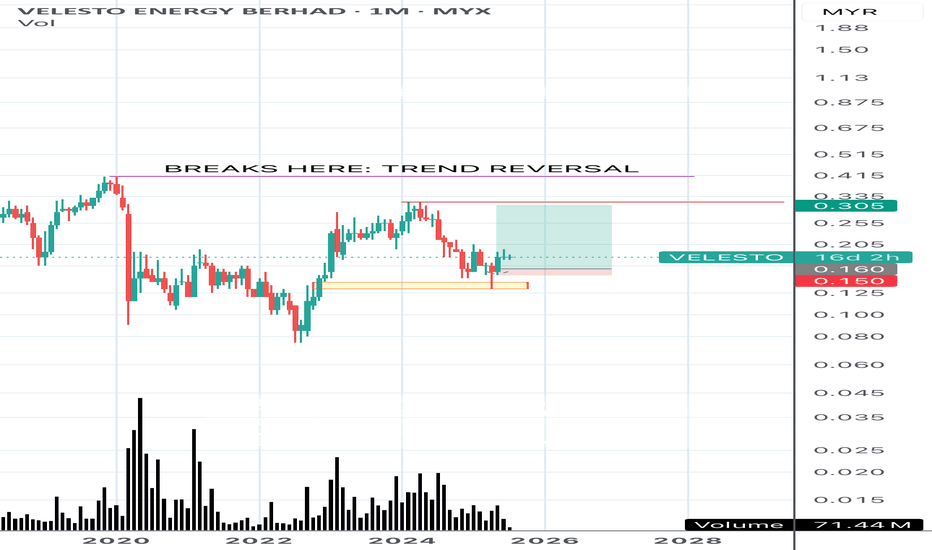
Chart : downtrend on monthly basis Using monthly chart to look for direction. Price move slow and steady. If break 0.415, the trend reversal is on the way. #trade at your own risk
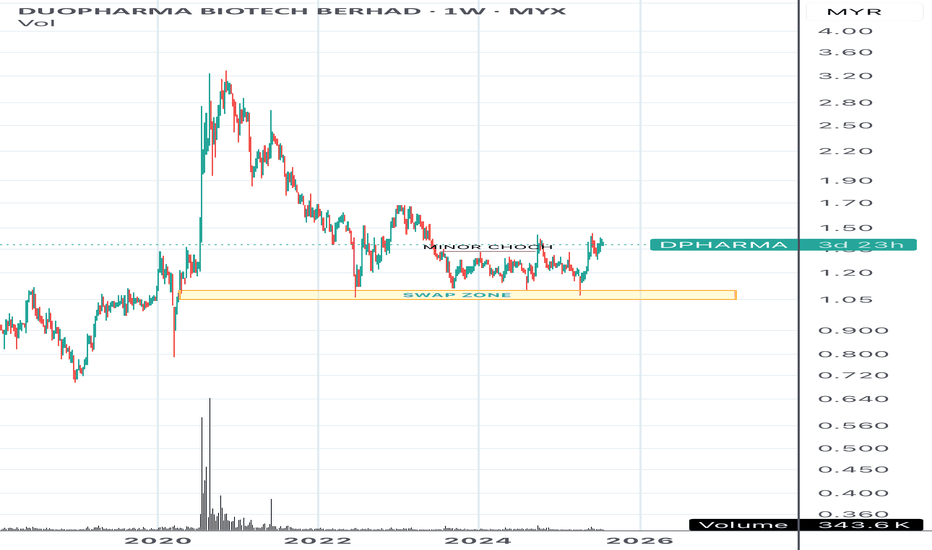
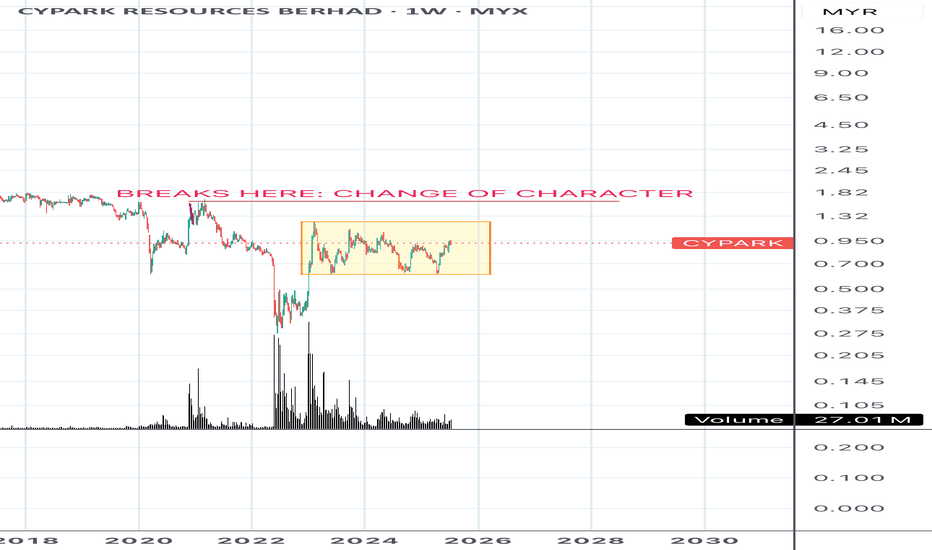
Chart : Sideway trend If breaks 1.63, it means change of character.
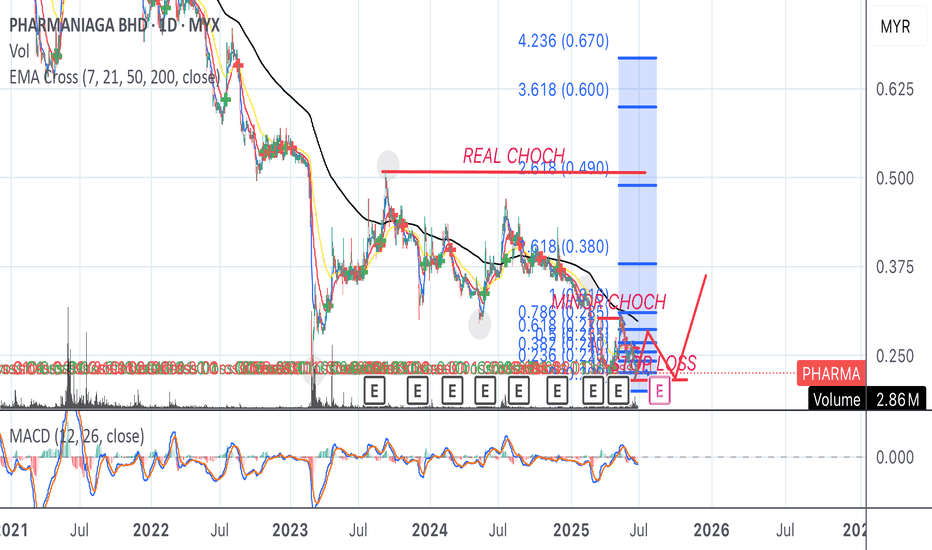
Chart - downtrend If the price breaks 0.33 with high volume, this counter can be put in watchlist. Entry: No entry yet. Just wait & see
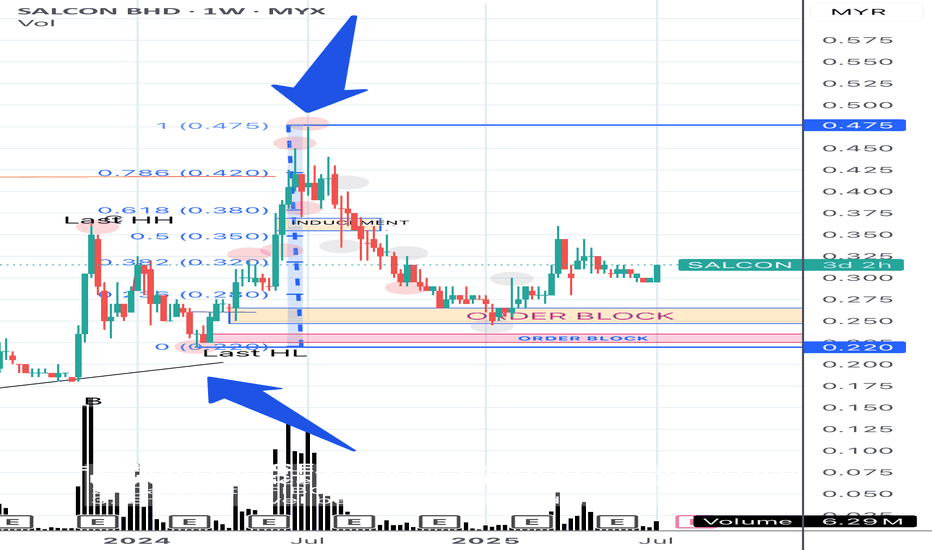
Chart - uptrend If the price breaks 0.475, uptrend may continue provided the breakout should followed with high volume as confirmation of trend continuation. Entry: Below 0.50 FIBO the price may visit unmitigated/order block. (pink colour) SL : Below 0.215 ( the previous HL)
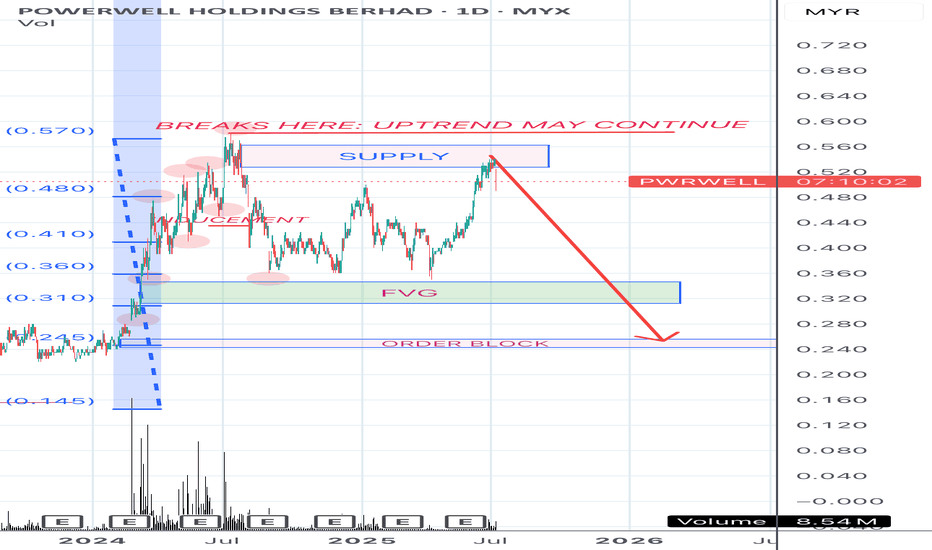
Chart - sign of manipulation If the price breaks 0.580, uptrend may continue provided the breakout should followed with high volume as confirmation of trend continuation. As for now, just wait and see whether the chart is making distribution pattern or not. If yes, the price may visit unmitigated/order block. Let’s see and good luck! #trade at your own risk
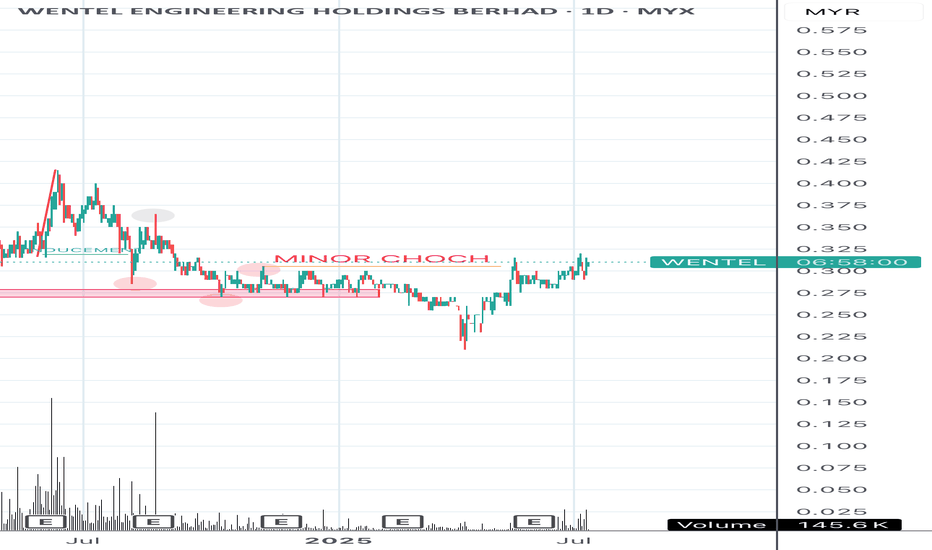
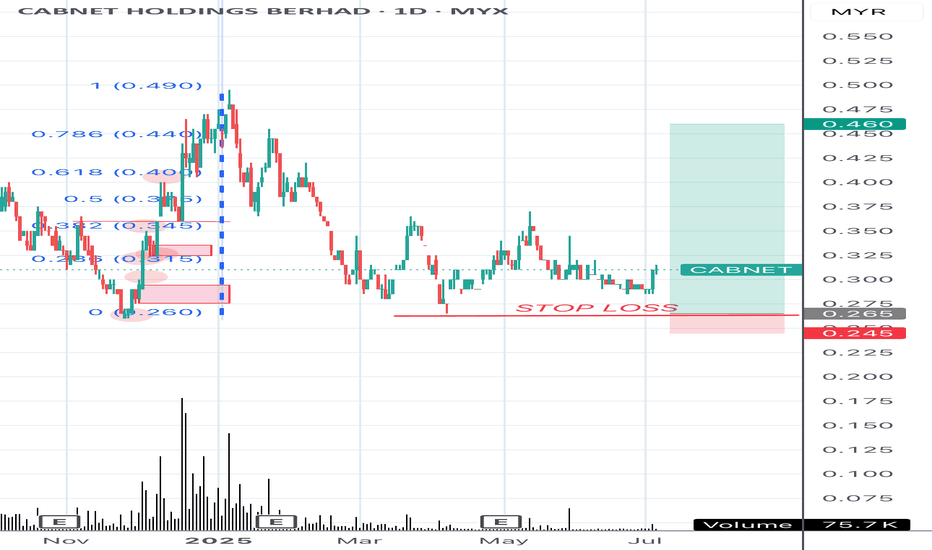
Chart - downtrend. Price currently hover at support level 0.260 - 0.310 Bullish engulfing appeared recently. Entry: 0.260 - 0.315 SL : 0.255 (just below 0.260) TP : 0.45
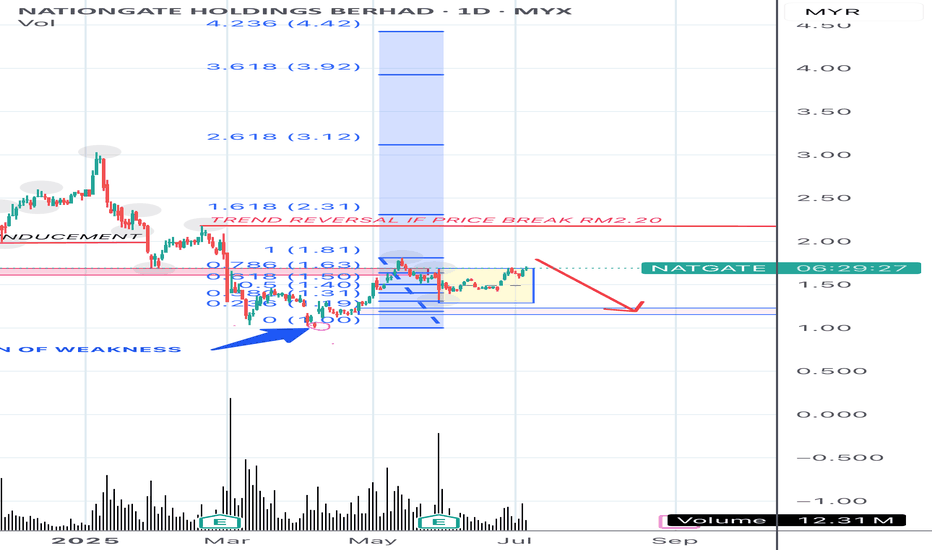
Chart shows downtrend. At the moment, just wait & see. If price break RM2.20 with high volume, trend reversal is on the way.
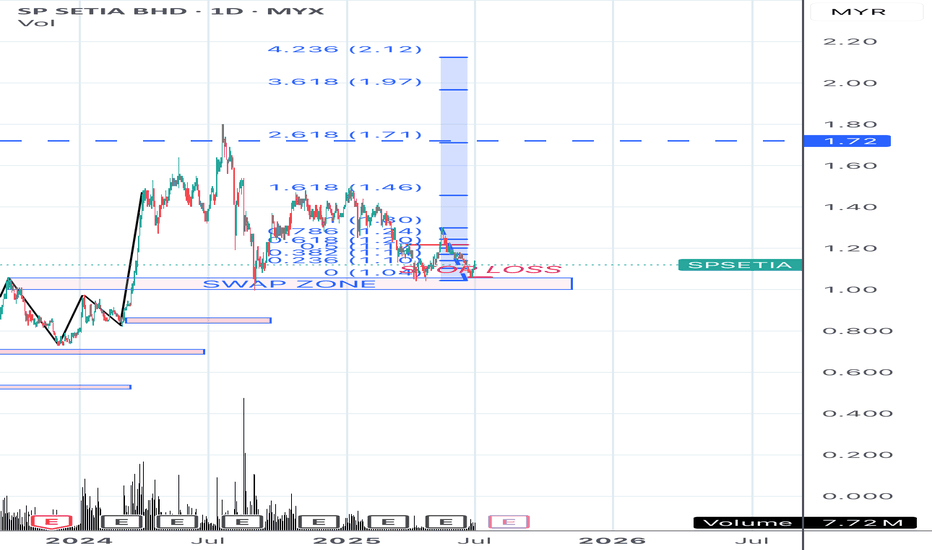
Entry at 0.618 FIBO or below SL : RM1.04 or within swap zone area TP 1 & TP 2 : FIBO 1.618 & 2.618 respectively
The company takes time to recover. Hope turns well
