RSI_Trading_Concepts
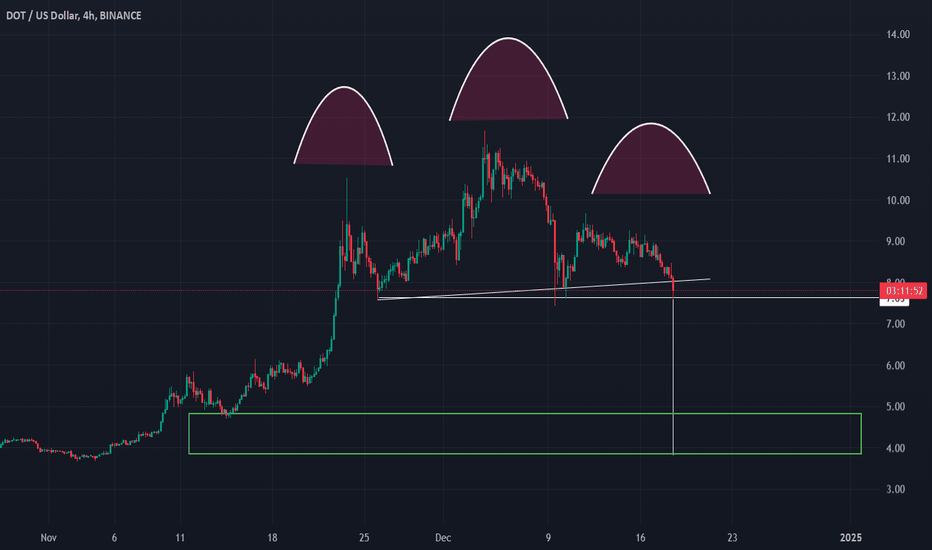
EssentialPolkadot (DOT) might be experiencing a significant trend reversal on the 4-hour timeframe, as a classic Head and Shoulders pattern appears to be nearing confirmation. This pattern suggests that after a bullish trend, DOT could shift into a bearish trend, providing a strategic sell opportunity for traders.
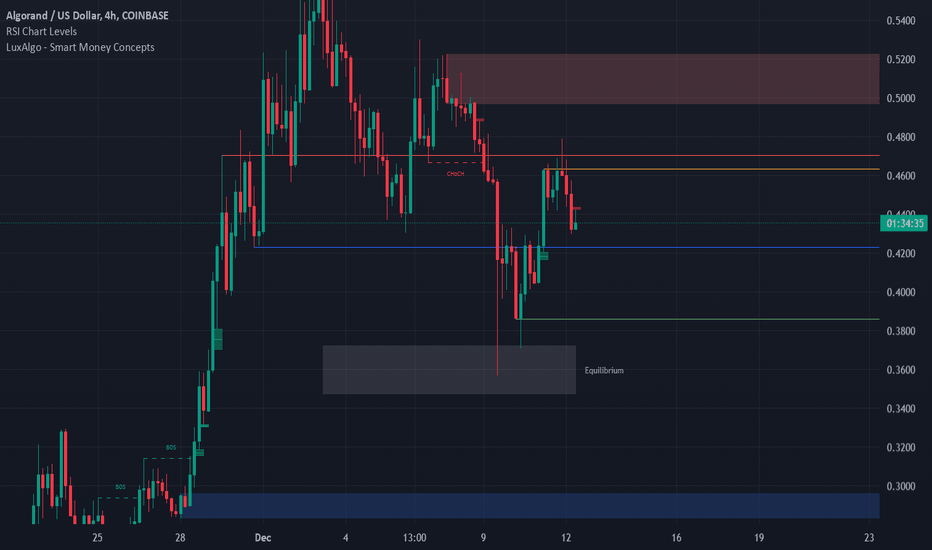
Algorand (ALGO) Weekly Analysis Algorand closed this week below the previous week's low, which to me signals a potential revisit to last week's lows. Here's the breakdown: Weekly Close: Below last week's low, suggesting bearish momentum. Price Action: ALGO has failed to maintain above the support level it briefly tested, indicating that sellers might still...
Title: Algorand (ALGO/USD) 4-Hour Chart: Price Action Analysis and Key Structural Shifts Post: A thorough analysis of Algorand's 4-hour chart reveals a significant transformation in market sentiment, marked by key structural changes at pivotal price levels. Here's an in-depth exploration of the price action structure theory about this chart: Trend...
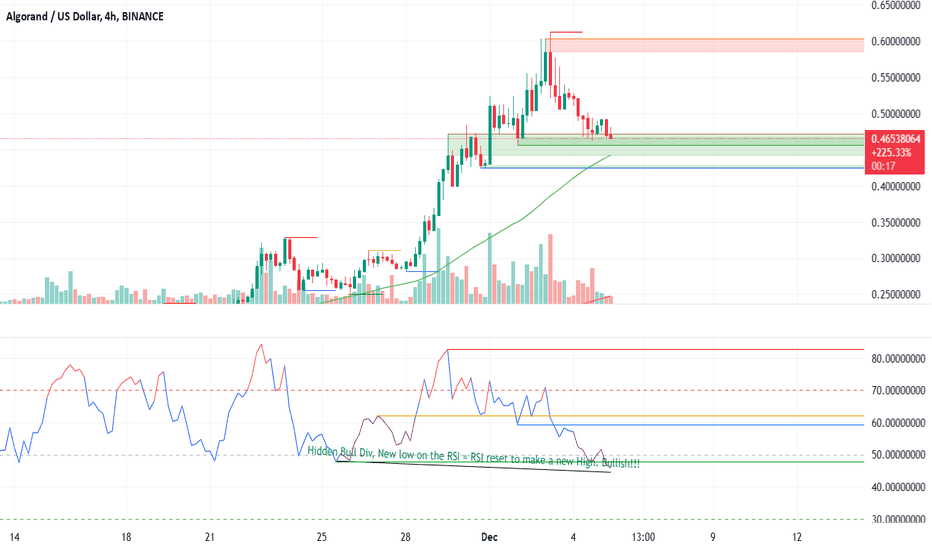
Hidden Bull Div, New low on the 4hr RSI = RSI reset to make a new High. Bullish!!!
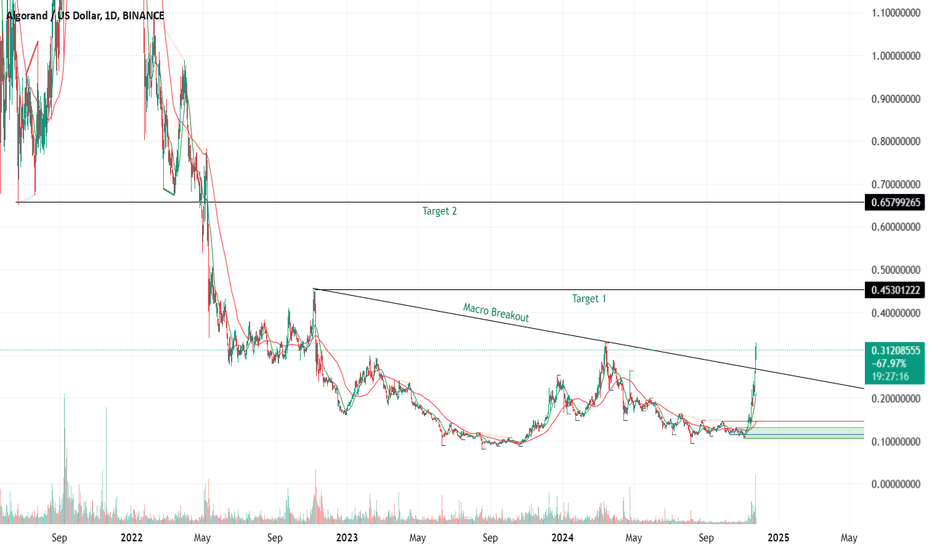
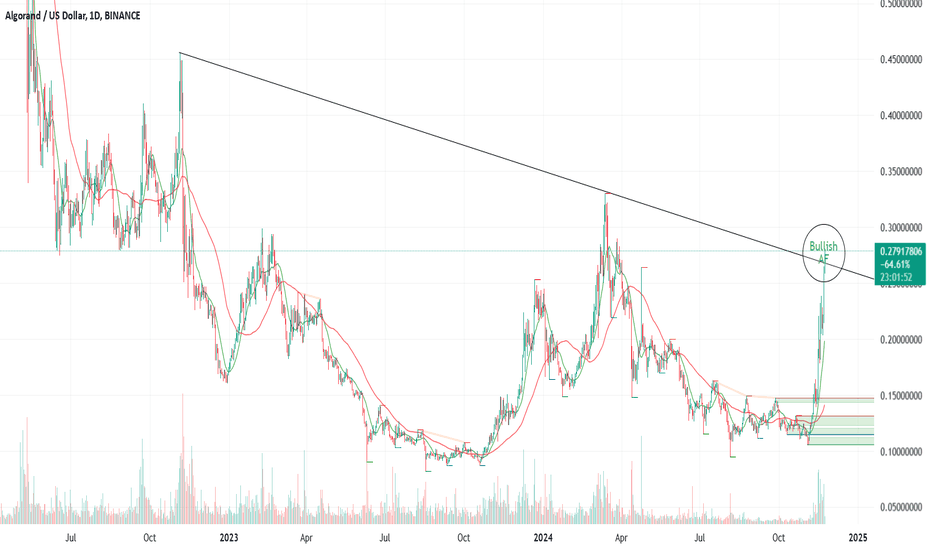
Macro Breakout, with long time frames taking over. I'm pretty bullish, and Algrand's tech is some of the best out there! If we get a week closing .33, that's confirmation on the upside.
Buying EURONEXT:ALGO has peaked through Macro resistance for the first time in a long time, and it is an awesome blockchain!
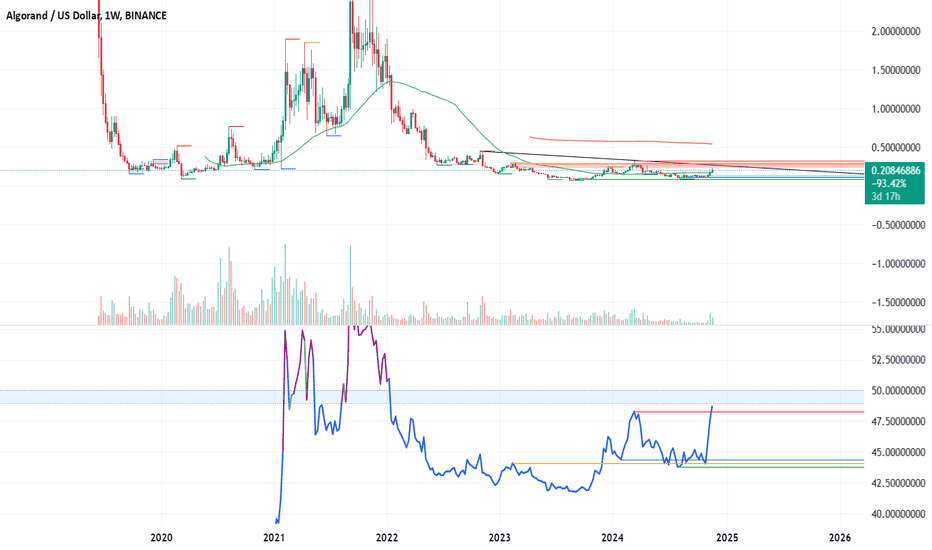
I'll be watching Algorand over the next few weeks on the weekly chart. A weekly close above .30 would signal a .65 target. Go Algorand!
Support/Resistance Quarter liquidity zones using RSI High/Low scheme. BTC is getting rejected from the 50 RSI level the period is set on 50 on this chart type. probably going back to 48K possible 42K region. Moving average is 91 and 365 SMA moving averages, and the R/S are set to 91 periods.
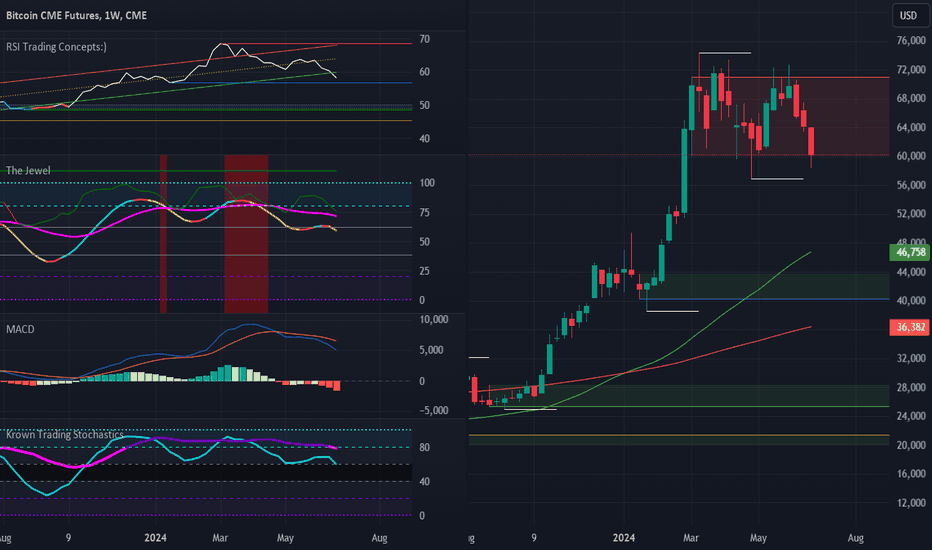
Weekly BTC Close not a good week for BTC closed under the weeks low on a closed basis.
Gold Head & Shoulders forming Target set.
Looking at BTC RSI using a 50 RSI Length and has falling in Bear RSI Zone I believe it will keep rejecting at the 50 level. There is hidden divergence here on the Daily but until the RSI flips, I think we break gown here. Look for a Bear flag to develop here.
ADAUSD H&S Target but watch rising Macro trendline.
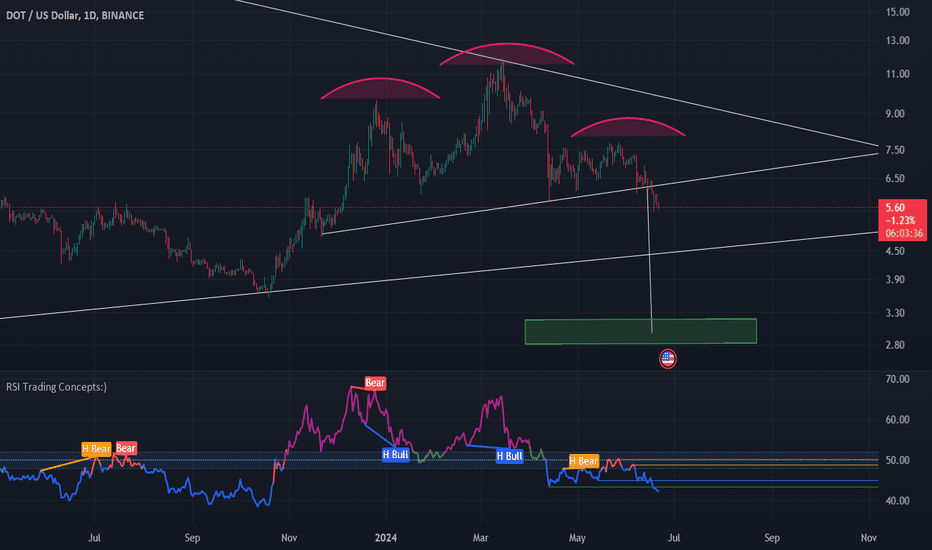
H&S Target for DOTUSD but watch bullish Macro rising trendline
Every time the MACD crosses down, price reverts back to the 200 SMA IN IT'S HISTORY. BTC Weekly MACD signal cross
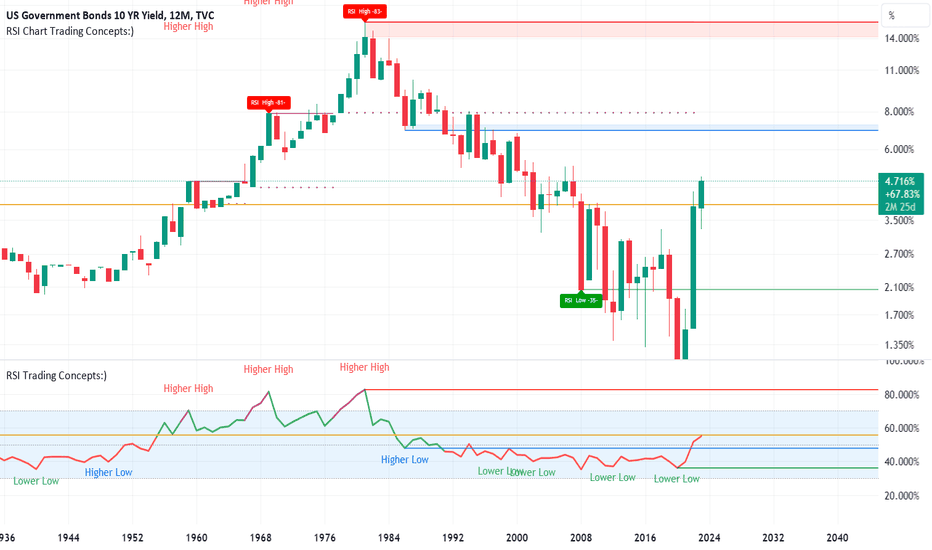
TVC:US10Y Ouch, 7 rates coming. 12-month chart and next level is 7% give or take, not good.
This is your risk low; ES has divergence I'm thinking it has time to breath and chop in here before breaking the camel's back. The heard is saying lower so I think it will chop in here this week then we'll see. If this low breaks lower we go.
Looking at the NQ Daily futures we're still holding the daily low, price might want to take a breath before going lower, upside target is the higher low 'blue line" 15352 area, then down to test the low and probably break the low. We did close a lower low on the week time frame but not a lower low, keep that in mind.
Bitcoin put is a new Lower Low on the RSI since its previous pushup to ATH recently. 11/18/18 was the previous Low of the RSI, new RSI low was set 8/18/23. RSI still hasn't had a new High of the RSI since 12/7/18, Price was 16600 closed bases, which has been a good support. Support at 20960, Resistance at 35091. These are Daily RSI Views.
