Romans8
Last seen
Followers
1Following
0Ideas
3Scripts
0Joined Jun 11, 2020
chartpattern
indicator
trendanalysis
Less Tags
Show All Tags
All Types
Type
All Types
Indicators
Strategies
Libraries
All Accesses
Script access
All Accesses
Open
Protected
Invite-only
Public & Private
Privacy
Public & Private
Public
Private
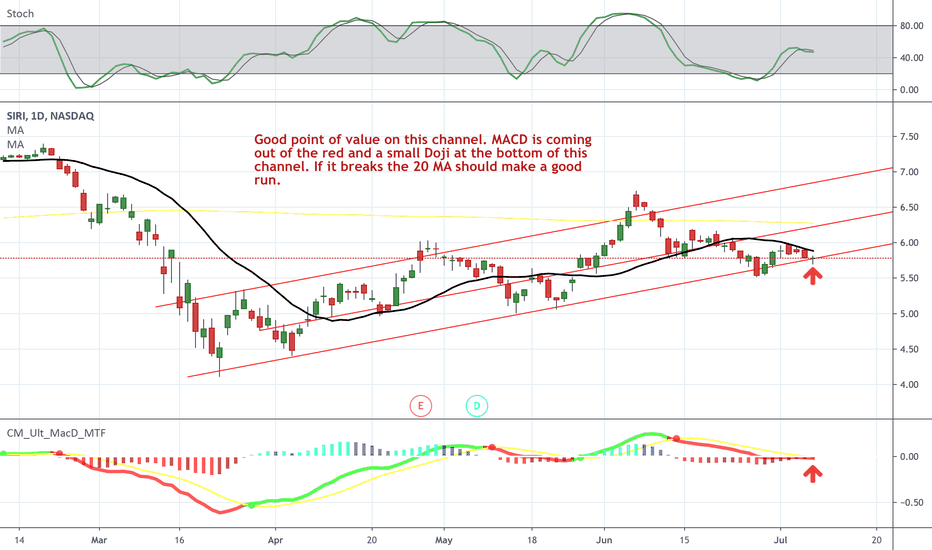
Looks like a good point of value here on SIRI. Its at the bottom of its current channel and MACD histogram has came back to 0 ready to go up! If it breaks the 20 MA on the daily chart should run 10% easy.
1
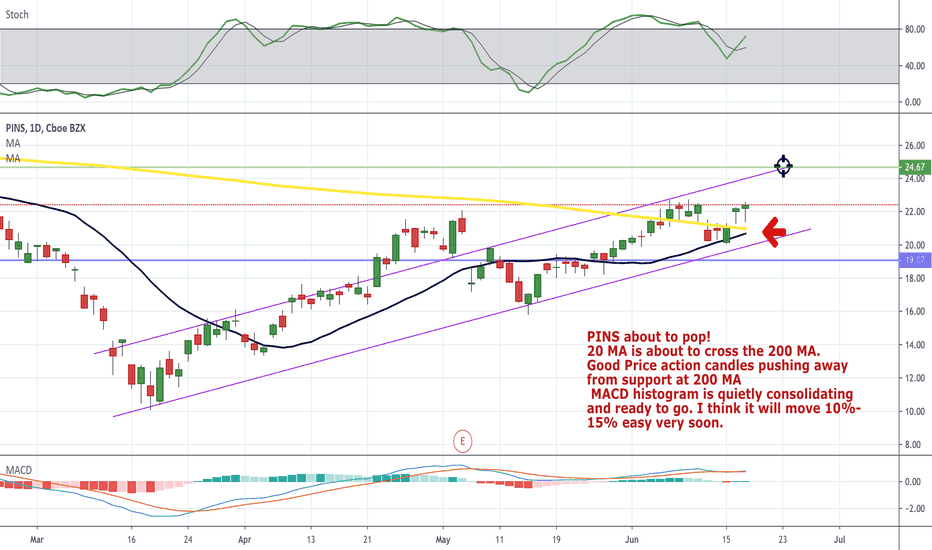
20 MA is about to cross the GOLDEN 200 MA. This could start a long uptrend for NYSE:PINS
9
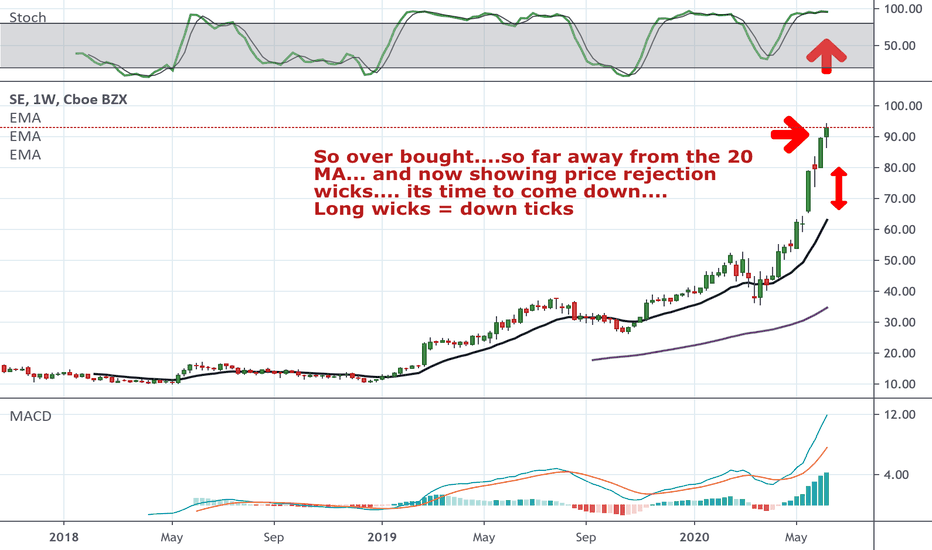
After a crazy run I think SE is topping out.On the weekly chart the RSI is way over bought and ready to come down. The price is so far from the 20 MA and we are starting to see price rejection wicks. Could be the top or could keep going we will see, but at some point soon I think it breaks down. NYSE:SE
7
User follows nobody
Type
Script access
Privacy


