SLPHOBIA
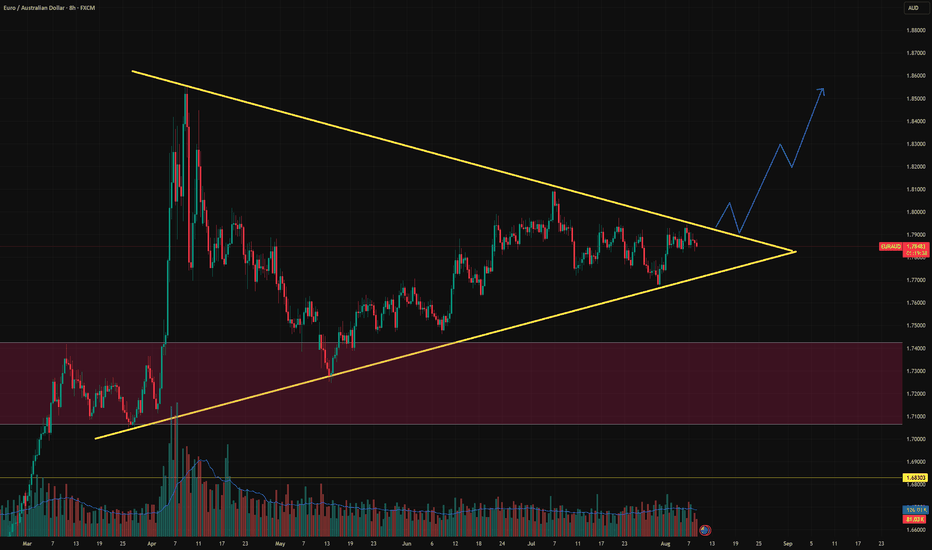
PremiumKey Observations: Pattern Type: Symmetrical triangle with converging trendlines. Higher lows show demand stepping in. Lower highs signal sellers defending resistance. Volume Profile: Volume is tapering off, aligning with triangle logic → explosive move likely upon breakout. Liquidity Pool Below: Large liquidity zone marked around 1.68300–1.74000, previously...
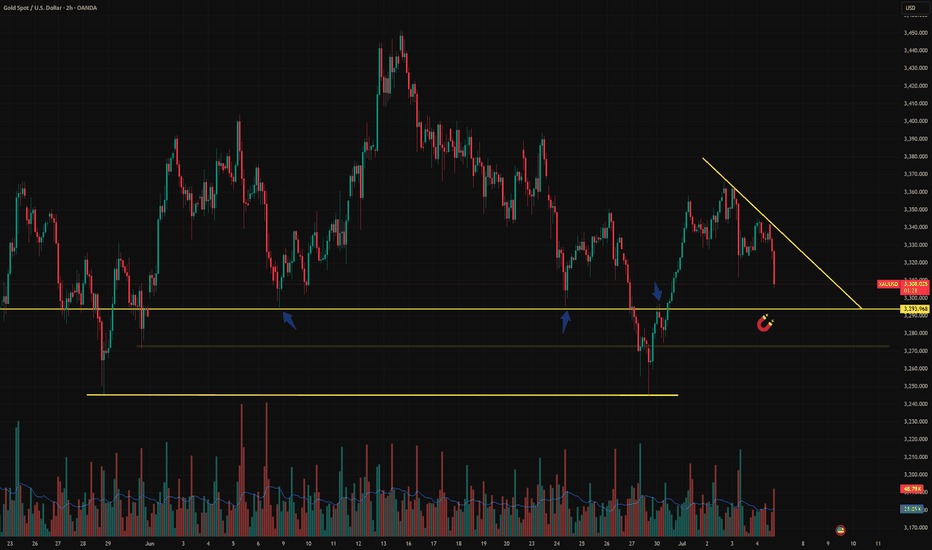
Overview Price is once again pressing into the 3,291–3,301 key demand zone, which has already been tested multiple times. This latest move is coming after a clean lower high rejection and a developing descending trendline, hinting at weakening demand and possible bearish breakout ahead. Key Technical Observations Timeframe: 2H Structure: Compression into demand...
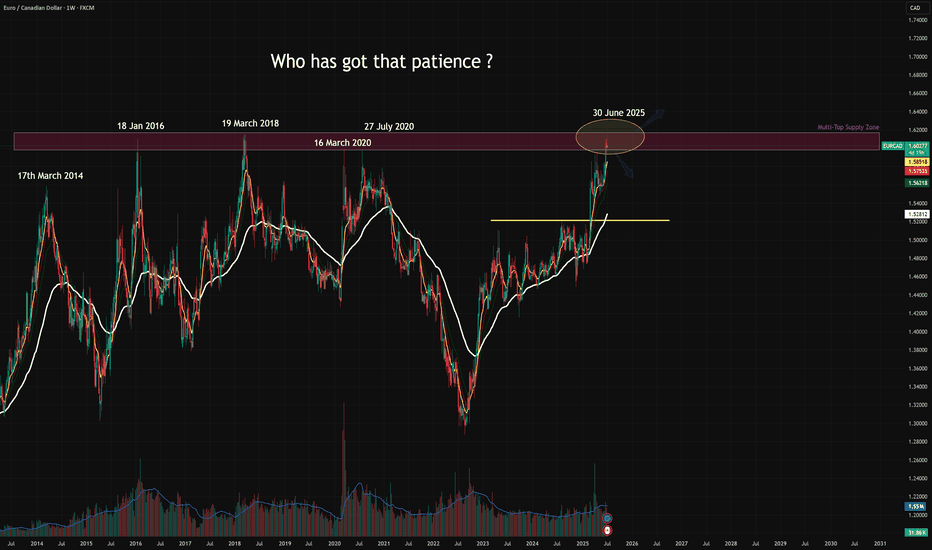
EURCAD is once again testing the legendary multi-year resistance between 1.60 and 1.6150, a zone that has caused at least 5 major rejections since 2014. Each of those led to significant drawdowns — yet this time, price is pressing deeper into it, potentially signaling a macro regime shift if bulls follow through. Key Technical Observations Timeframe: 1W ...
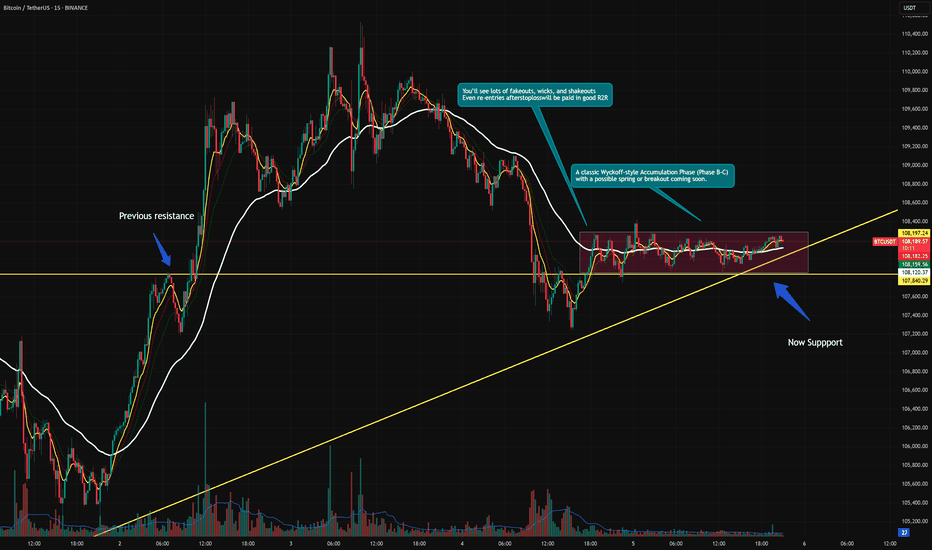
Bitcoin continues to compress inside a defined range, resting above both a rising trendline and a former resistance turned support zone. This structure fits cleanly within a Wyckoff-style Accumulation Phase (B-C). We’re now at a critical moment where smart money may be absorbing supply, preparing for the next phase. 🔍 Key Observations: Range-bound price action...
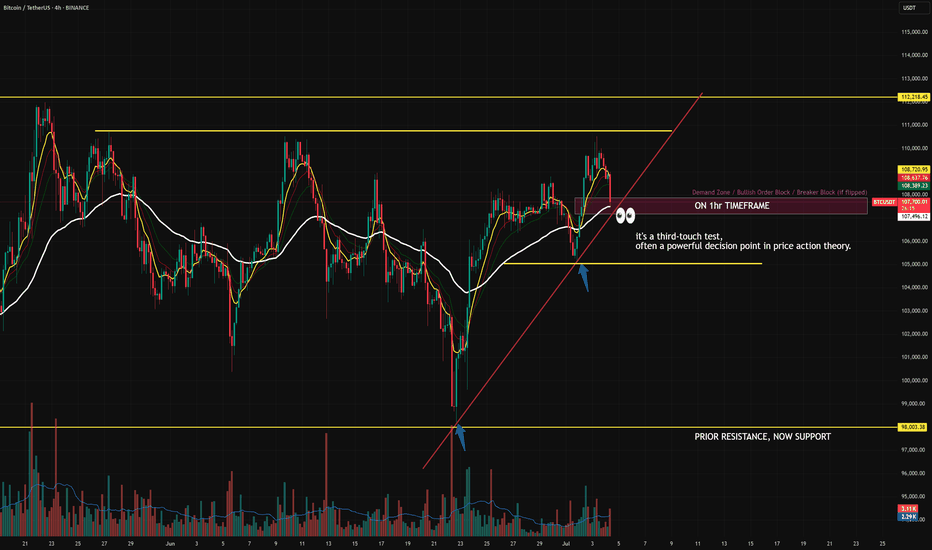
Bitcoin is currently retesting a confluence-rich zone — a textbook decision area where structure meets sentiment. 🔻 What’s in play? 🟥 Demand Zone / Bullish Order Block / Breaker Block (visible on 1H) 📈 Third-touch test of the ascending trendline – statistically known to trigger strong moves ⚪ Price sitting just above the 200 EMA acting as dynamic support 🧱...
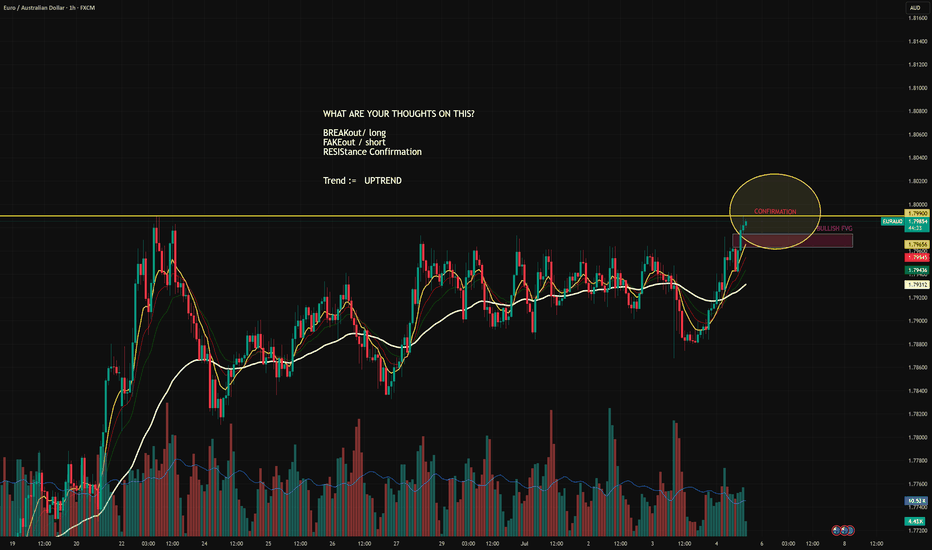
Breakout or Fakeout? Eyes on Confirmation Zone 👁️ EUR/AUD has finally tapped into a critical resistance at 1.79900, a level previously rejected with high volatility. The current price action is testing this ceiling, with signs of strength — but smart money waits for confirmation. What We’re Seeing: 🔹 Uptrend Intact: All EMAs are aligned in bullish order. 🔹...
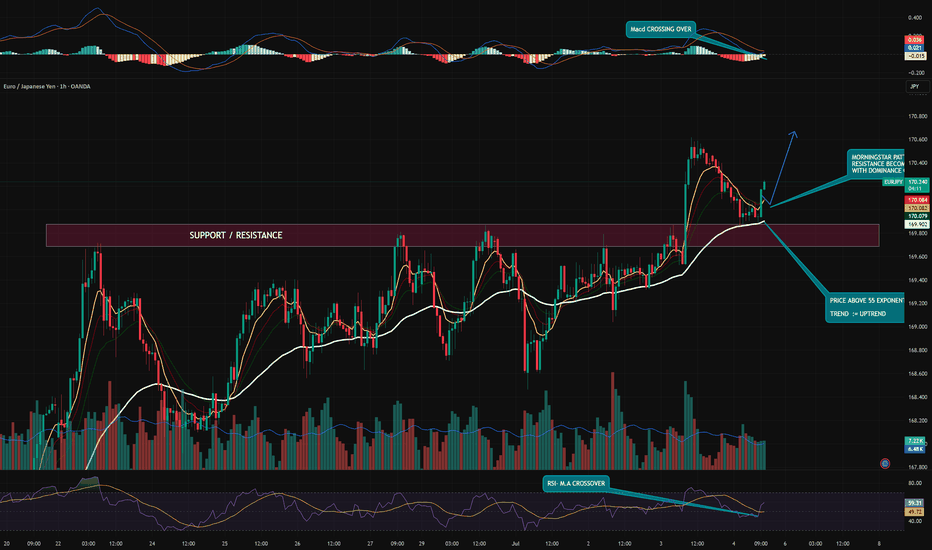
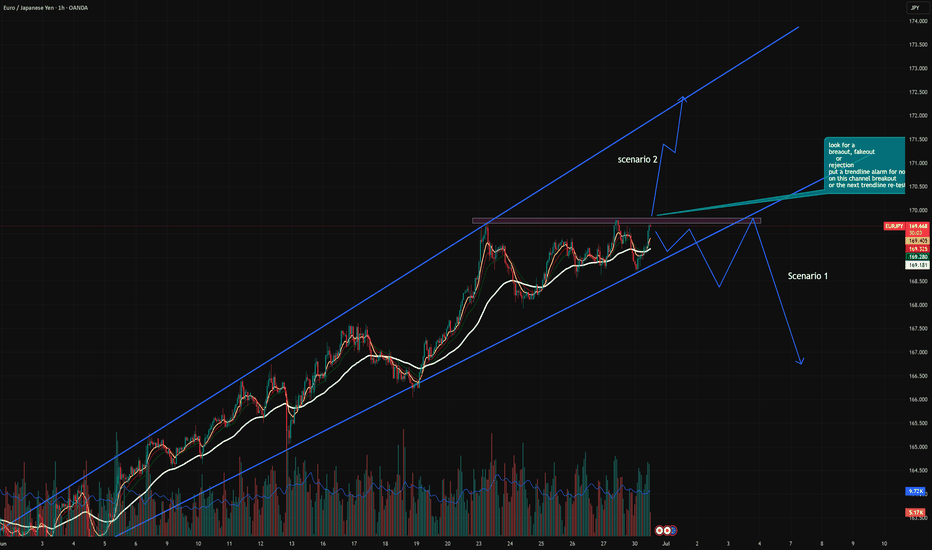
Technical Snapshot (1H Timeframe): ✅ Morning Star pattern at key support/resistance zone (169.90–170.00), indicating potential bullish reversal. 📈 Price holds above 55 EMA, confirming structure support and sustained uptrend. 💥 MACD Bullish Crossover signaling renewed upward momentum. 🔄 RSI crossover above its MA from the 50 level – a classic sign of buyer...
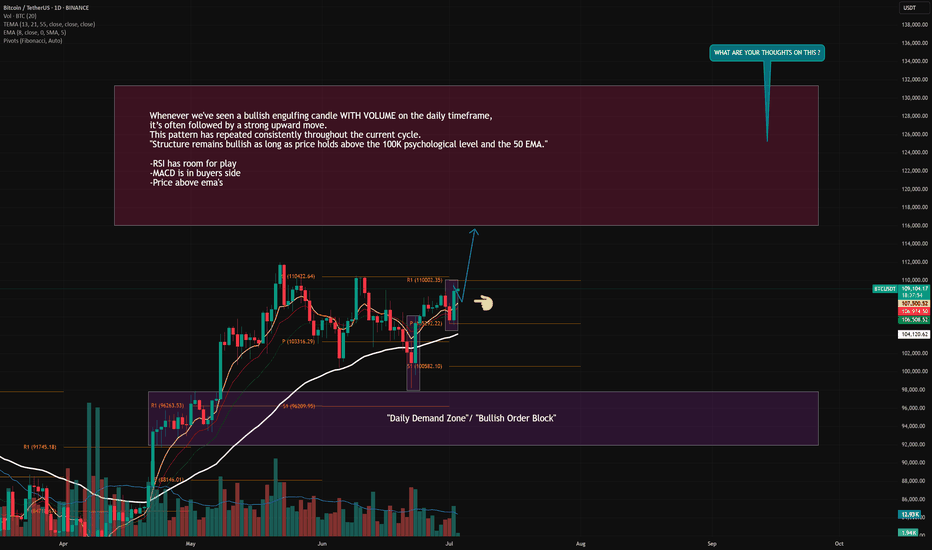
Whenever we've seen a bullish engulfing candle on the daily timeframe, it’s often followed by a strong upward move. This pattern has repeated consistently throughout the current cycle. 🔹 The recent daily close shows a clean bullish engulfing right off the 50 EMA support. 🔹 Previous purple zones also highlight areas where similar engulfing candles led to sharp...
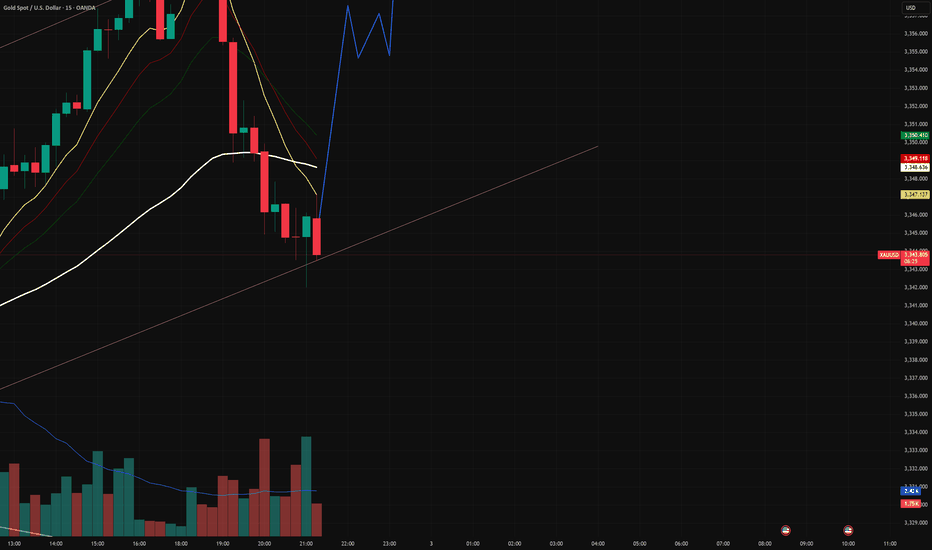
Gold on the 15-minute timeframe has shown a sharp intraday pullback but is now reacting off the lower boundary of the ascending intraday channel. The current setup suggests a possible recovery phase, targeting a retest of the 3,356 intraday resistance level. 🔍 Key Observations: Clean bounce from channel support with strong volume reaction. Bullish EMA structure...
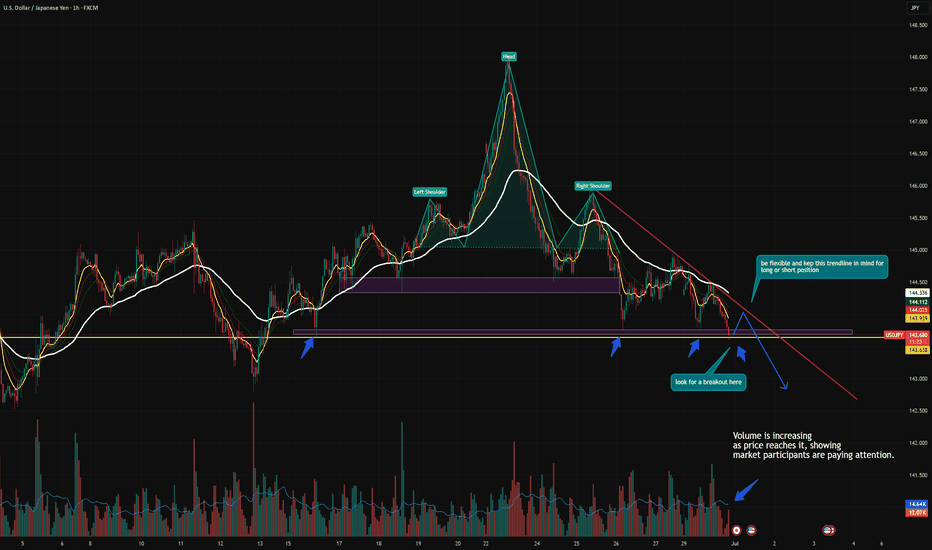
🔻 USDJPY Sitting at Critical Support – Decision Point Ahead USDJPY is currently hovering around the 143.60–143.65 zone — a major support level that has held multiple times in the past. 🔍 Price just completed a clean Head & Shoulders breakdown, and this zone marks the neckline retest area. We're now at a make-or-break point: Break Below 143.60: Confirms bearish...
The EUR/JPY pair has been trending steadily inside a well-defined ascending channel, indicating bullish control over the past few weeks. However, price is now approaching a major horizontal resistance zone, aligning with the upper boundary of the channel — a critical area for potential breakout or reversal. 🔍 Chart Structure Breakdown: 🔹 1. Ascending Channel...
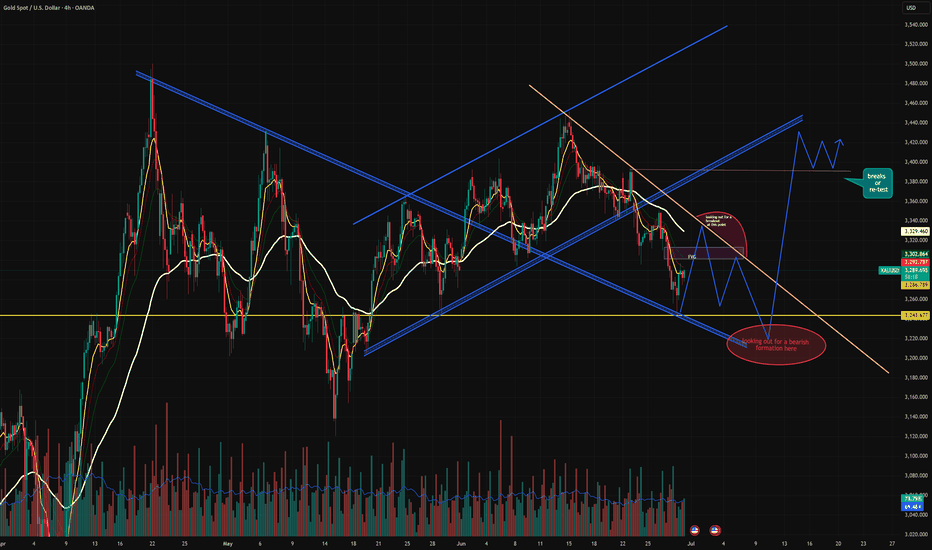
🔔 XAUUSD 4H Analysis – Key Levels, FVG Reaction & Structure Projections Gold is currently trading within a complex structure after breaking down from a rising parallel channel and is now testing confluence zones that could dictate the next major move. 📈 Scenarios: 🔺 Bullish Path: Clean breakout and retest above the FVG zone and descending trendline → price...
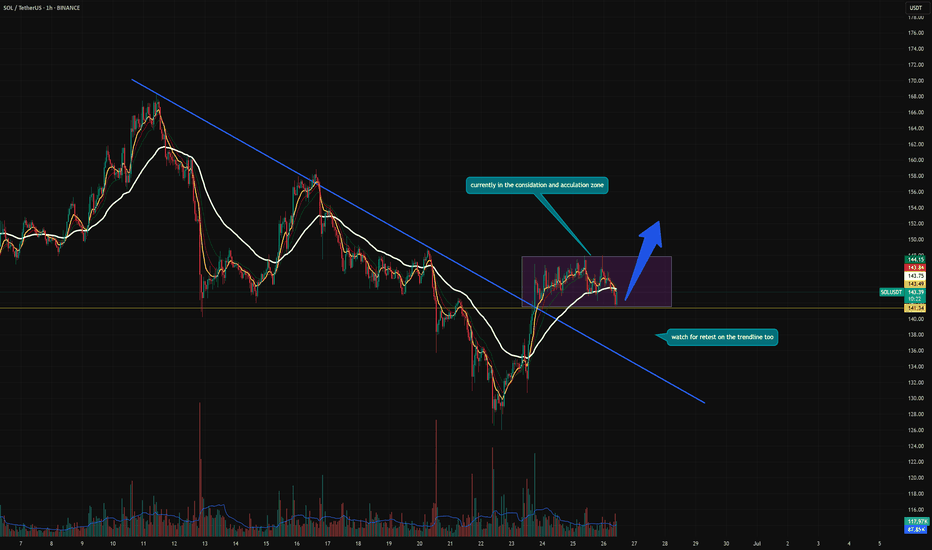
📍 Overview: SOL has successfully broken out of a major descending trendline that has been acting as resistance since mid-June. Price is now consolidating above that line, forming a tight accumulation zone — a classic pre-breakout setup. 🔍 What I'm Watching: Price is currently holding within a sideways range (highlighted in purple). The previous downtrend line...
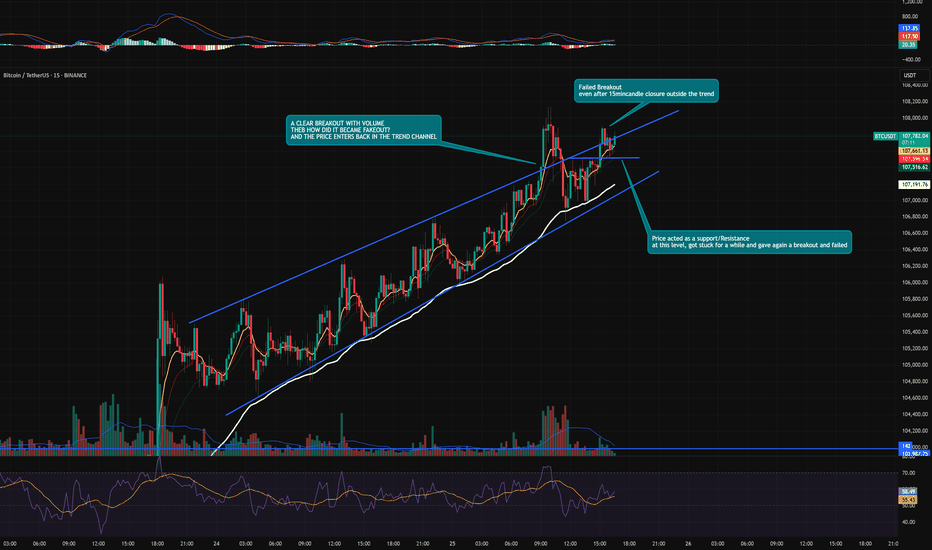
This chart highlights an important lesson in breakout trading: Not all breakouts are valid, even when backed by volume. 🔍 Technical Breakdown: BTC was trading inside a well-respected ascending channel, with multiple touches on both the upper and lower bounds. Price broke above the channel with a 15-minute candle close and volume, giving the appearance of a...
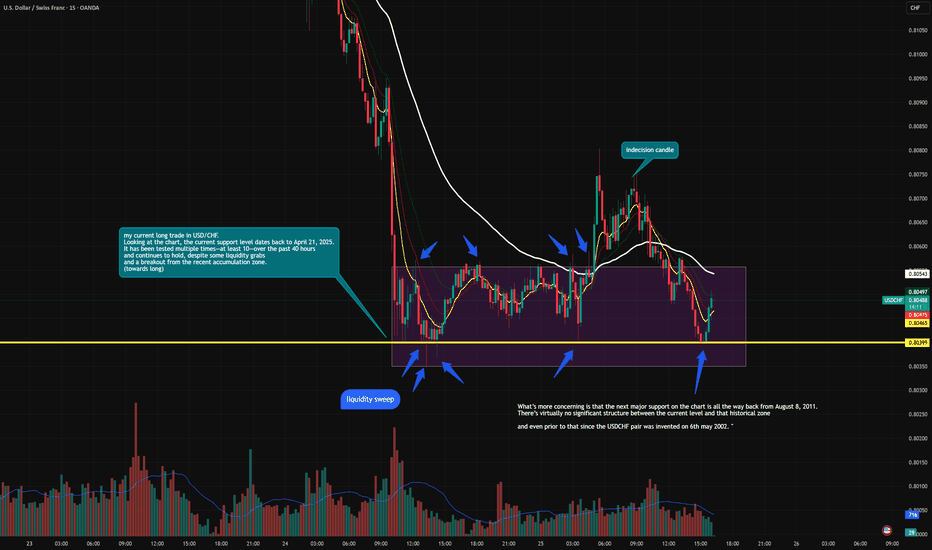
Repeated liquidity sweeps (marked with arrows) indicate smart money absorbing sell pressure. Consolidation is happening after a significant downtrend, suggesting potential reversal. The volume stays steady — no major breakdowns or explosive exits. What you see here is a textbook accumulation phase forming on the USD/CHF chart — not just because of the sideways...
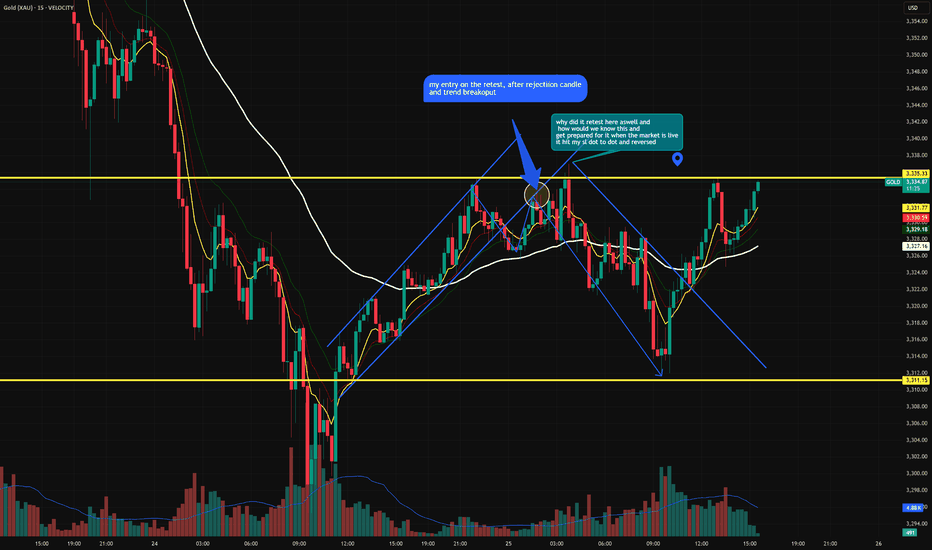
1st retest failed after breakout and tried second retest. and it passed but hunted my stoploss.and then continued downward as planned
