SMC-Trading-Point
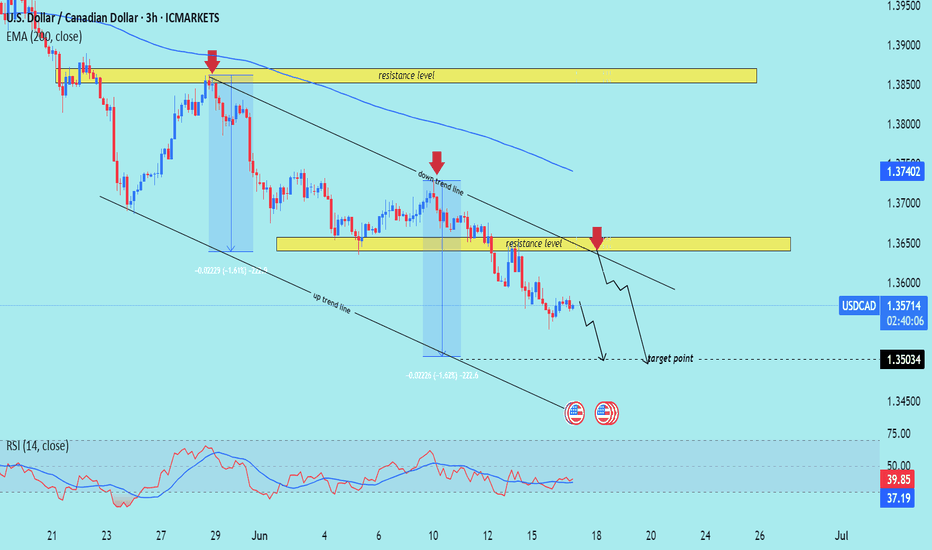
PremiumSMC trading point update Technical analysis of USD/CAD on the 3-hour timeframe, using Smart Money Concepts (SMC) and classic technical analysis. Here's a breakdown --- Key Technical Insights: Overall Trend: The pair is in a clear downtrend, confirmed by: Lower highs and lower lows Price trading below the 200 EMA (currently at 1.37402) Respect for...
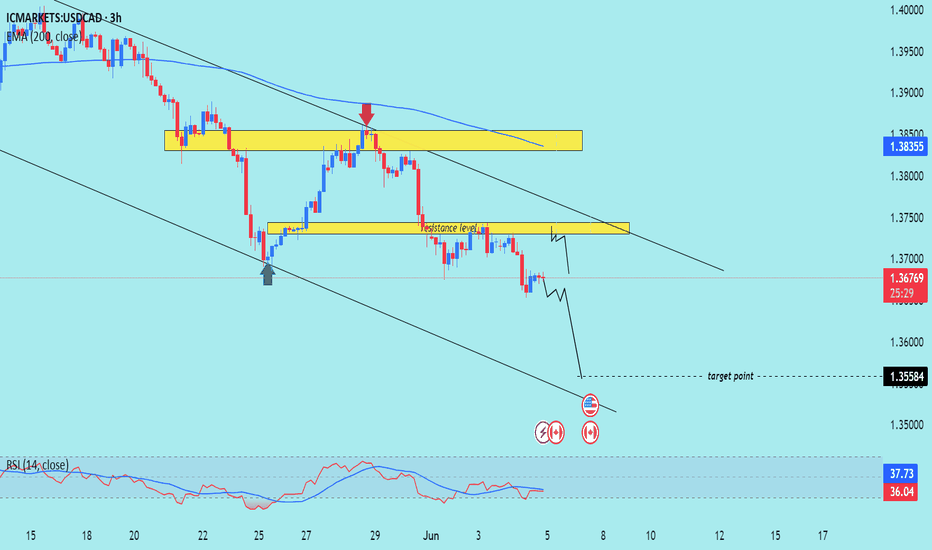
SMC trading point update Technical analysis of USD/CAD on the 3-hour timeframe reflects a bearish market outlook. Here’s a breakdown of the idea: --- Trend Overview: The pair is in a clear downtrend, confirmed by: Lower highs and lower lows Price trading below the 200 EMA A bearish flag pattern in play --- Key Zones & Levels: 1. Resistance Zones...
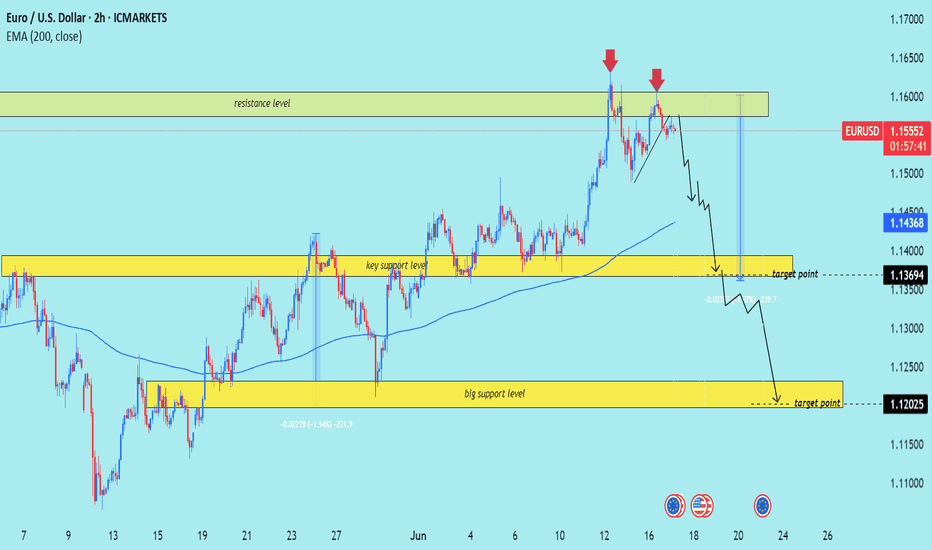
SMC trading point update Technical analysis of EUR/USD pair on the 2-hour timeframe. Here's a breakdown of the idea behind the analysis: --- Trading Idea Summary: EUR/USD Bearish Reversal Setup 1. Rejection at Resistance Zone Resistance Level (~1.1600): Price has tested this level twice (red arrows) and faced strong rejection, suggesting it’s a firm...
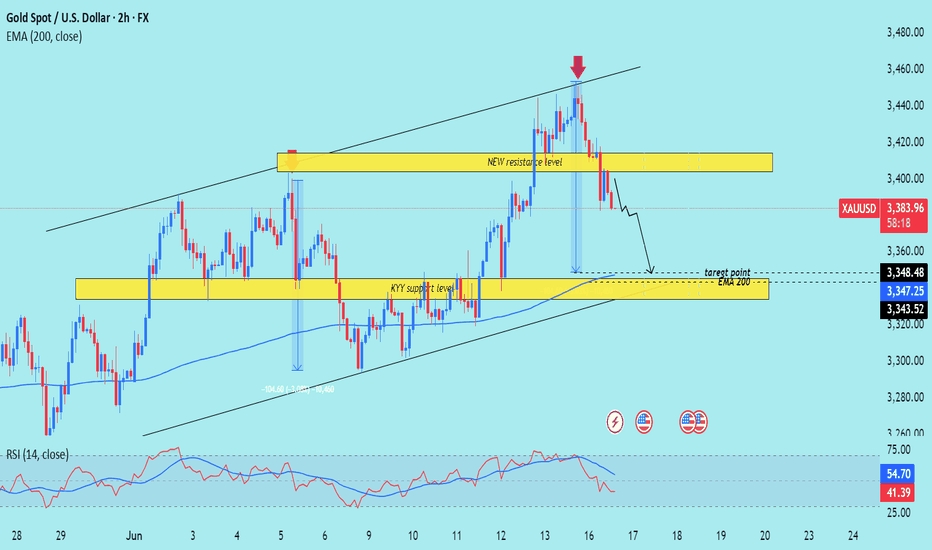
SMC trading point update Technical analysis of XAU/USD (Gold Spot vs U.S. Dollar) – 2H Timeframe: --- XAU/USD Bearish Rejection from Resistance – Short-Term Sell Setup Key Observations: 1. Rejection from Upper Channel & Resistance Zone: Price was rejected sharply after touching the upper boundary of the ascending channel and the newly established...
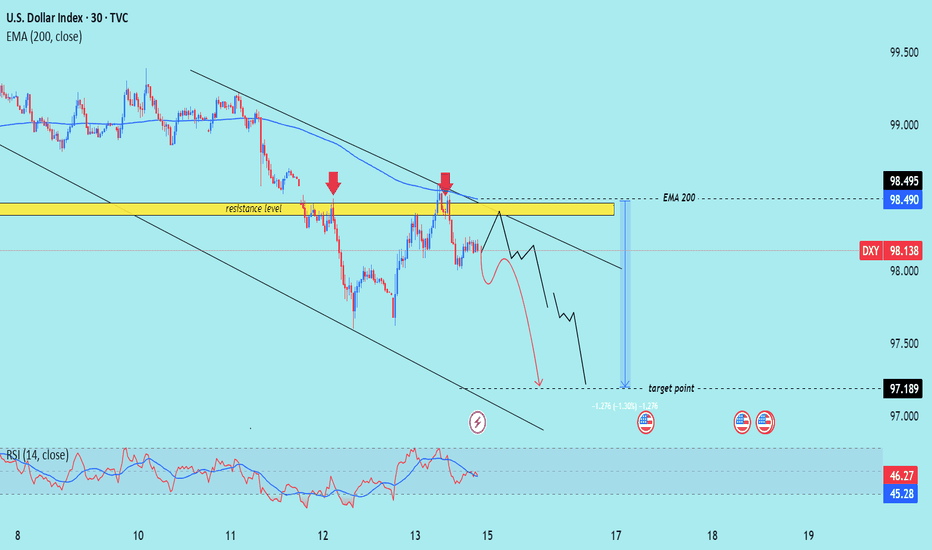
SMC trading point update Technical analysis of U.S. Dollar Index (DXY) on the 30-minute timeframe, with the price respecting a clear downtrend and repeatedly rejecting a resistance zone near the 200 EMA. --- Analysis Breakdown Key Technical Elements: 1. Downtrend Structure: The price remains within a descending channel. Multiple lower highs and lower...
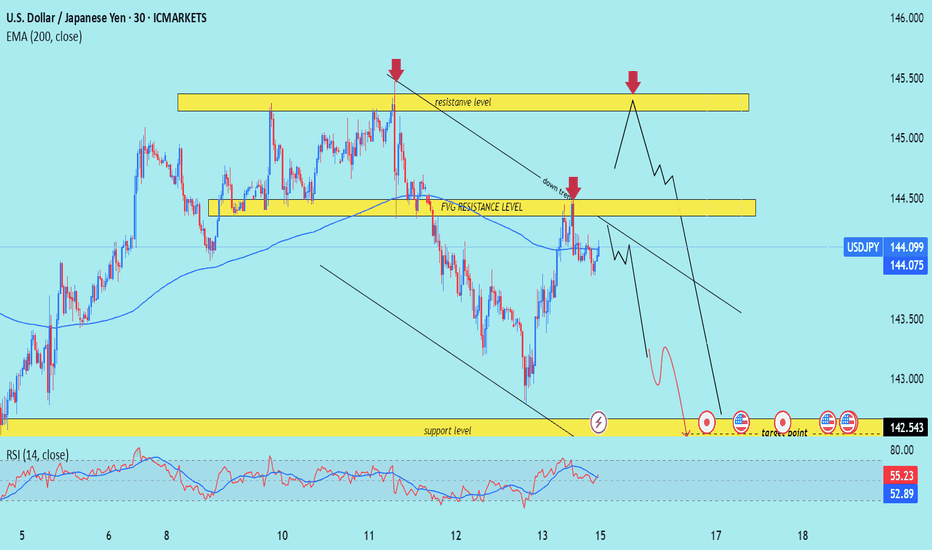
SMC trading point update Technical analysis iUSD/JPY on the 30-minute timeframe, showing a rejection from resistance zones and a potential move toward lower support levels. --- Analysis Breakdown Technical Components: 1. Resistance Zones: Primary Resistance: Near 145.500 (upper yellow box), which has previously been rejected multiple times (red...
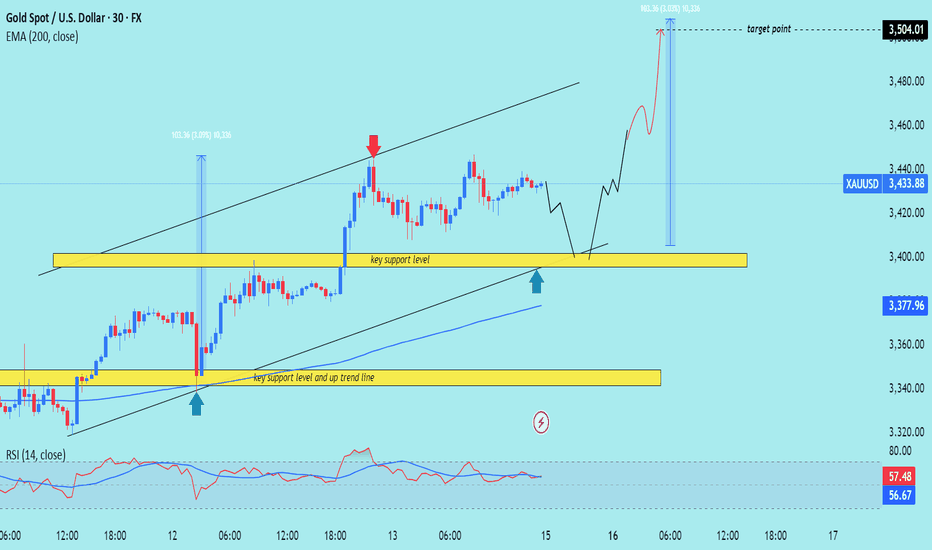
SMC trading point update Technical analysis of (XAU/USD) on the 30-minute timeframe, incorporating a support zone and trendline confluence strategy. Here's a breakdown --- Analysis Summary Key Technical Elements: 1. Uptrend Channel: Price is trading within a rising channel. Higher highs and higher lows indicate bullish momentum. 2. Support...
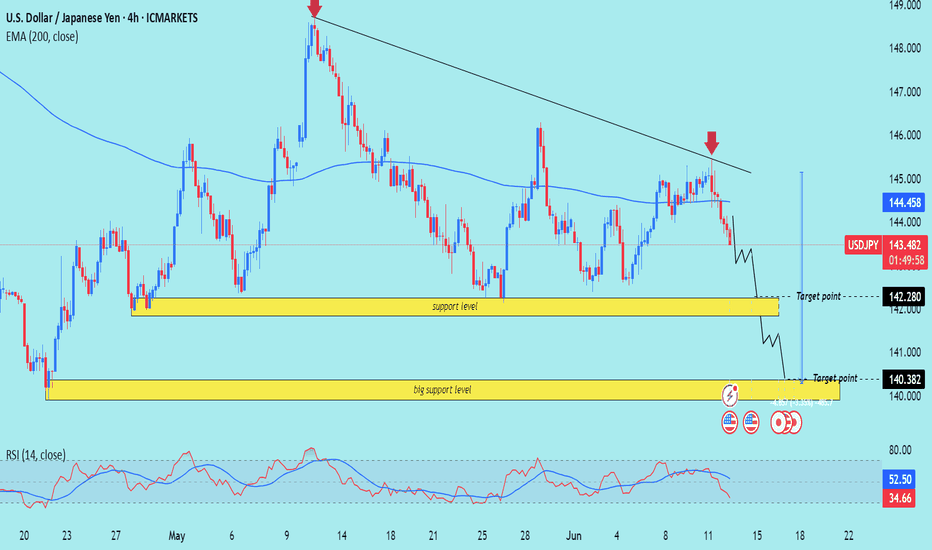
SMC trading point update Technical analysis of USD/JPY (U.S. Dollar vs. Japanese Yen) on the 4-hour timeframe. Here's a breakdown of the analysis: --- Trend & Price Action The chart shows a descending trendline connecting recent lower highs, indicating a downtrend. Current price: 143.548 Price has recently rejected off the trendline and started to...
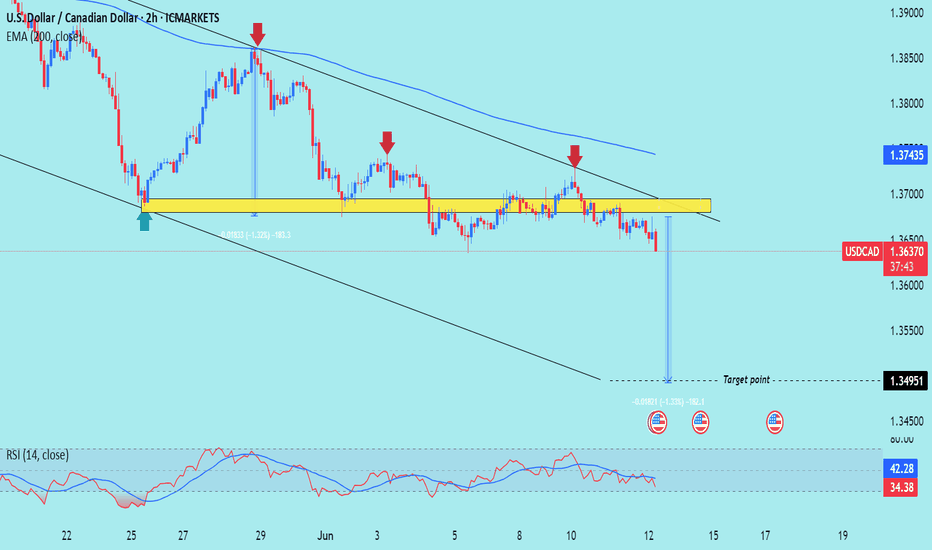
SMC trading point update Technical analysis of USD/CAD (U.S. Dollar / Canadian Dollar) currency pair on the 2-hour timeframe, and it suggests a potential sell setup based on price action, key levels, and momentum indicators. --- Chart Summary Pair: USD/CAD Timeframe: 2H Current Price: 1.36432 EMA 200: 1.37436 Direction Bias: Bearish Volume:...
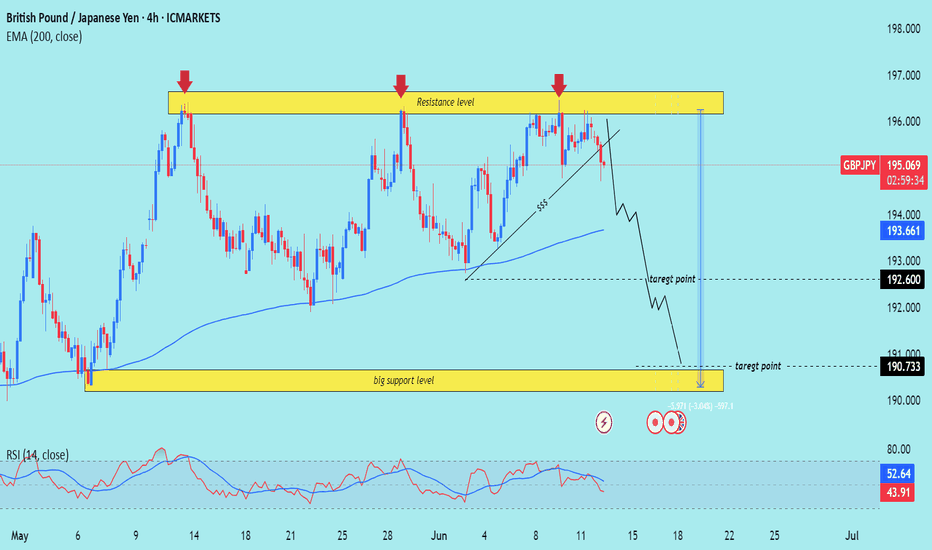
SMC trading point update Technical analysis of GBP/JPY (British Pound / Japanese Yen) based on multiple Technical signals on the 4-hour timeframe. Let's break it down in detail: --- Overall Analysis Summary Direction Bias: Bearish Timeframe: 4H Price (at analysis time): 195.033 Tool Used: EMA 200, RSI, Support/Resistance, Chart Pattern --- Technical...
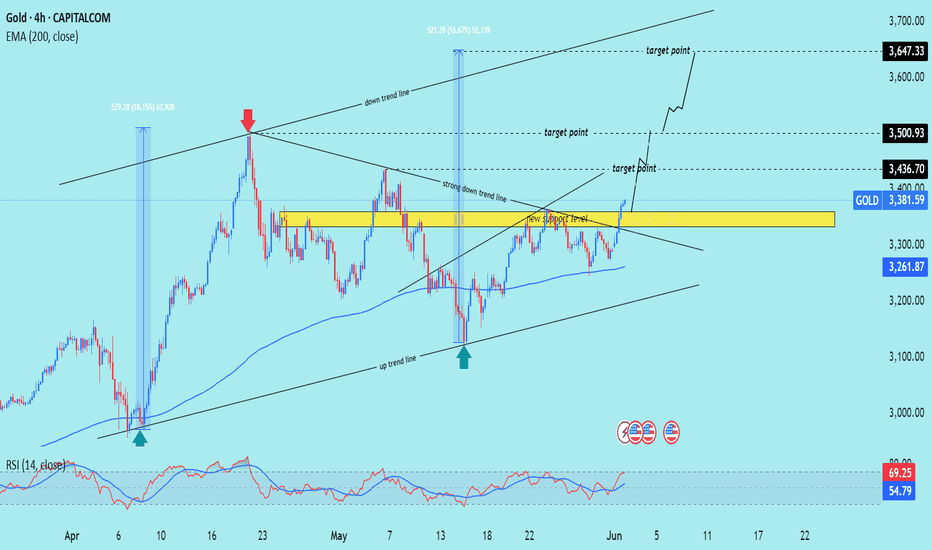
SMC Trading point update Technical analysis chart of gold (XAUUSD) on the 4-hour timeframe. Here’s a breakdown of the key ideas presented in the chart: --- Key Support/Resistance Zone A yellow rectangular zone marks a significant support/resistance level. This level was previously a resistance and has now been flipped into support ("new support...
SMC trading point update Technical analysis of the USD/JPY (US Dollar / Japanese Yen) pair on a 2-hour timeframe. Here's the idea behind the analysis: --- Overall Idea: Bearish Move Toward Support --- Key Levels Resistance Zone (Yellow Box, Top): Marked with two red arrows — shows strong price rejection around 146.00–147.00 area. Support Zone (Yellow...
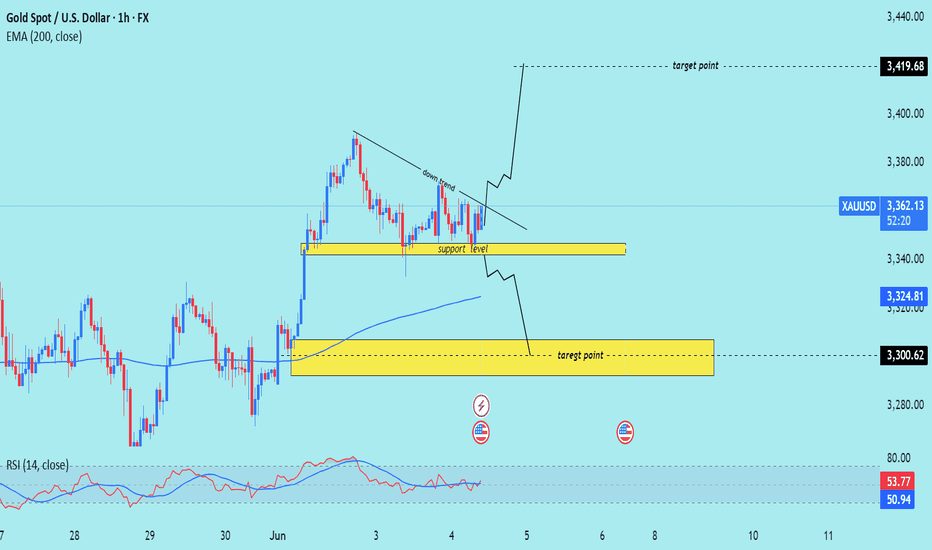
SMC trading point update Technical analysis of Gold (XAUUSD) on the 1-hour timeframe. Here's a breakdown of the key ideas in the analysis: --- Chart Elements: Support Level (Yellow Zone at ~3,340–3,350): This area has been highlighted as a key support zone where price has bounced previously. Price is currently hovering just above this level. Downtrend...
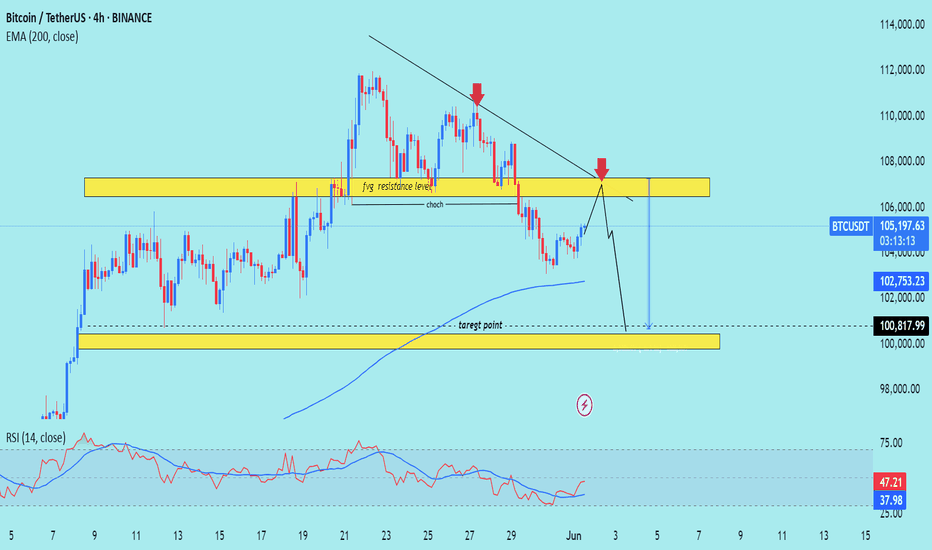
SMC trading point update Technical analysis of (BTC/USDT) based on the 4-hour timeframe. Here’s a detailed breakdown of the analysis and the idea behind it: --- Key Components of the Analysis: 1. Resistance Zone (FVG - Fair Value Gap): The yellow zone marked as “fvg resistance level” indicates an area where price previously dropped quickly, suggesting...
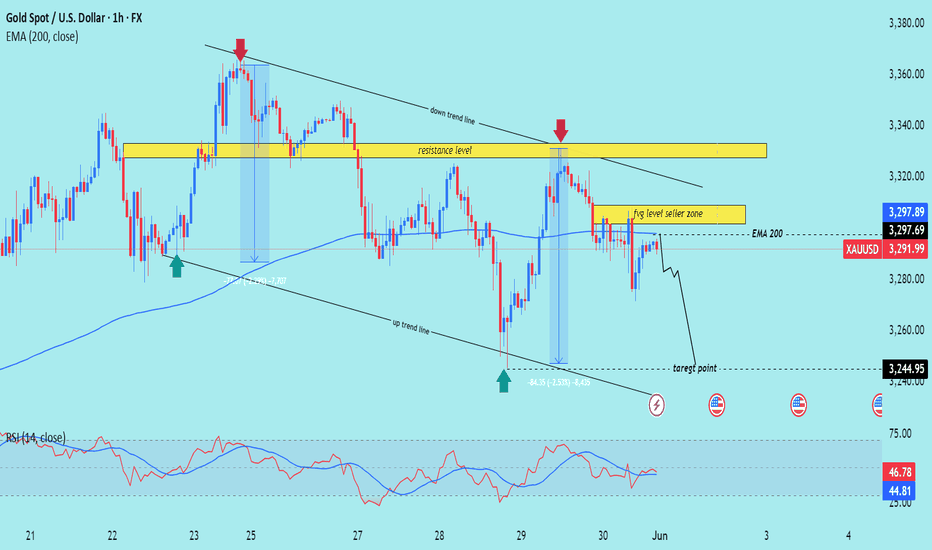
SMC trading point update Technical analysis of XAU/USD (Gold Spot) on the 1-hour timeframe, based on Smart Money Concepts (SMC). Here's a breakdown of the idea and trading scenario: --- Overall Idea: Bearish Continuation --- Market Context Current Price: $3,291.99 EMA 200: $3,297.69 (acting as dynamic resistance) Trend: Price is within a descending...
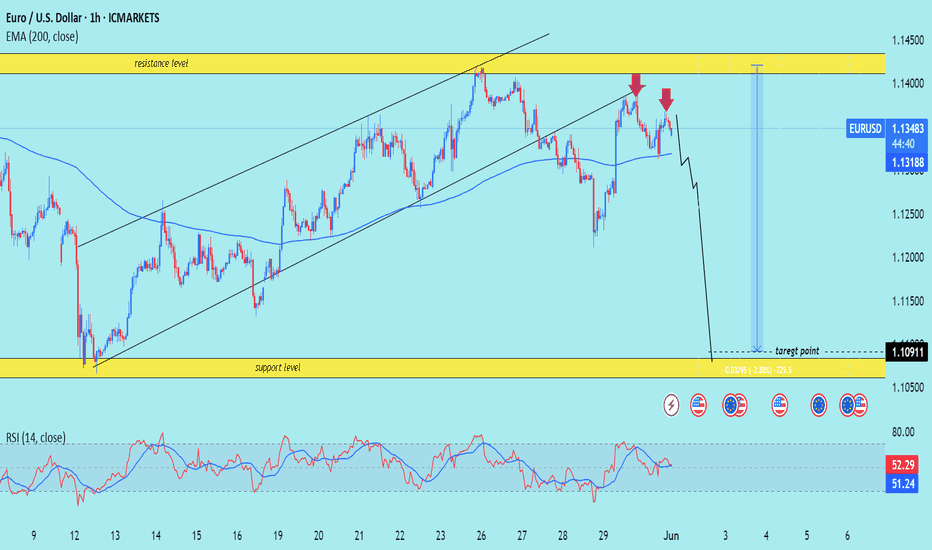
SMC trading point update Technical analysis of EUR/USD on the 1-hour timeframe, likely projecting a short-term downward move. Here’s a breakdown of the technical analysis and the trade idea: --- Key Elements in the Chart: 1. Bearish Rejection from Resistance: Price was rejected twice near the 1.14400 resistance zone (highlighted in yellow). The red...
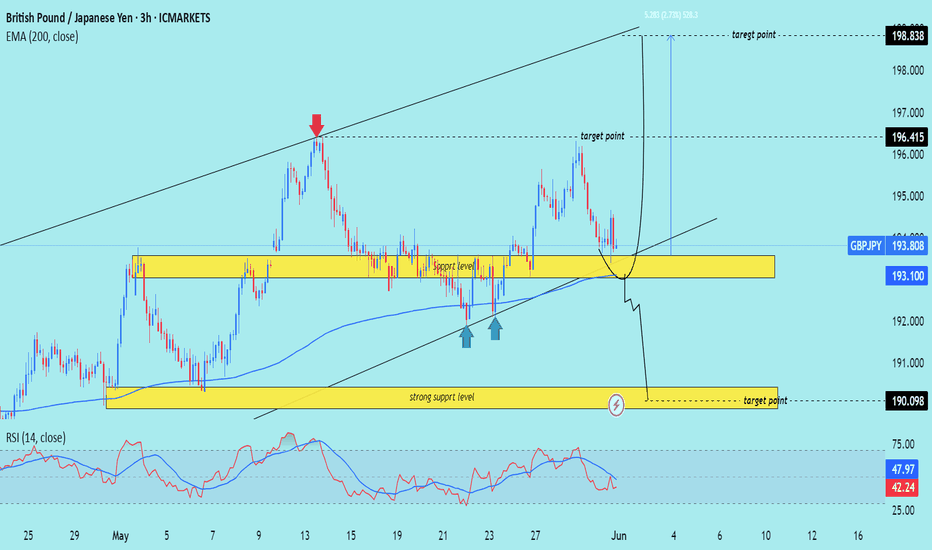
SMC trading point update Technical analysis of GBP/JPY (British Pound / Japanese Yen) on the 3-hour timeframe using Smart Money Concepts (SMC) and structure-based patterns. --- Market Overview Current Price: 193.808 EMA 200: 193.100 (acting as dynamic support) RSI (14): 42.24 → Neutral/Bearish territory --- Two Possible Scenarios (Bullish &...
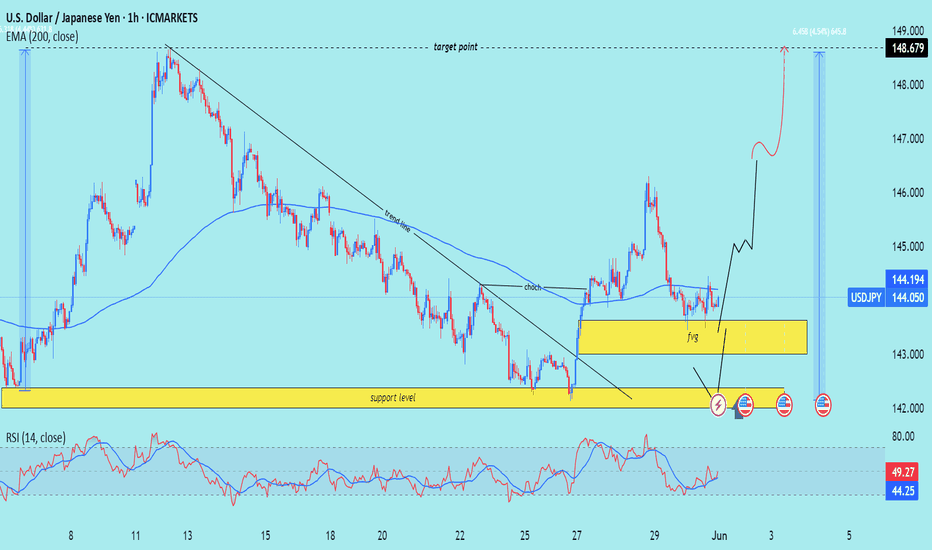
SMC trading point update Technical analysis of USD/JPY presents a bullish outlook with Smart Money Concepts (SMC)-based logic. Here's a breakdown of the idea and key elements: --- Chart Summary Current Market Context Price: ~144.05 EMA 200: Acting as dynamic resistance at 144.19 Trendline: Broken, signaling a potential shift in market...
