Sh_alotaibi
PremiumNYSE:JMIA Inverted Head & Shoulders pattern breakout with high Volume . Target ~12.5
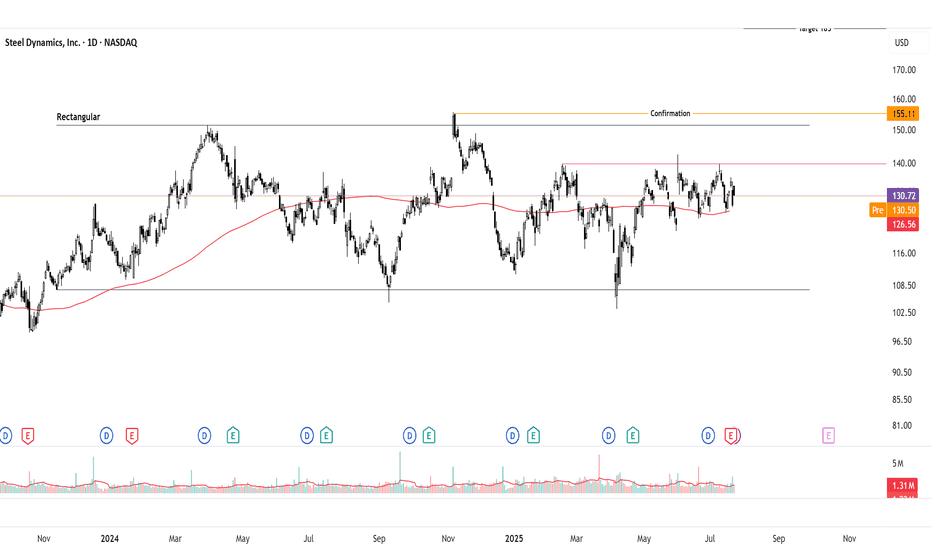
Steel Dynamics ( NASDAQ:STLD ) is consolidating on the daily chart but forming an inverted head and shoulders (IHS) pattern, signaling potential bullish reversal. Neutral until breakout above 140 pivot, but bias leans bullish with supportive steel fundamentals. Long idea on confirmation; current price ~132-135 (as of July 23, 2025). Upside targets offer strong...
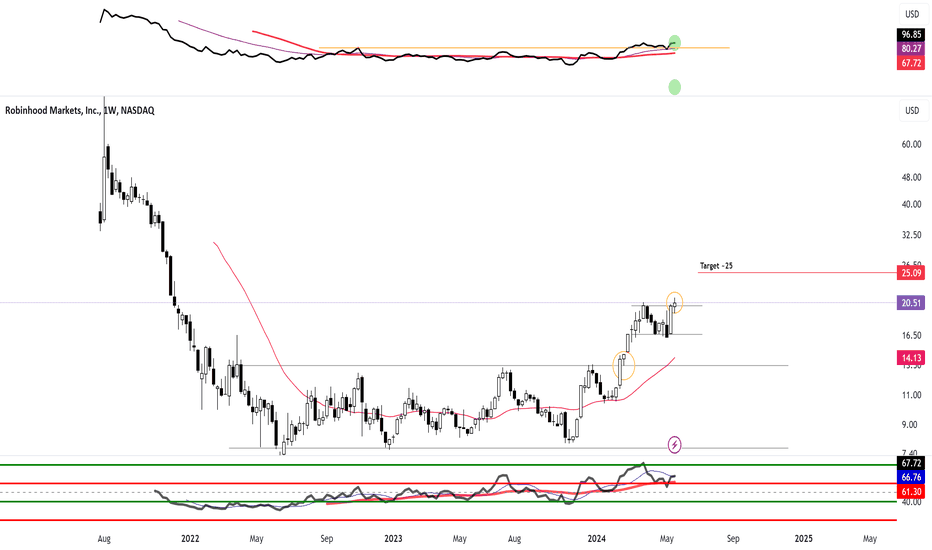
NASDAQ:HOOD Long NASDAQ:HOOD Start Uptrend with base breakout and Tar
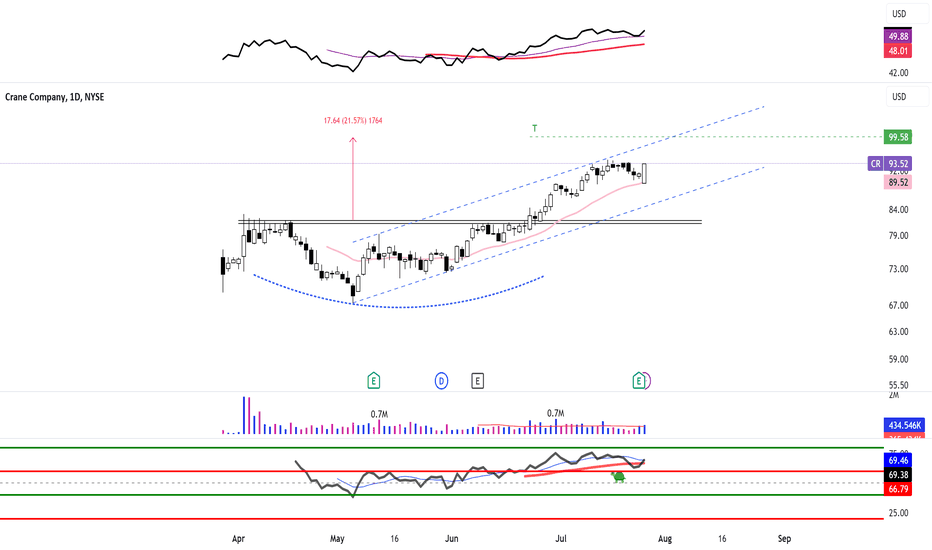
NYSE:CR Saucer Shape long with Target ~100 Pullback around 21EMA
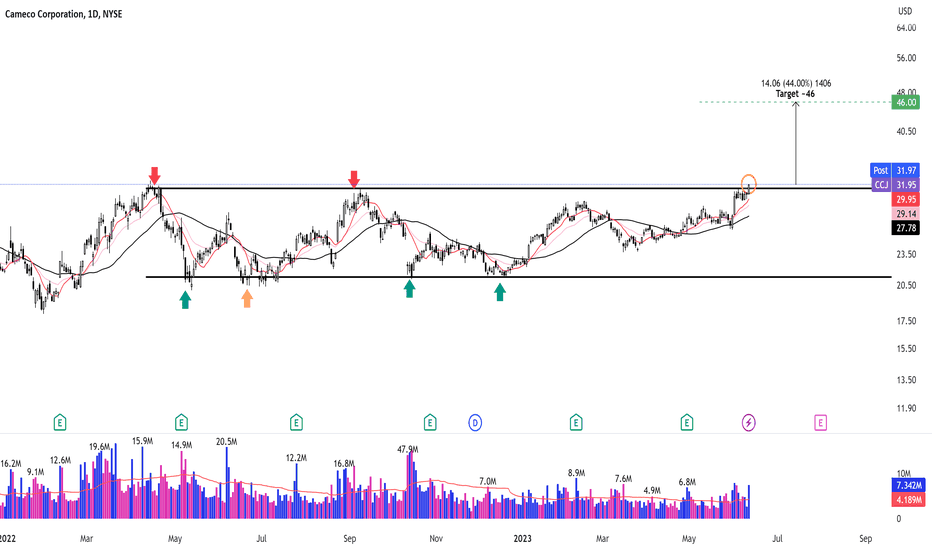
NYSE:CCJ in Uptrend with High Relative Strength consolidation for more than year and today Breakout above pivot point. Pivot Point: 31.40 1st Target: ~38.3 (~20%) 2nd Target: ~46 (~44%)
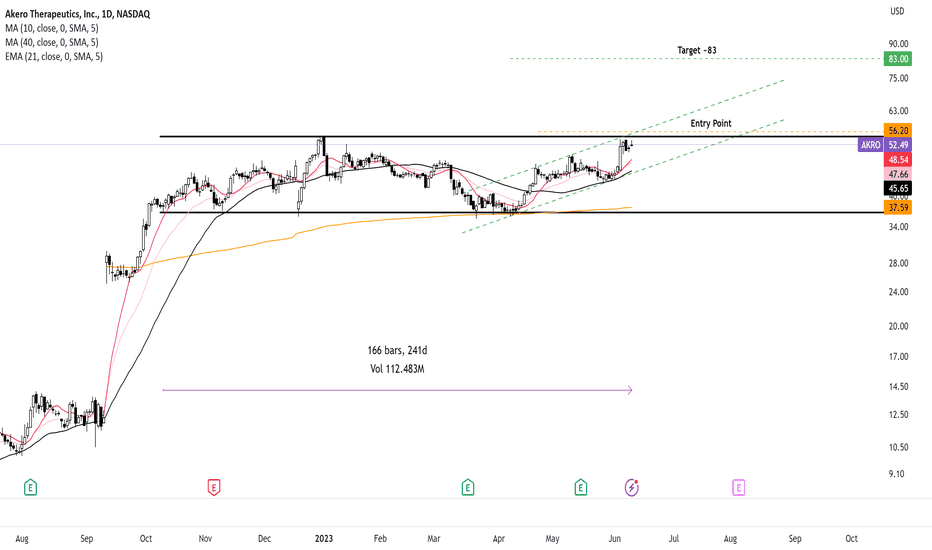
NASDAQ:AKRO Uptrend Rectangle pattern Daily chart, Above KMAs, , Around Breakout (pivot point ~54.85), Pivot point: ~52.5 confirmation entry point: 56.2 Stop loss: 51.7 (8%) Target: ~ 83 (47.7%)
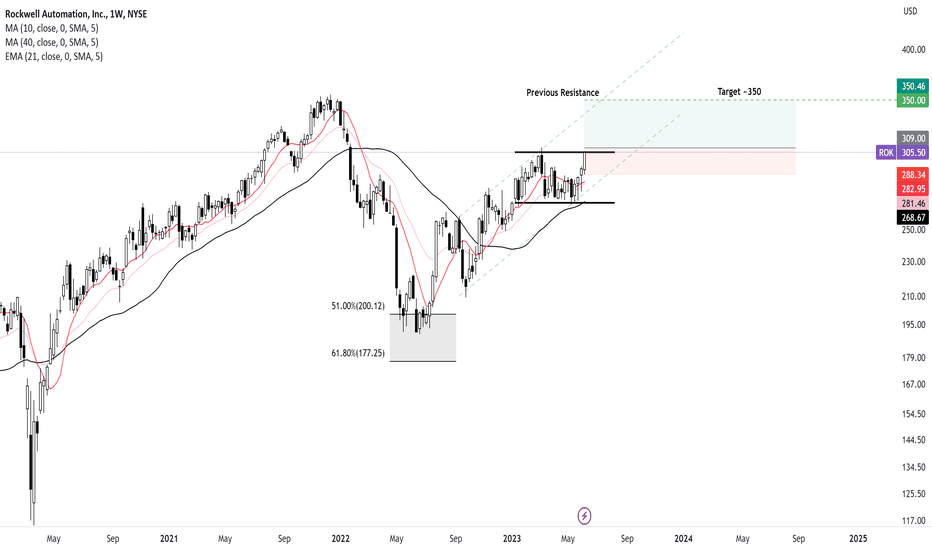
NYSE:ROK Uptrend Rectangle pattern weekly chart,Above KMAs, Last 4 constructive Candlesticks, Around Breakout (pivot point ~305.5), it's need which i think 309 Pivot point: ~305.5 confirmation entry point: 309 Stop loss: 288.3 (6.7%) Target: ~ 350 (13.5%)
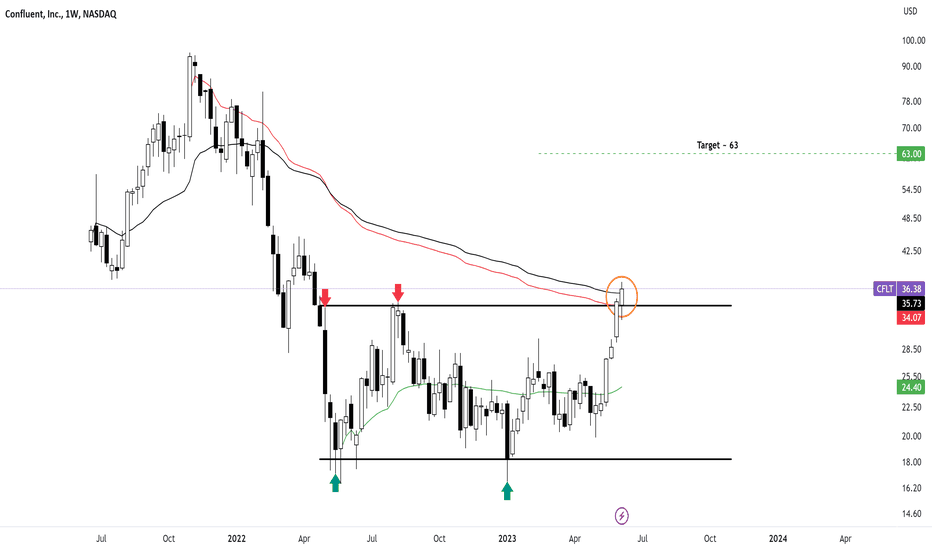
NASDAQ:CFLT Confluent, Inc. operates a data streaming platform in the United States and internationally. Uptrend rectangle pattern, above AVWAP from Highest point and ipo day. Breakout (pivot point) ~34 with Massive 6 weeks accumaltion. Breakout (pivot point): ~34 Target ~ 63
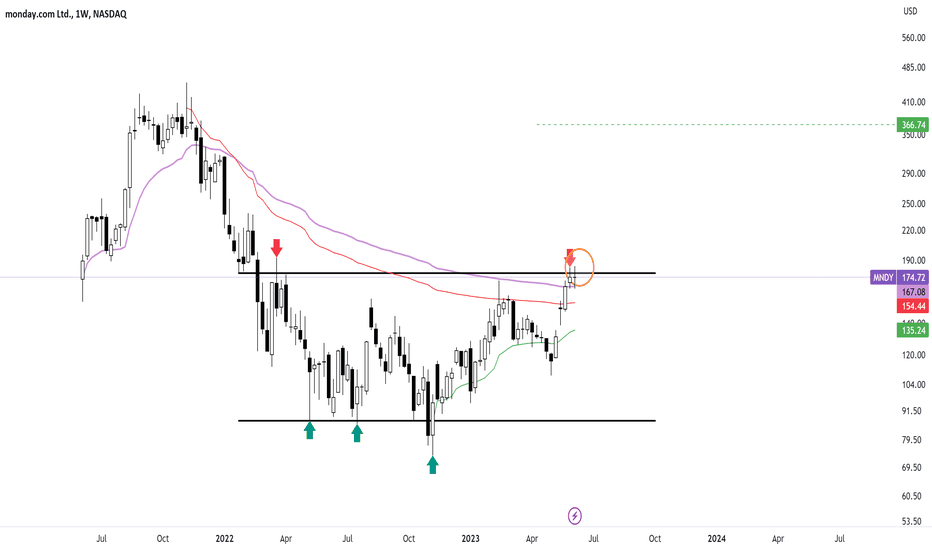
NASDAQ:MNDY Uptrend rectangle pattern weekly chart, above AVWAP from Highest point and ipo day. Near from pivot point(178). if there is Breakout above 178our Target will be around 366.
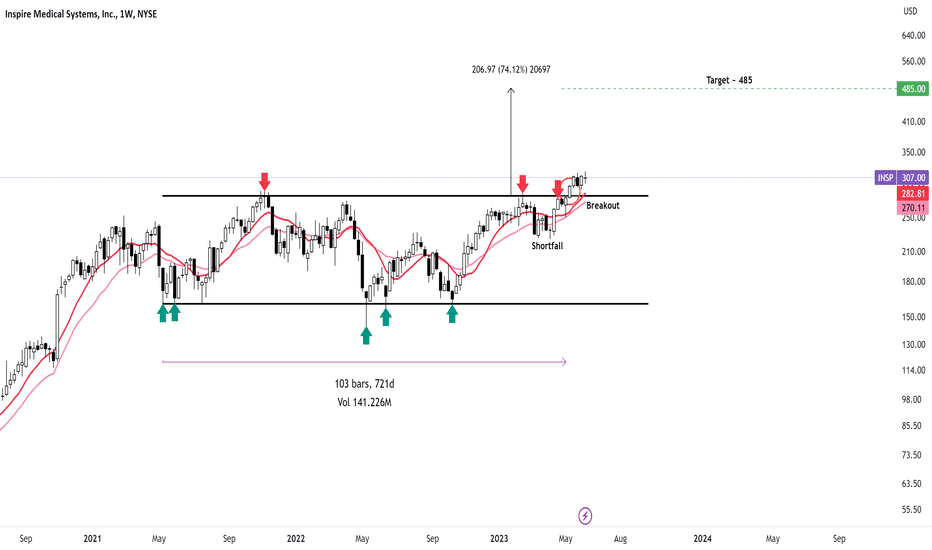
NYSE:INSP Uptrend with sideways rectangle pattern around 103 weeks. Breakout (pivot point): ~279 Target ~ 485
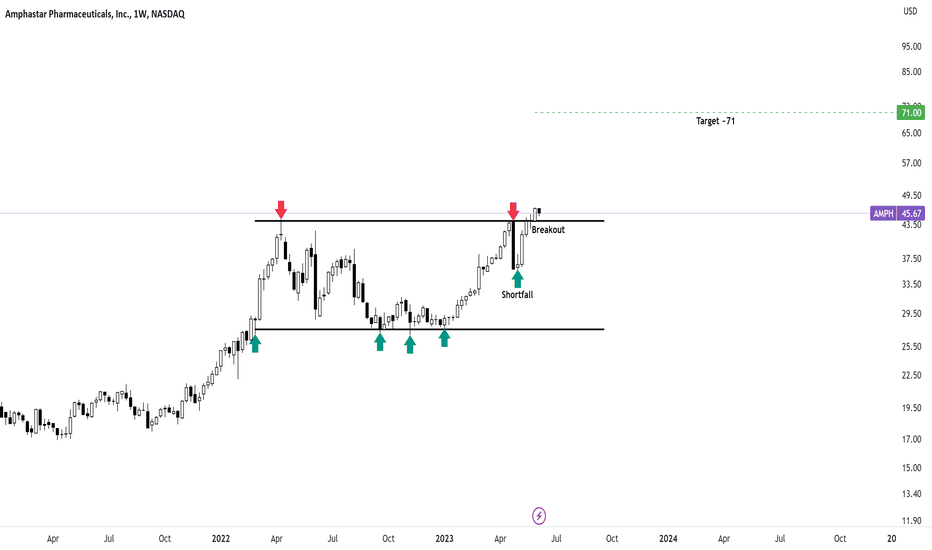
Amphastar Pharmaceuticals NASDAQ:AMPH uptrend , Breakout rectangle pattern weekly chart breakout (pivot point) ~ 44 Target ~ 71
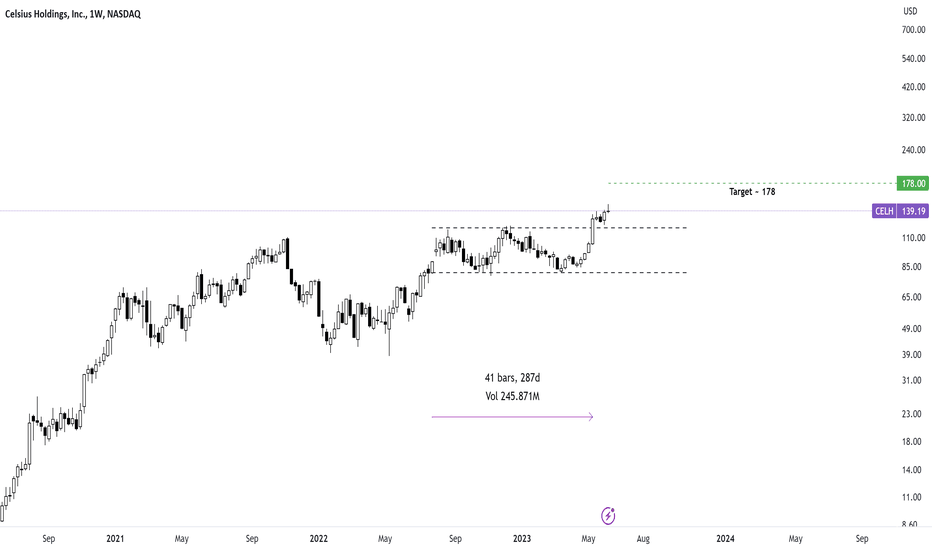
NASDAQ:CELH Leader stock, with rectangle pattern with price range between 80 -119. Breakout (pivot point) ~ 119 Target ~179
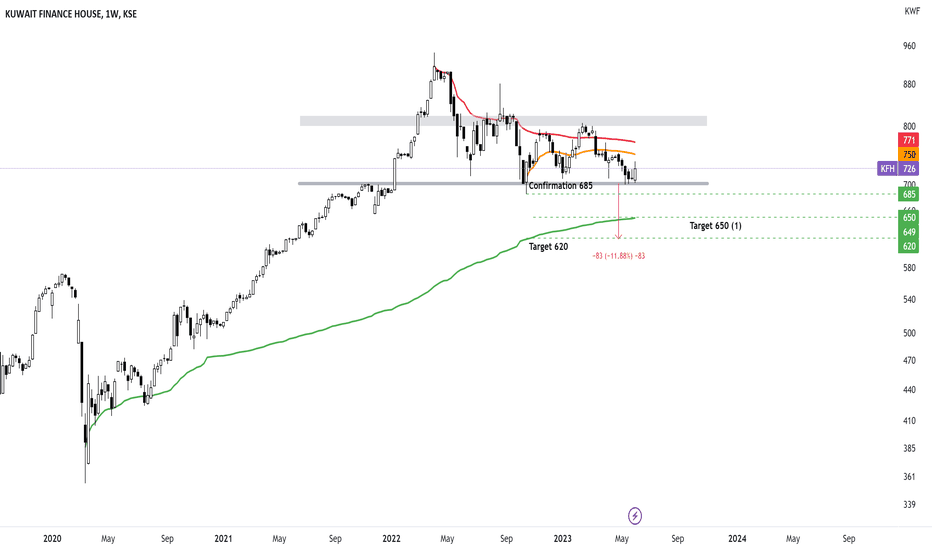
KFH weekly down trend rectangle pattern (and descending triangle) if it's breakdown 702, then break 685 confirmation the first target 650, Second target ~ 620
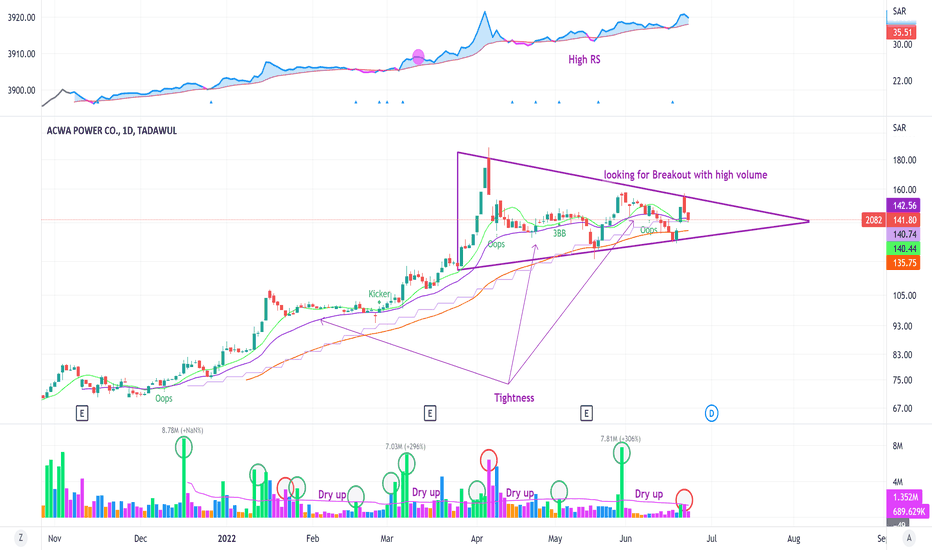
TADAWUL:2082 - Symmetrical Triangle Pattern (VCP) with tightness candle weekly or daily. -High Relative strength compare to TASI . -Many breakouts with high volumes, as shown in the chart. -If it breaks resistance, it will probably be a good chance for a long position. - 3 July 2022 will be Earning call. You should be cautious. -You need fundamental analysis...
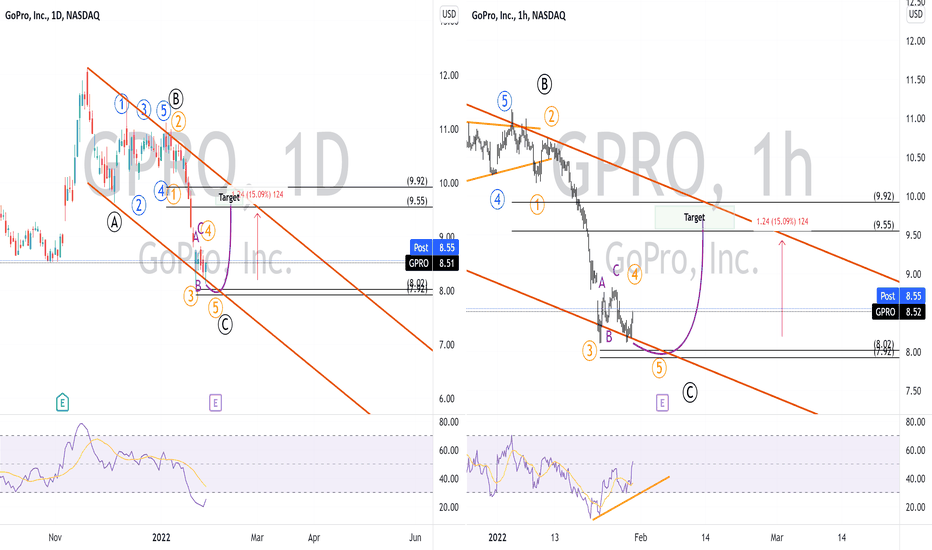
GoPro channel from 18 Nov 2021 till Today 28 Jan 2022, with 3 touches for resistance and 2 for Support. and we have Corrective Waves A, B, C Today 28 Jan 2022 around the 5th wave of C wave. (need to close below 8.11 for confirmation). My conclusion GoPro will go up from ~8.11 to 9.55 ~ 15%. Target Price ~ 9.6 $

