Shahbaz_B14A
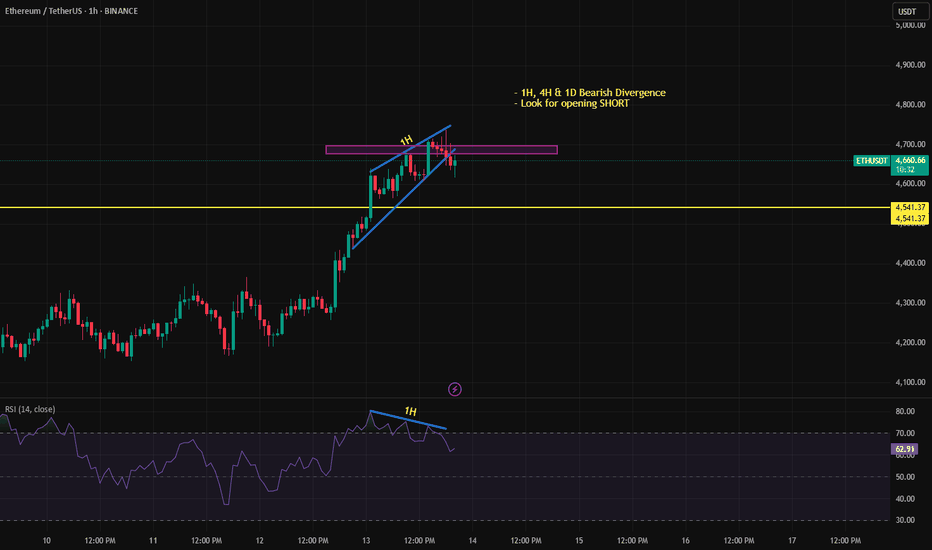
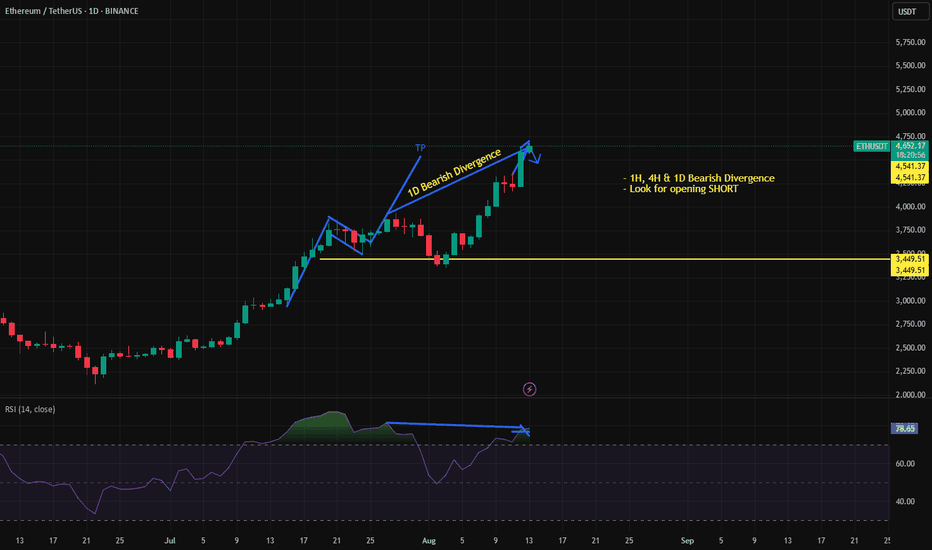
In continuation of the previous ETH/USDT Sell/Short outlook, the price has formed a bearish candle below the neckline. This position can be maintained until the bearish divergence is fully resolved across all three timeframes — 1H, 4H, and 1D.
1D Bearish Divergence: Price made a higher high while RSI made a lower high → momentum weakening. Multi-timeframe confirmation: The same divergence is visible on 1H and 4H → increases reliability of a reversal. Price at TP: Already hit the prior projection target. Neckline watch: A close below the marked yellow neckline (~$4,541) could be your trigger to open...
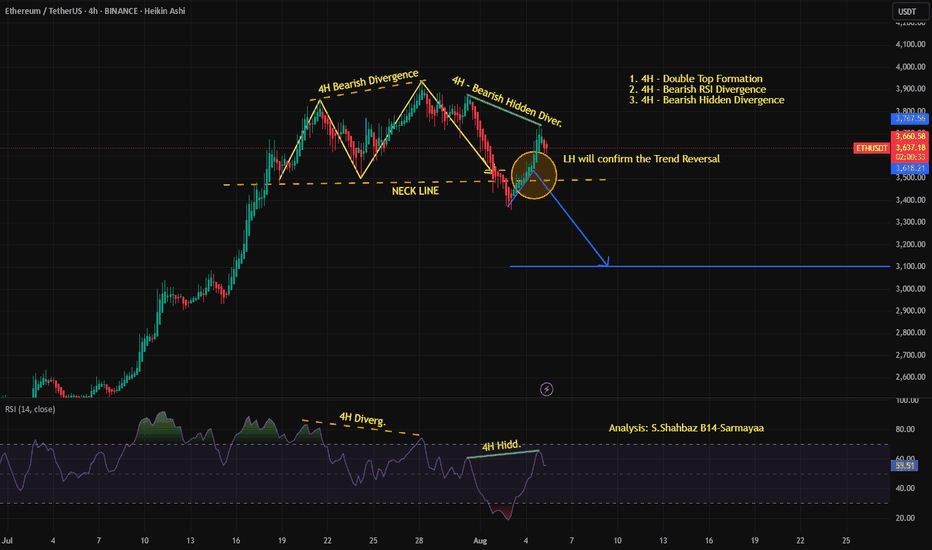
This 4H chart of Ethereum (ETH/USDT) is indicating a strong bearish reversal setup. A double top formation has formed near the $3,770 zone, accompanied by both a regular bearish divergence and a bearish hidden divergence on the RSI. Price has broken down below the neckline of the double top, and a possible retest zone is marked, which may act as resistance. If...
The 4H chart is showing a bullish hidden divergence where the price is making a higher low while RSI is making a lower low. This suggests a continuation of the uptrend after a healthy pullback. A 'Buy on Dip' zone has been marked near 561, with stop-loss (SL) significantly below at a strong support zone near 375. Confirmation of this hidden divergence strengthens...


