SheikhNaveed
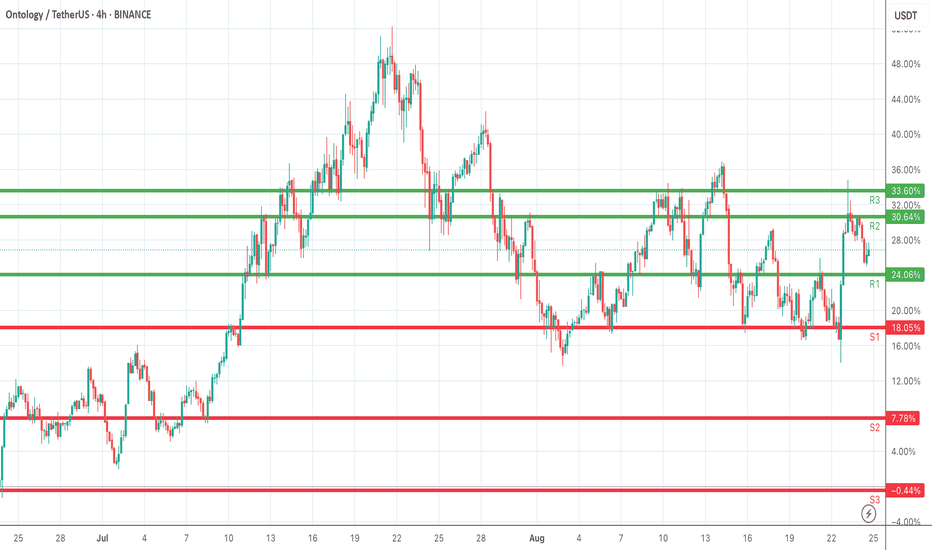
Ontology is trading within a well-defined range, testing support and resistance levels frequently. On the downside, S1 (18.05%) is the first support to monitor. A break below could extend losses toward S2 (7.78%), with S3 (-0.44%) acting as a deeper bearish target. On the upside, R1 (24.06%) is the first resistance that price recently reclaimed. If momentum...
FLM is consolidating after reclaiming key support zones. On the downside, S1 (0.0296) and S2 (0.0291) are the immediate supports. A deeper correction could extend toward S3 (0.0260) if bearish momentum accelerates. On the upside, R1 (0.0314) is the first resistance to watch. A confirmed breakout above it strengthens the case for a move toward R2 (0.0344), with...
This is a sample analysis description. The chart highlights key support and resistance levels, along with possible price movement scenarios. Please note that this is only placeholder text and does not represent actual financial advice.
AUDIO/USDT 4H Technical Outlook AUDIO is consolidating within a defined range. S1 and S2 act as immediate downside levels where buyers may attempt to hold the price, while a deeper pullback could test lower supports. On the upside, R1 and R2 serve as resistance barriers that must be cleared for bullish momentum to continue. A confirmed breakout above R1 could open...
ALGO is trading around the mid-range, with S1 (50.37%) acting as immediate support. A deeper pullback may target S2 (34.77%) and S3 (-4.24%) if selling pressure increases. On the upside, R1 (63.08%) and R2 (70.58%) are the key resistance zones to watch. A confirmed breakout above R1 could strengthen bullish momentum toward R2, while a breakdown below S1 may expose...
CTSI/USDT 4H chart Levels: • Resistance (R3): ~55.46% • Resistance (R2): ~8.76% • Resistance (R1): ~1.90% • Support (S1): ~-12.04% • Support (S2): ~-16.40% • Support Zone: extends toward ~-23.38% What the chart shows: 1. Price pumped hard to R3 (55.46%) but got rejected strongly. 2. Now it’s consolidating near R2 (8.76%), struggling to hold above it. 3. If it...
The chart highlights well-defined support and resistance levels. On the downside, S1 (0.001659) and S2 (0.001517) serve as near-term support zones where buyers may look to defend. Further downside risk could extend toward S3 (0.001350) and S4 (0.001092) if momentum weakens. On the upside, R1 (0.001994) and R2 (0.002219) act as resistance barriers, where selling...
On the 4-hour chart, key support and resistance zones have been plotted. S1 and S2 represent the downside levels where demand could emerge, offering potential rebound points. R1 and R2 indicate resistance barriers on the upside, where selling pressure or profit-taking may appear. Monitoring price action around these levels is crucial: a breakout above resistance...
On the 4-hour chart, key support and resistance levels have been identified. S1 and S2 mark the downside areas where buyers may step in, providing potential rebound zones. R1 and R2 highlight the upside resistance barriers, where sellers could apply pressure or profit-taking may occur. These zones will guide short-term trading decisions: a break above resistance...


