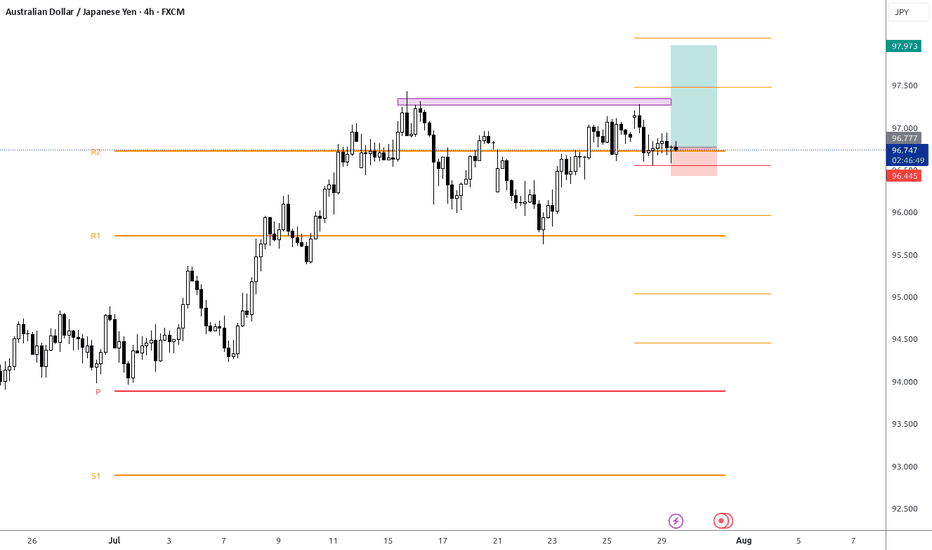
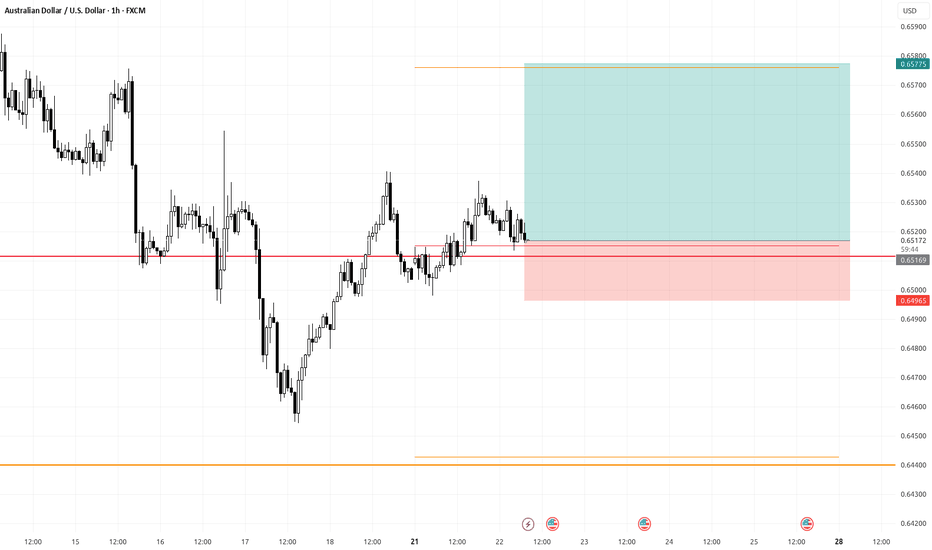
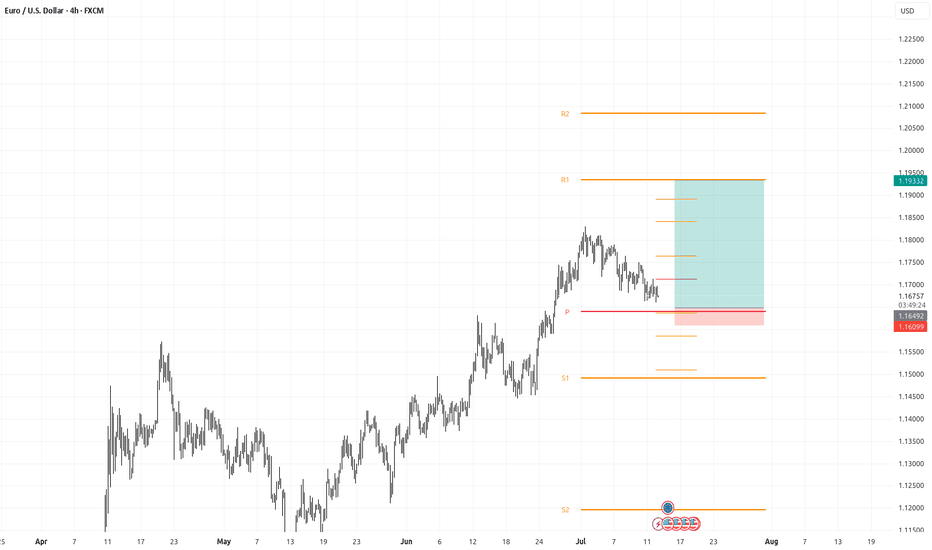
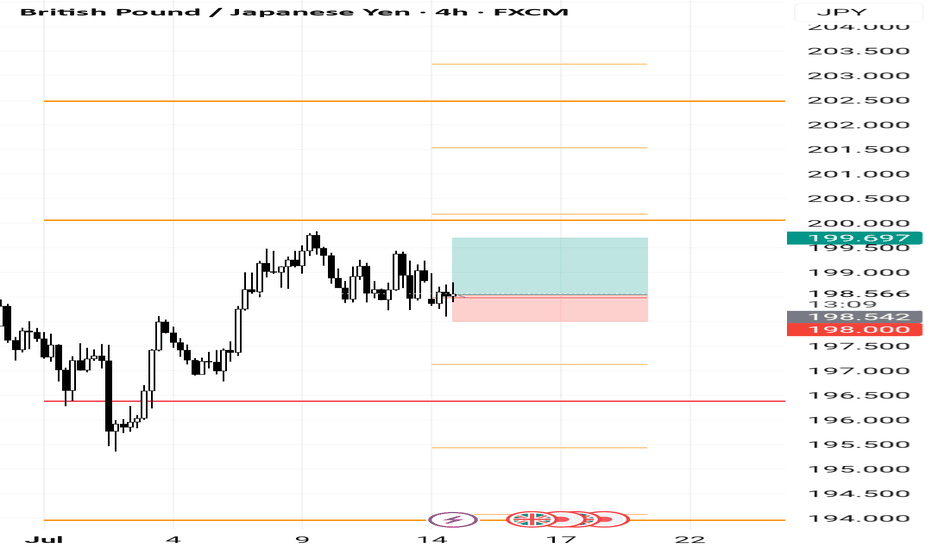
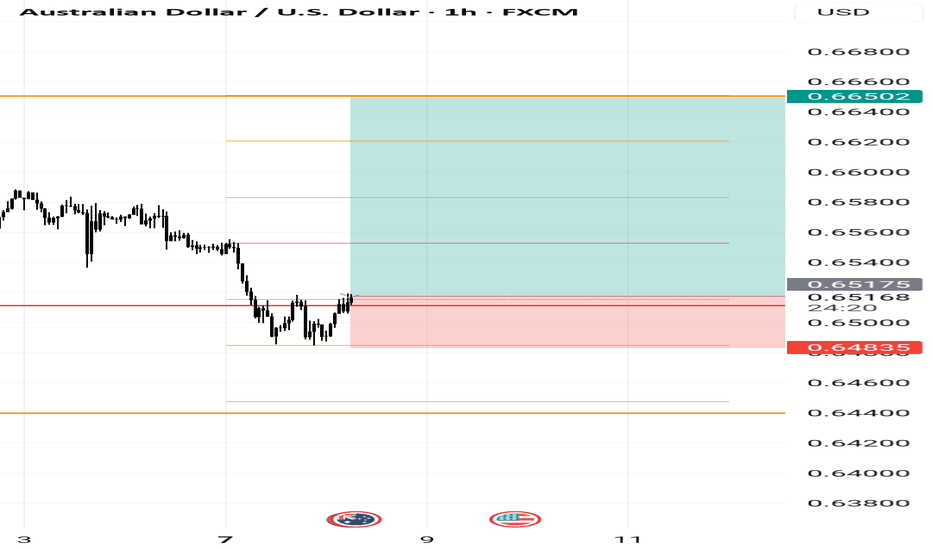
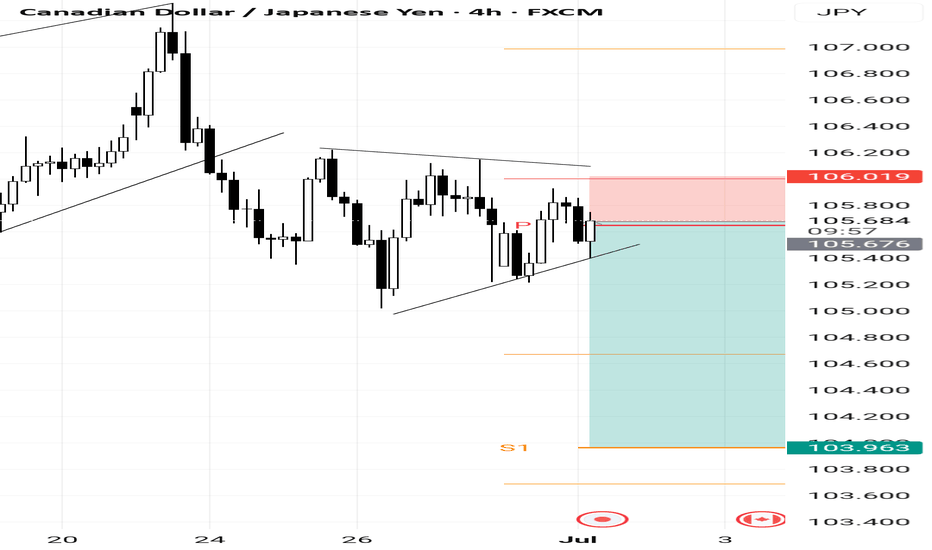
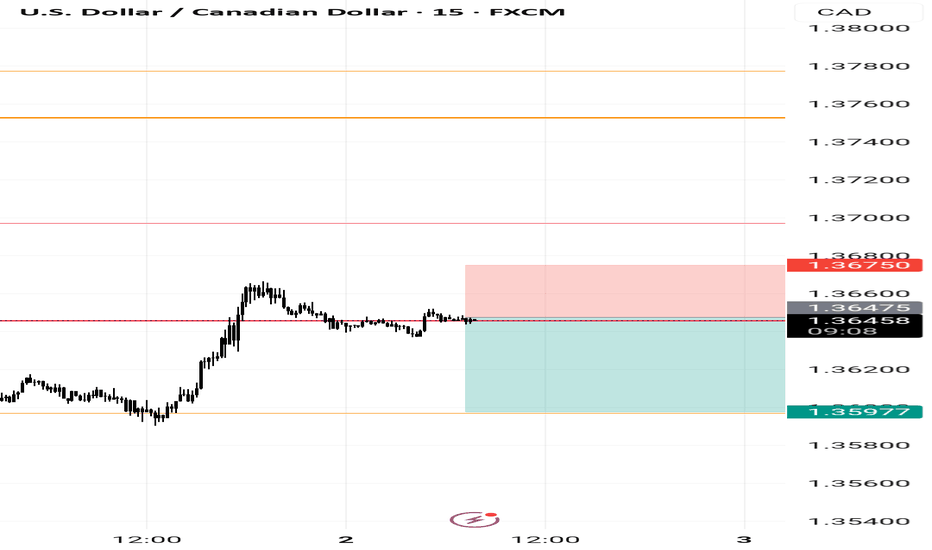
Got a rejection on the 4H bar from pivot lines seems like a good RR evev when its end of week and end of month
My trading stradegy is simple open trades on a Pivot lines (M / W) this pair had strong movement down and may contiue bit more my view
opned a few hourss ago looking valid for now small risk testing ppivot as support
on the 1D chart there is some uptrend on 1H and 4H chart price is testing the pivot line for support if the support will be strong anought could be good RR
on higher charts like 1D price seems in an uptrend so I would look to open a Long position price is now correction to Monthly pivot line which could be good RR
good RR buy from pivot pre NY open this is my trading strategy, trade on pivots point
I see a W on weekly pivot at the 1H chart price in 1D seems in up trend and RR is good. lets see
sell from pivot 4H after wedge and triangle with good RR seems like good opportunity but it's Monday morning and first day of new Month
good RR on Daily chart I saw down trend so I was looking for sell price now is retsting the pivot that was resistance, broke down and now may be support for continuing the down trend
Analysis of EUR/USD Bias: Bearish The EUR/USD pair is showing bearish momentum across multiple timeframes. On the 4-hour chart, we can see a clear rejection from the 1.1150 area, with price now trading around 1.0930. The recent price structure shows a lower high formation after a strong bearish move from the 1.1150 resistance zone. Market Structure: The 4-hour...
Analysis Bias: Bullish with caution Market Structure: The EUR/USD pair is currently trading at 1.0821, showing bullish price action in the most recent days after a period of decline. Looking at the 4-hour chart, we see a strong upward move in early March followed by a correction and consolidation phase. The price is now attempting to form higher lows after...
on 1H Chart price is testing the broken Support as Resistance could be nice RR
one of those trade where I should have put the SL as entry
Bias: Bearish Market Structure and Reasoning: The EUR/USD has been in an overall downtrend in recent days, forming successive lower highs and lower lows across multiple timeframes. The 4-hour chart shows a clear bearish momentum with price recently breaking below key support levels. On the 1-hour timeframe, we can observe a series of bearish candles with minimal...
Looking at the EUR/USD charts across the 15-minute, 1-hour, and 4-hour timeframes, here's my price action analysis: Bias: Bullish Market Structure Analysis: The 4-hour chart shows a clear bullish trend that began in late February, with EUR/USD making consistent higher lows and higher highs. After the strong rally from around 1.0400 to 1.0950, price has...
Bias: Bullish Market Structure Analysis: The GBP/JPY pair shows a strong bullish trend across all timeframes. On the 4-hour chart, price has established a series of higher lows and higher highs since late February. The recent price action shows a decisive breakout above the 194.00 resistance level, which is now likely to act as support. The 1-hour and...
Trade Bias: Bearish - but maybe only for next week... need to wait Looking at all three timeframes (15m, 1H, 4H), we can observe that while EUR/USD had a strong bullish trend from late February through early March, price action is now showing signs of exhaustion and a potential reversal. The recent price action shows a failure to maintain the highs above 1.0950...
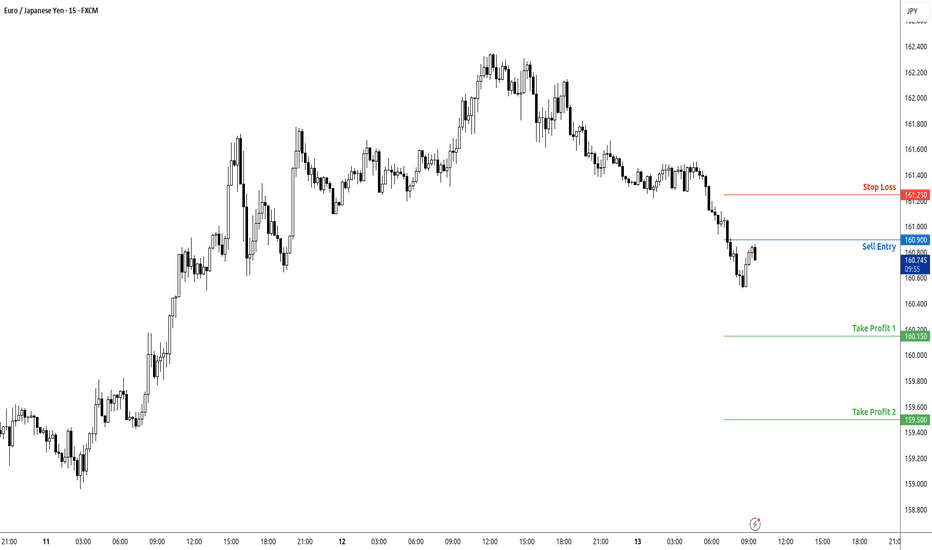
Trade Bias: Bearish The 4H chart shows a clear bearish trend with lower highs and lower lows since late February. The pair recently made a lower high around 162.400 and has been declining. The 1H chart confirms this bearish sentiment with price recently rejecting from the 161.000 resistance level. Entry Price: 160.900 Looking to enter on a pullback to the...


