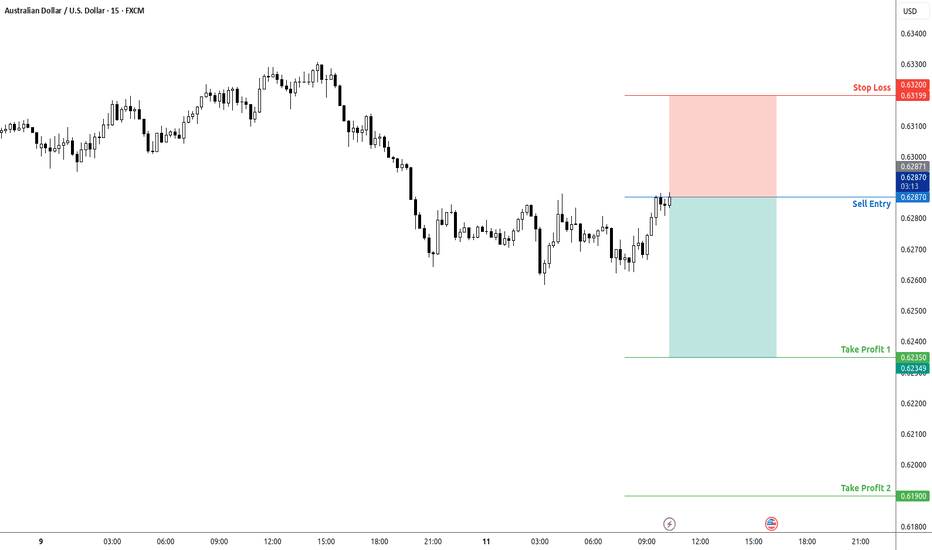
Trade Bias: Bearish Looking at all three timeframes, we're in a bearish cycle on the 4H chart after a recent rejection from the 0.6340-0.6360 resistance zone. On the 1H chart, we can see a recent pullback that may be losing momentum, setting up a potential continuation of the downtrend. Entry Price: 0.6287 Looking to enter short on the current pullback to the...
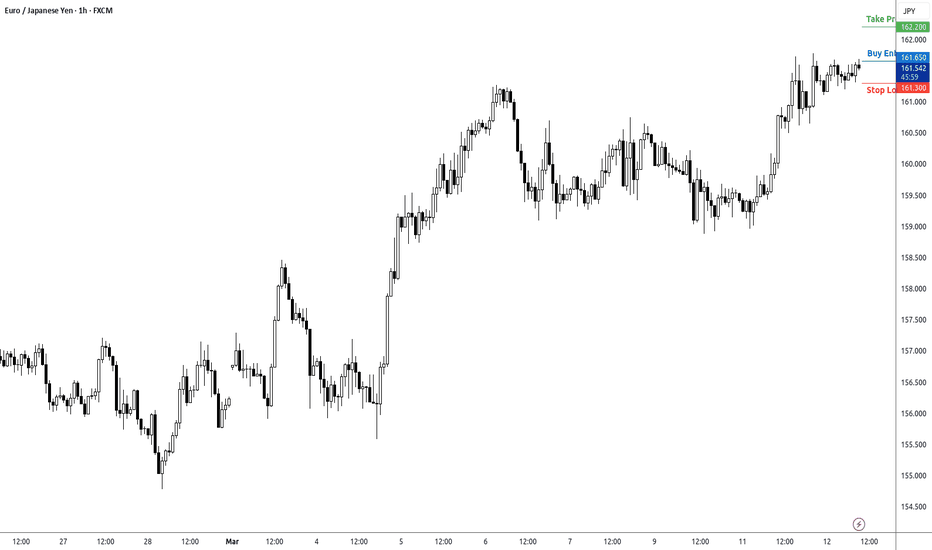
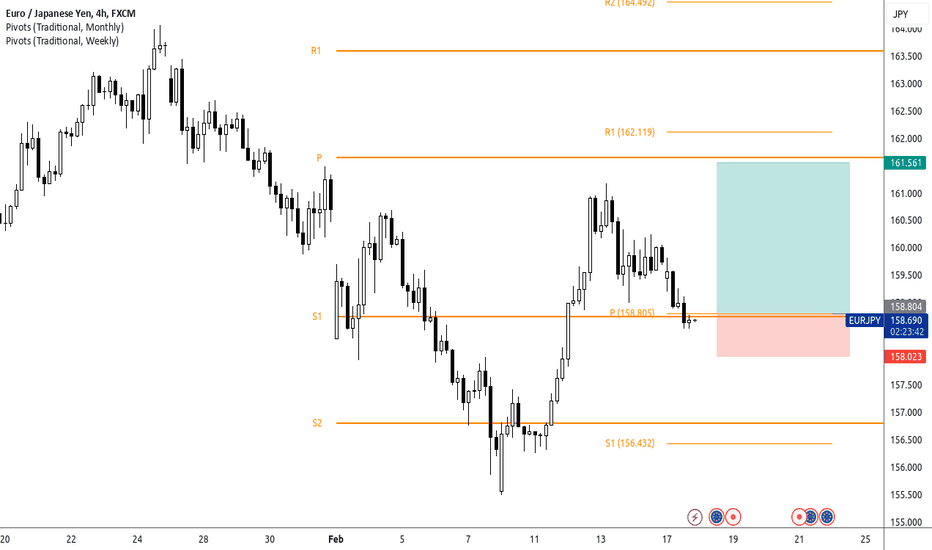
Looking at all three timeframes (15m, 1H, and 4H), I can provide a comprehensive analysis that aligns the shorter-term opportunity with the larger timeframe context. Multi-Timeframe Assessment 4H Analysis: Price is in a clear uptrend after establishing a significant bottom around 155.00 We've seen a strong recovery from recent lows to current 161.59...
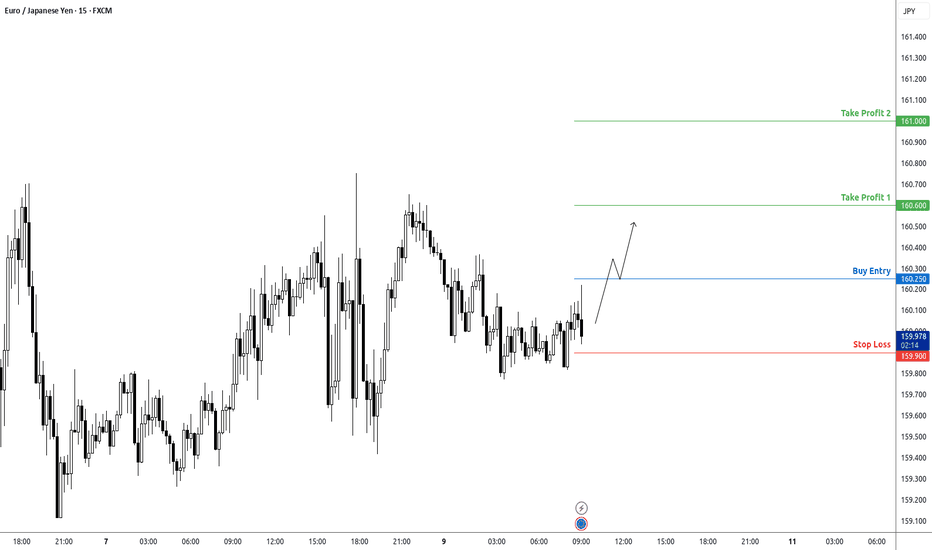
Waiting to see a break and retest of the entry price rather than placing a buy stop order. Here's the plan: Watch for price to break above 160.250 with a decisive candle (preferably closing above this level) Then wait for a pullback to retest this level as new support Enter long when price shows rejection from the retest level (with a small bullish candle or...
Just entered a bearish position on USD/CAD at 1.4350 with clear technical alignment. Price reached our sell zone after recent rejection from higher levels. Trade Details: Entry: 1.4350 (sell zone) Stop Loss: 1.4420 (above recent swing high) Take Profit 1: 1.4260 (previous support) Take Profit 2: 1.4150 (major support) Risk-Reward: 1:2 for first target, 1:3.5 for...
Looking at GBP/JPY 15-minute chart, we've identified a symmetrical triangle formation suggesting continuation of the recent bullish momentum. Trade Setup: BUY @ 191.80 (Triangle resistance breakout) SL: 191.50 (Below triangle support) TP1: 192.20 (Previous resistance) TP2: 192.50 (Key psychological level) Risk:Reward = 1:1.33 (TP1) and 1:2.33 (TP2) This setup...
Trade Setup: Symbol: USD/JPY Direction: LONG Entry: 149.95 Stop Loss: 149.65 Target 1: 150.40 Target 2: 150.80 Risk:Reward: 1:1.5 (primary) / 1:2.8 (extended) Analysis: USD/JPY is showing signs of bullish momentum after consolidating near the 149.80 level. Price action on multiple timeframes indicates a potential upside break. The recent higher lows on the...
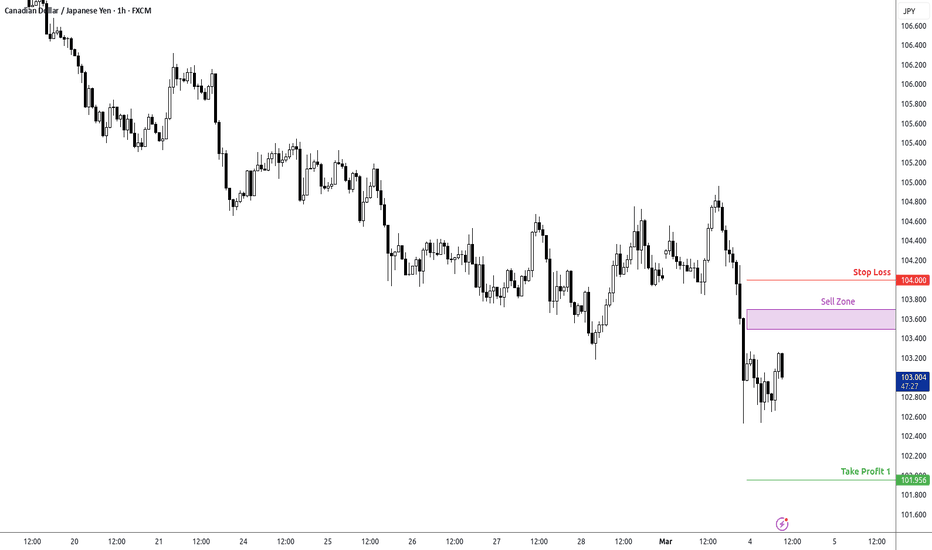
OANDA:CADJPY Analysis 4-Hour Chart Analysis The 4-hour chart shows CAD/JPY in a clear downtrend with lower highs and lower lows. Key observations: Price has been declining from around 110.500 to current levels around 103.079 Recently formed a potential double bottom around 102.500 level Currently showing some consolidation/minor bounce from these lows Price...
EUR/USD Short-Term Trade Setup Entry: 1.0491 (current price) Stop Loss: 1.0465 (below recent swing low) TP1: 1.0520 (previous resistance level) TP2: 1.0550 (extended target at next significant resistance) Current price action shows a bullish continuation pattern after a recovery from the March 1st drop. The 4H chart confirms an uptrend with higher lows forming...
Trade Setup for AUD/USD Trade Bias: Bearish with Caution The broader trend remains bearish based on the 4H chart showing a clear downtrend from late February. However, I notice potential bullish divergence forming as price makes a temporary bottom around 0.6155-0.6160. Entry Price: 0.6215 Looking at the current price (0.6156), I recommend waiting for a...
My view on Bitcoin price in the 15m there is an opportunity to buy some could be great
Trade Setup Trade Bias: Bearish (Price is making lower highs and lower lows, with recent rejection from a resistance zone.) Entry Price: 1.0380 (After a minor pullback to previous support turned resistance.) Stop Loss: 1.0430 (Above the recent swing high and key resistance.) Take Profit Levels: TP1: 1.0320 (Previous support zone.) ...
Trade Bias: Bearish The price action is forming lower highs and lower lows, indicating a downtrend. There is a recent rejection from the 190.000 - 190.500 resistance zone. Entry Price: 189.500 (Sell entry after a potential pullback to this resistance level) Stop Loss: 190.200 (Above recent highs and resistance, allowing for some...
1. Price Action Analysis (4H & 1H Timeframes) Market Structure & Trend The 4H chart shows a clear uptrend from mid-February, but recent price action indicates rejection from the highs (~1.2700) and a retracement towards lower levels. The 1H chart reveals a series of lower highs and lower lows, confirming short-term bearish momentum. The price is...
Trade Bias: Bearish The overall trend across all timeframes is clearly bearish. The daily chart shows a strong downtrend from previous highs of around 0.69, with price currently trading near 0.6203. The 4-hour and 1-hour charts confirm this bearish momentum, with the 1-hour chart showing a recent sharp decline without significant retracement. Entry Price:...
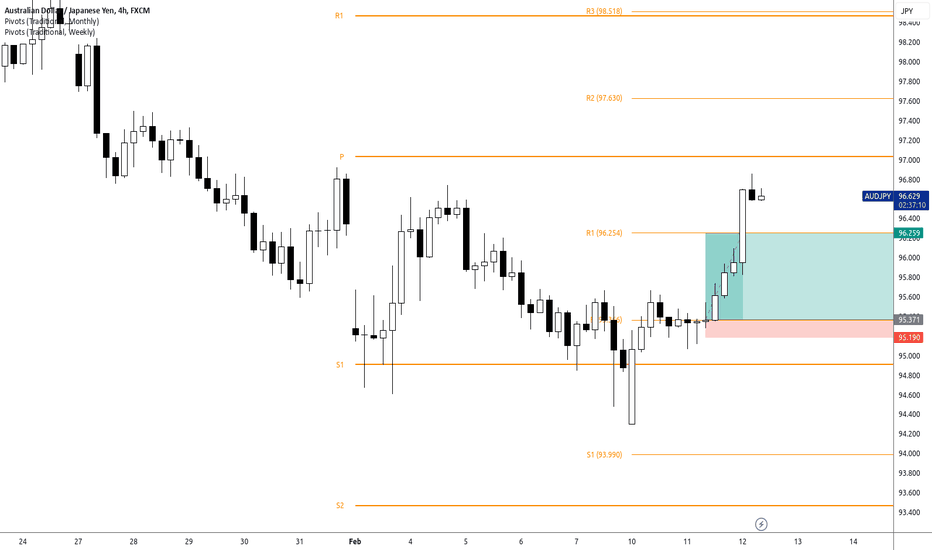
Need to wait and see how this last 4H bar will close and what will be the Price Action around the pivot line but maybe I will buy
Entry: Buy at Pivot Point (P) – 158.805 Stop Loss: Below support level S1 – 158.023 Take Profit: Near resistance level R1 – 161.561 Rationale: Price is currently testing the pivot level, a common area for a bounce. If the price holds above the pivot, it suggests bullish momentum. Aiming for the next resistance level (R1) as a profit target. ...
I missed the entry for this trade, but I like the analysis and setup. This trade aligns perfectly with my strategy—buying or selling from pivot lines (preferably monthly) with a 20-30 pip risk and an RR > 2. Even though I didn’t take this trade, I’m sharing it as an example of what to look for in the markets.
