SpartaBTC
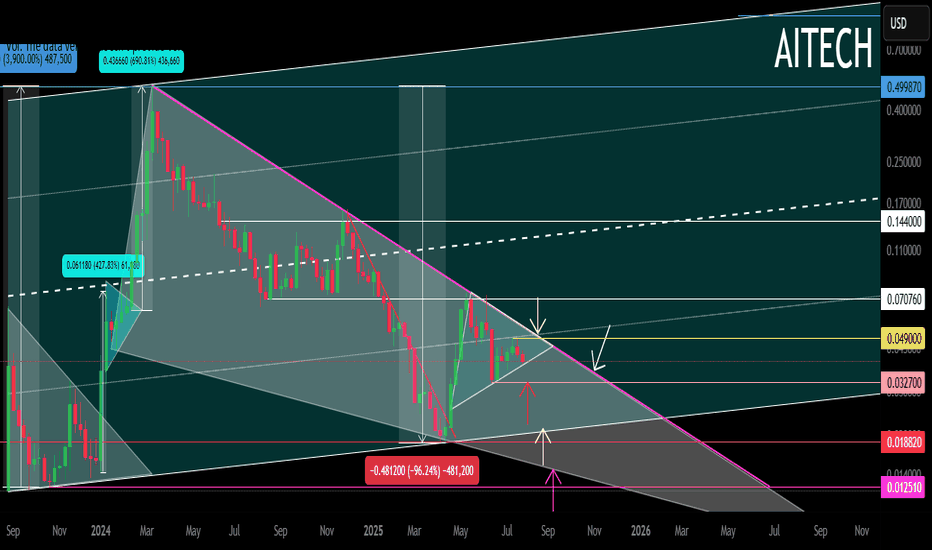
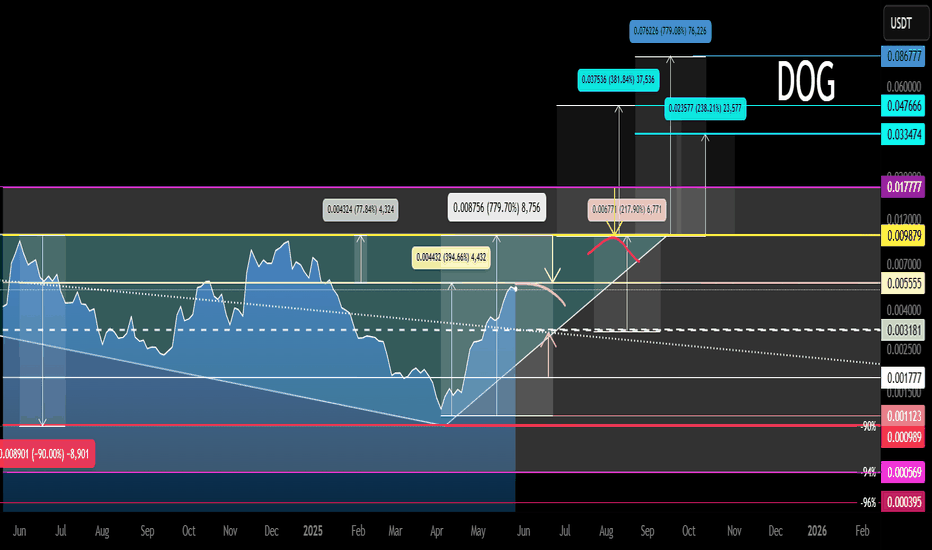
PremiumLogarithm. Time frame 1 week. Main trend. Huge pumps for hype. The price is driven up on dexes, and profits are realized on centralized medium and low liquid exchanges. Important. Twitter (X) of the project has 560 thousand subscribers. That is, at the right time there will be a flow of positive news for subscribers who are former holders, or potential buyers...
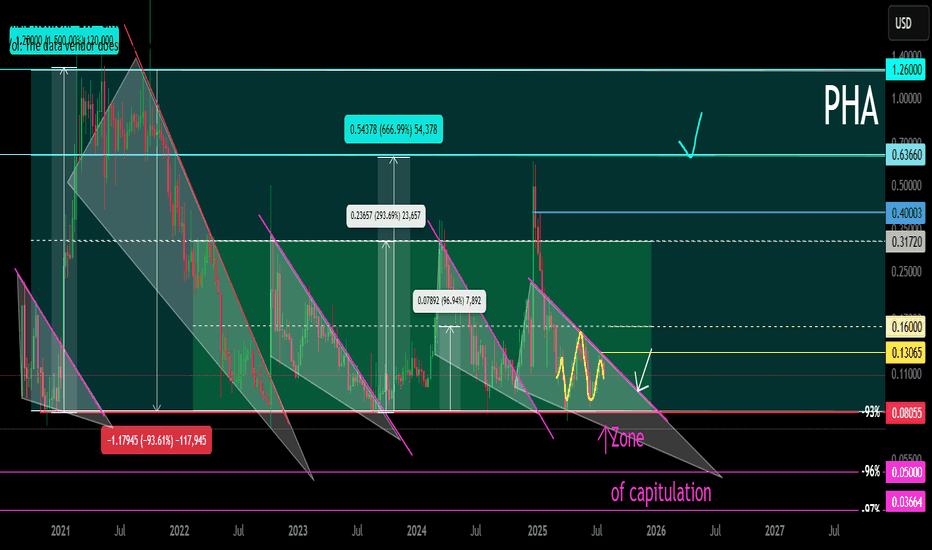
Cryptocurrency as an example. This applies to all similar assets by liquidity. Logarithm main trend. Time frame 1 week (smaller time frame, to understand the shown and described, is not necessary). Cryptocurrency is an imitation of utility with a good legend, which is traded on liquid exchanges (in the decline phase in the next cycle) most likely there will be...
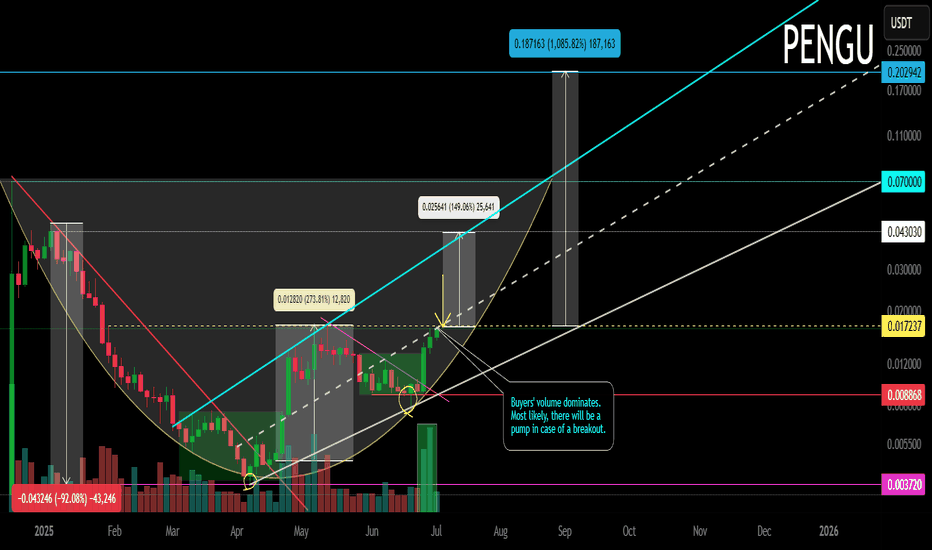
Logarithm. Main trend. Fresh cryptocurrency, which is being driven into hype. Locally now. Price at the median of the bowl. Buyer volume dominates. Most likely, there will be a large pump in case of a breakout. The chart is somewhat reminiscent of the Bitcoin chart, the reversal zones of this secondary trend, after the first local wave of growth. The first...
Logarithm. Time frame 1 week. At the moment, the currency is stronger than the dollar. The main trend is a descending channel. The price is in it now. Secondary trend — breakout of the descending trend line. Price growth to the median of the channel, and in case of its breakthrough, to the resistance. If not, then a pullback to the lower zone of the...
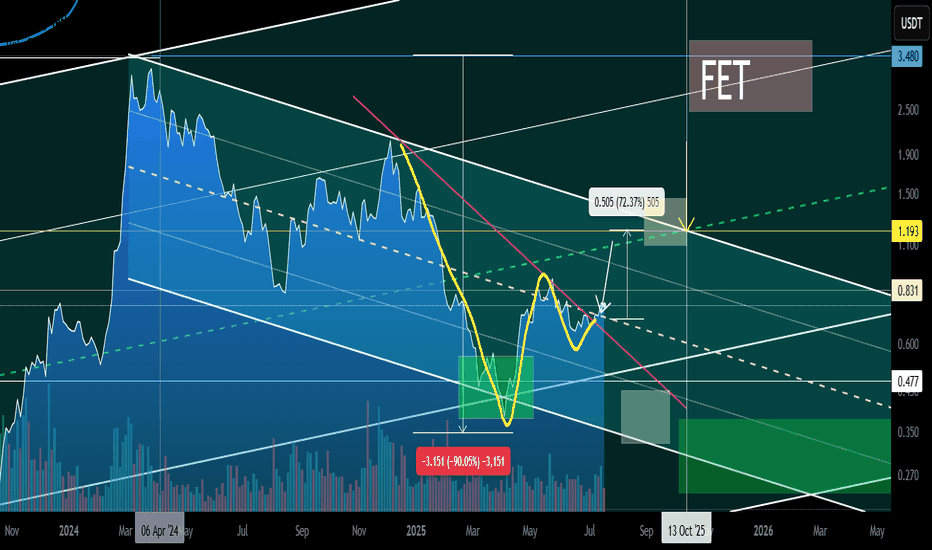
Logarithm. Time frame 1 week for clarity. Main trend is an ascending channel. Secondary trend is a descending channel Local trend is a Ross hook, at the median resistance. Reversal zone. By the way, the trading idea from 2022 FET/BTC is still relevant. Pay attention to where the price is. FET/BTC Main trend. Pump zone cycles . 2022 06
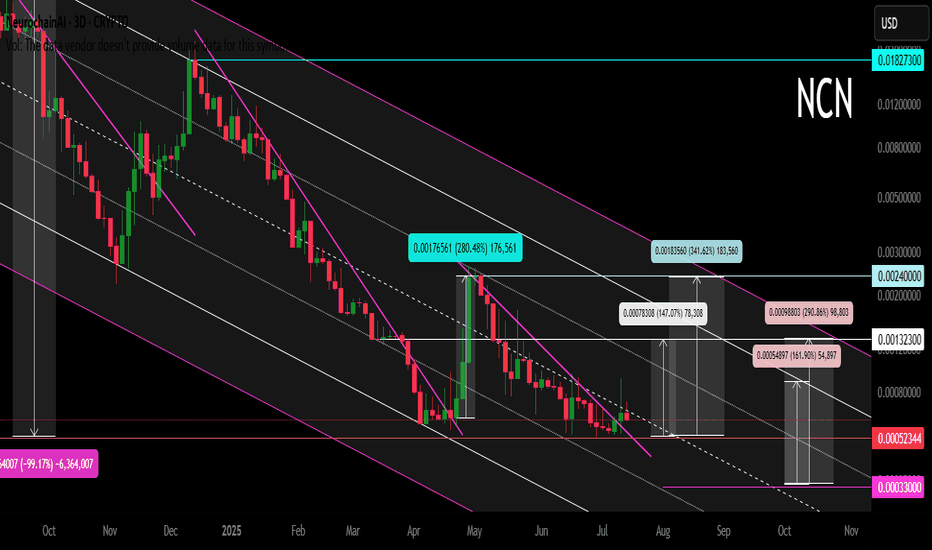
Logarithm. 3 days. Crypto project (imitation of utility) was made in autumn 2024 for local AI hype. Twitter 102 thousand subscribers. This is not enough... Reduction from the maximum pumping by -99%. It is rational to work according to the pump/dump strategy, in spot. If a local alt season is launched, then I would recommend locally - medium urgently working...
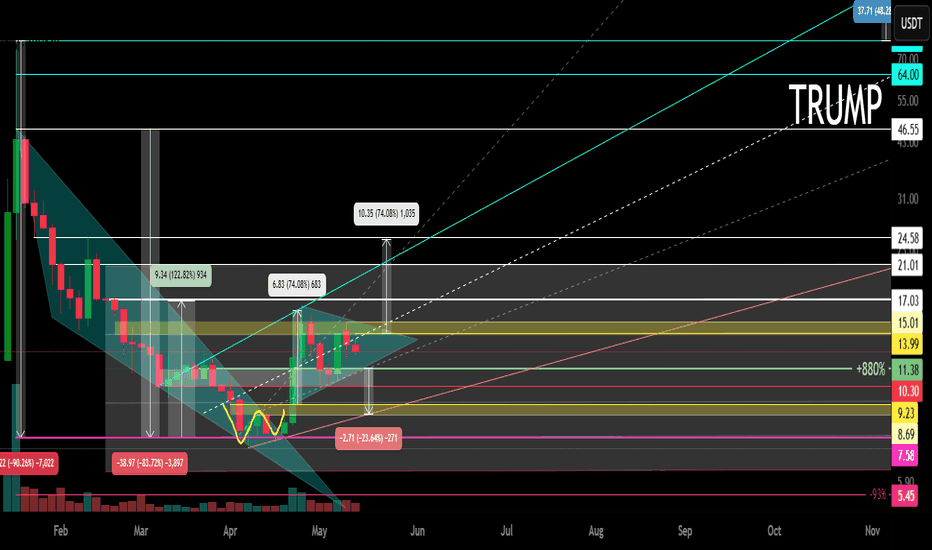
Logarithm. Time frame 3 days. After a super pump and a drive of "stupid money", a descending channel was formed on a natural dump. The price came out of it. Now a triangle is forming. The price is clamped. The reversal zones and percentages to the key support/resistance levels are shown extremely accurately according to TA. If there is no aggressive exit in the...
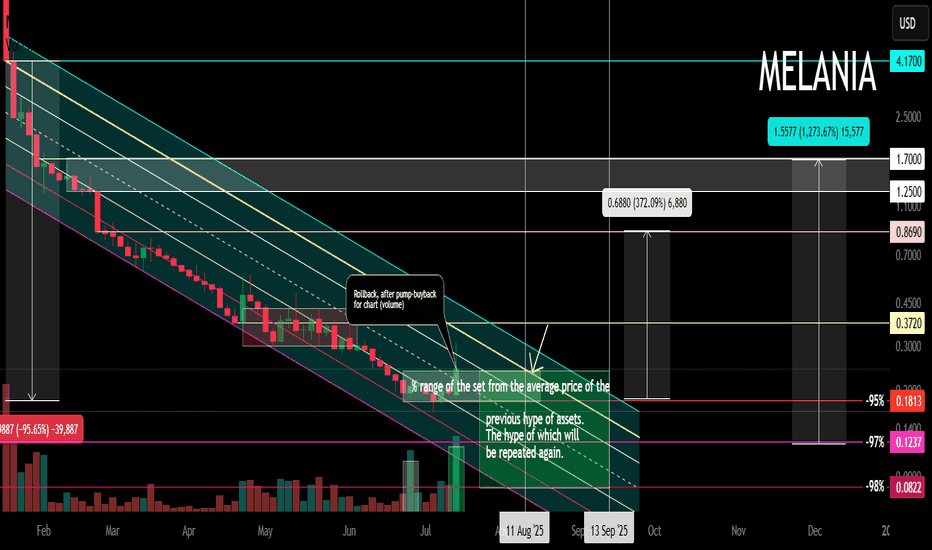
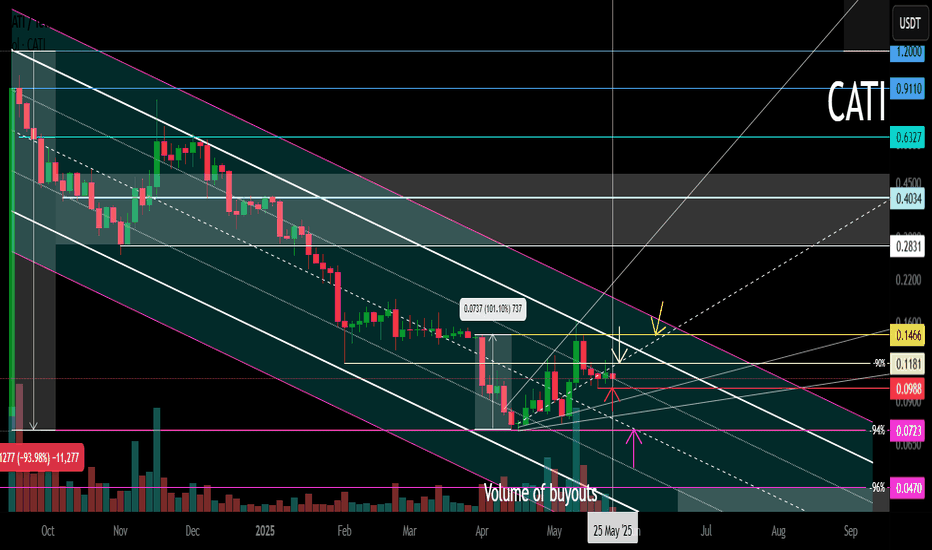
Main trend. Time frame 3 days (less is not necessary). Showed conditional levels (zones near them), and percentages of decrease from the maximum (note, I showed from the zone where the main retail of “affected investors” began to connect, that is, the maximum is much lower than on the chart). Note that now a conditionally large volume “enters”, it is displayed on...
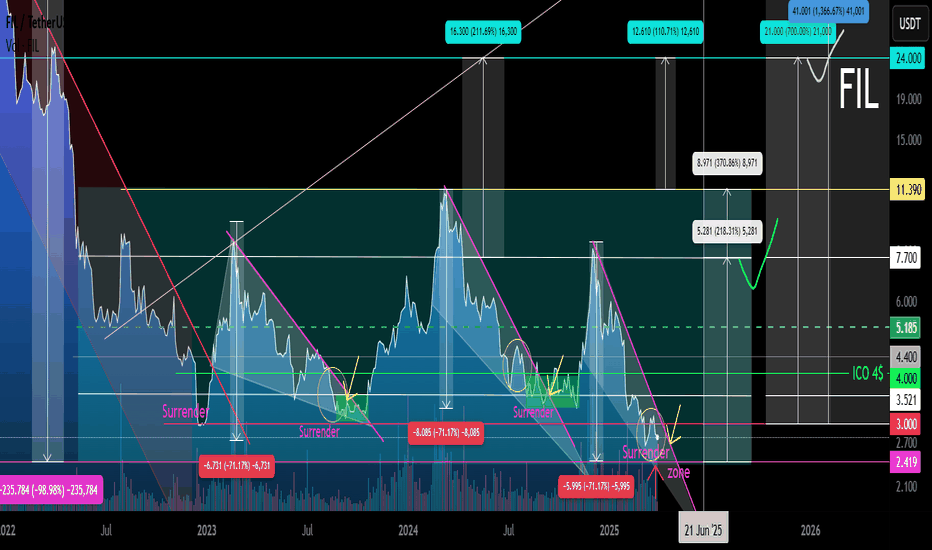
Logarithm. Time frame 3 days (less is not needed). Main trend. Time frame 1 week. Published more than 2 years ago 22 01 2023 FIL/USD Main trend. From the maximum of $237 -99% In the specified range, a horizontal channel with a large % step (exactly 370%) was formed earlier (2.590 - 7.157/10.7). There have already been 3 pumping waves in this channel. From...
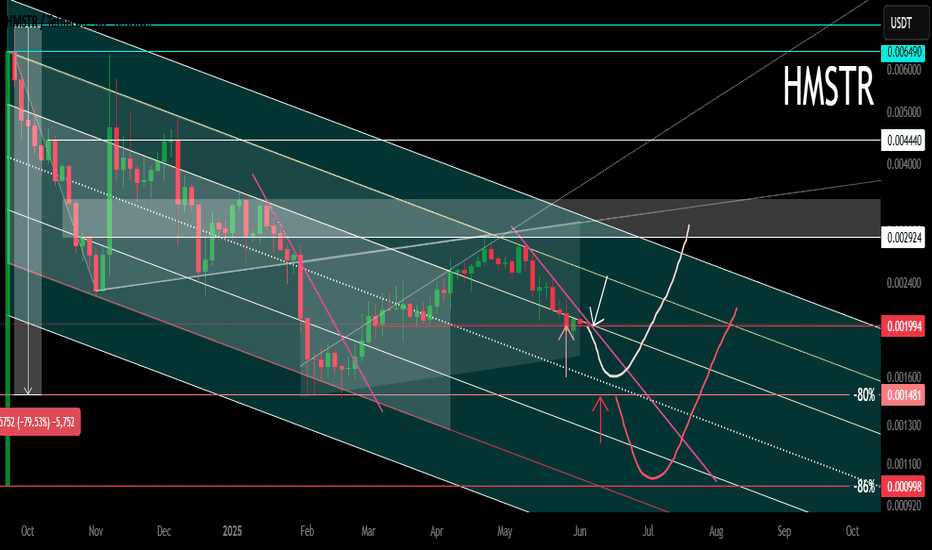
Logarithm. Time frame 3 days. Decline from the maximum -84% (this is not enough), but given the capitalization of 59th place, if the market is positive in the near future, then it is quite possible to reverse this cryptocurrency through a double bottom. All long-term consolidation above with high volatility is the distribution of ladies and gentlemen. Also study...
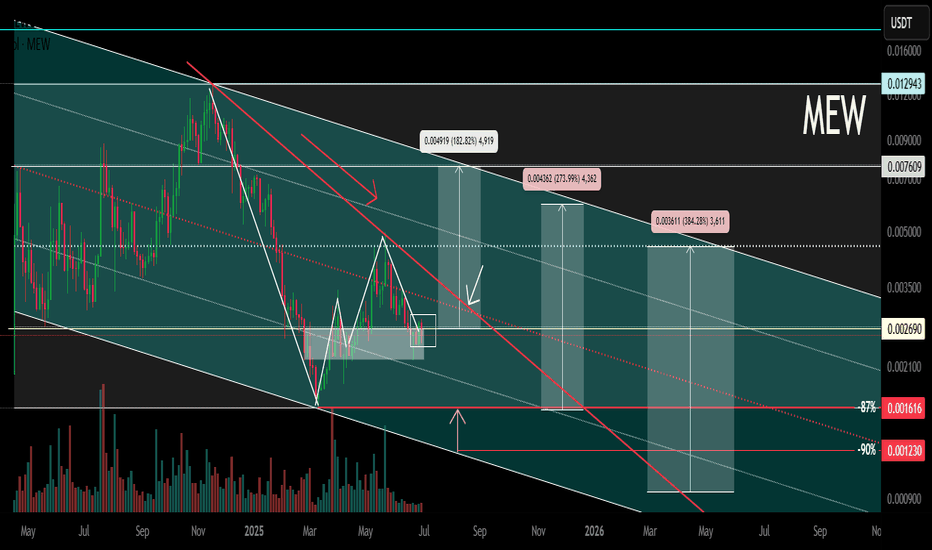
Logarithm. Time frame 3 days. Cat in a dogs world (MEW) X -133 thousand subscribers (this is not enough). Reduction from the maximum -87%. For such assets, this is not enough. I imposed a descending channel on the chart (current descending trend of the main trend), and a horizontal one, if by some miracle this local Ross hook is broken upwards (not forming a...
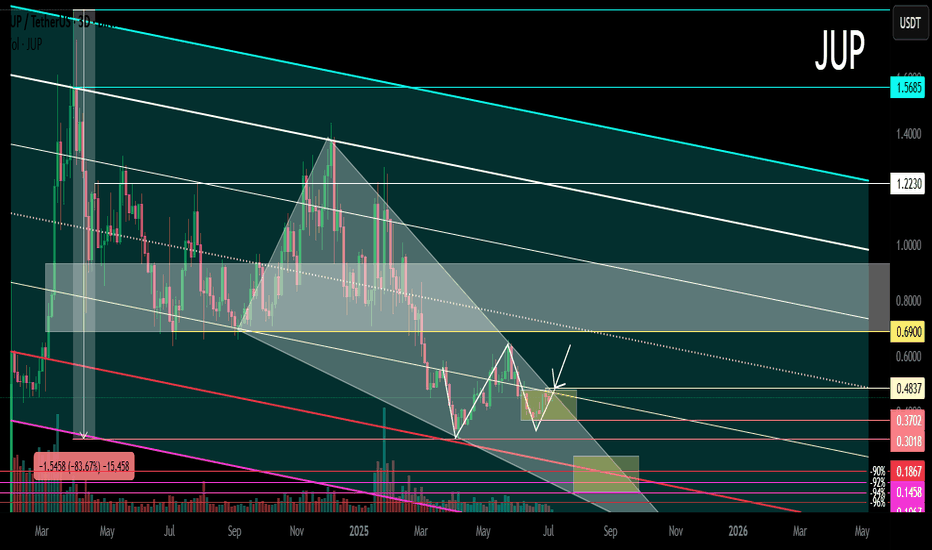
Logarithm. Term 3 days. Asset super hype in the past, listing with overly positive and aggressive marketing at 212X! 1️⃣Q1 2023 Private Seed $0.0185 / $1.85 million 2️⃣10 05 2023 Private Series A $0.13 / $6.01 million 3️⃣Q4 2023 Private Series A+ $0.25 / $8.75 million 4️⃣13 03 2024 Listing on the Binance exchange on the day of the secondary market trend...
Logarithm. Time frame 3 days. The main trend is a descending channel. Secondary is an ascending channel. Local trend is descending and a rollback from the key resistance. While the price is in a descending channel, it is rational to work and focus on dynamic trend supports/resistances, using this volatility. Locally, on a breakthrough of the designated trend...
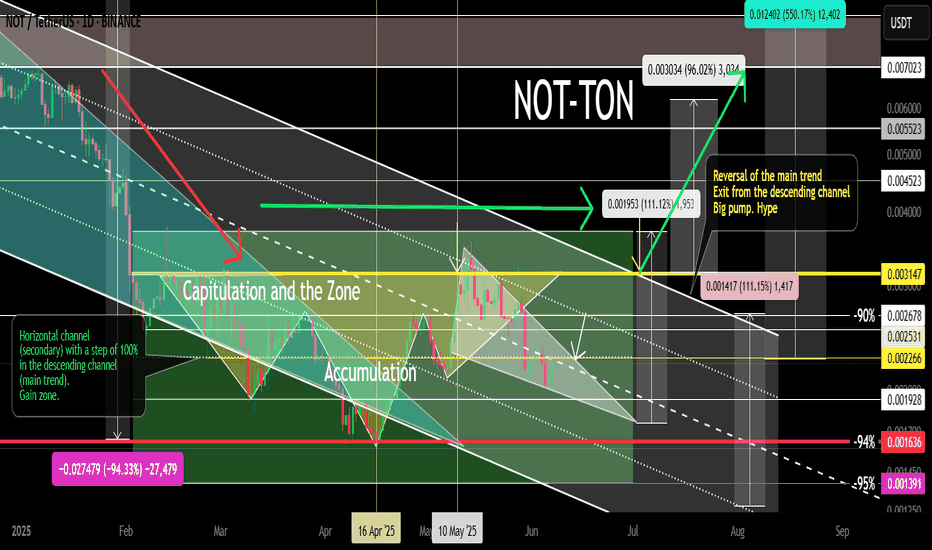
Local work ("market noise") is not a breakout of the inverted head and shoulders resistance zone (yellow reversal level). A rollback back to the horizontal channel formation zone with a 100% step. Everything is as before, nothing new can happen, for clarity, I showed the % to the key local support/resistance levels. NOT Main trend. Channel. 16 03 2025
Logarithm. Time frame 3 days. The chart shows key reversal zones in the horizontal channel, and when exiting it. For clarity, percentages are shown from the skin reversal zone. This is convenient for understanding the risk and potential profit in long and short work. You can also work in spot from long, from key zones (more relevant, as margin trading on assets of...
Logarithm. Time frame 3 days (less is not necessary). Decline from the maximum -94%. As a rule, altcoins (ticker name, legend, imitation of usefulness does not matter) of such liquidity decline in their secondary trend until its reversal by -95-98%. But, at the moment, there is a significant increase in volume, this is a good sign, if the price goes beyond the...
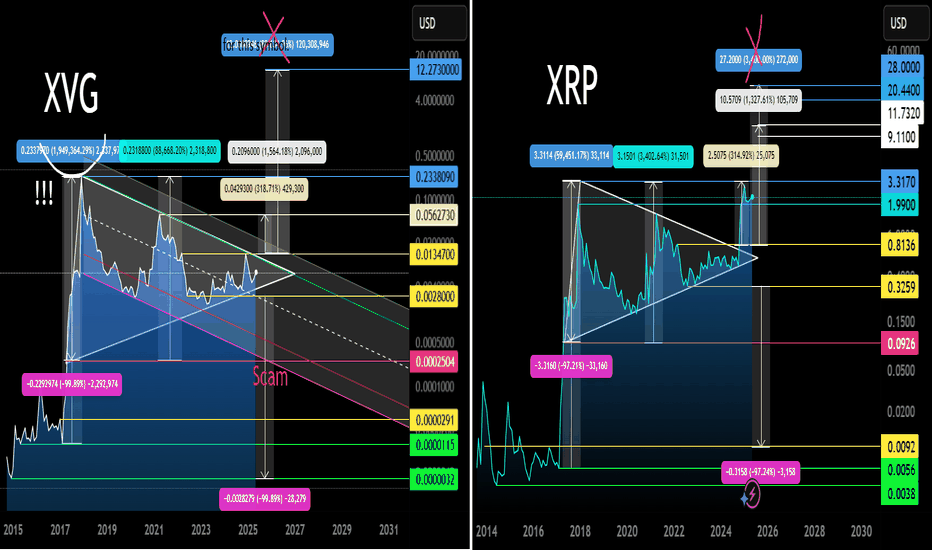
Logarithm. Time frame 1 month. Linear chart for clarity. Two cryptocurrencies of the super hype of altcoins in 2017 (the final alt season of the cycle before last). XRP is ahead of XVG. The structures are similar, but if XVG breaks through the triangle upwards like on XRP, then work with the first target, observing risk management. You can leave 5-10% of the...
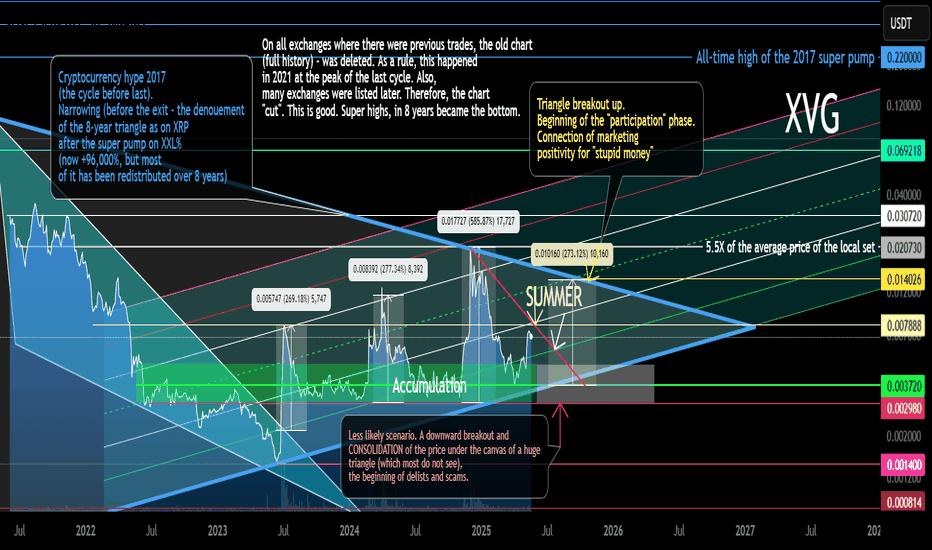
Logarithm. Time frame 3 days. Linear instead of candlestick specifically for clarity. This is the longest chart history on tradingview that could be found. It does not display everything as is. Where this cryptocurrency was previously traded, the exchanges deleted the entire trading history. Listing on new exchanges does not display the whole picture. I described...
