The-Trend-Mindset
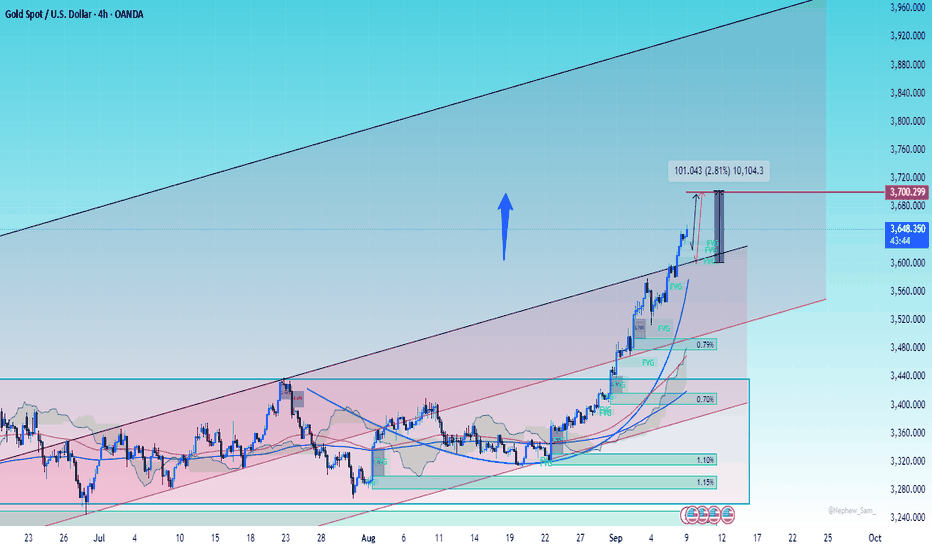
PremiumHere’s the simplified view for XAU/USD (Gold) 4H chart you shared: --- 📈 Best Buy Setup Entry: Above 3,675 – 3,680 (only if price breaks and closes above this resistance). Stop Loss (SL): Below 3,650. Take Profit (TP): TP1 → 3,700 TP2 → 3,720 – 3,730 ➡ Reason: Breakout continuation in the uptrend. --- 📉 Best Sell Setup Entry: If price rejects 3,675...
I see you are analyzing the GBPAUD (British Pound / Australian Dollar) chart on the daily timeframe (1D). Let’s break it down: --- 1. Chart Pattern (Structure) From your screenshot: Price is consolidating inside a range/rectangle (sideways market) between roughly 2.02 – 2.10. Currently, price is testing the lower range support around 2.05. If the range...
The price action shows: A parabolic uptrend inside a rising channel (or pitchfork structure). Recent breakout attempt toward the upper band. Fibonacci retracements drawn for pullback projections. This looks like a rising channel / ascending channel with parabolic acceleration. --- 🔹 Targets From your chart: Immediate target shown is around 3700 USD...
The chart shows a Bullish Ascending Channel. Price is making higher-highs and higher-lows, indicating continuation of the uptrend. --- 🎯 Targets TP1: 114,500 – 115,000 TP2: 117,000 – 117,500 (major resistance zone) --- 🛑 Stoploss Near stoploss: 110,800 – 111,000 (below trendline) Safe stoploss: 109,500 --- 📌 Support & Resistance Support: 111,000 –...


