TradeTechanalysis
PremiumAdaptive Liquidity Pulse 🎯 Spot Liquidity-Driven Reversals & Market Traps The Adaptive Liquidity Pulse is designed to help traders detect high-volume rejections and absorptions, revealing where big players are likely defending or accumulating positions. This indicator is especially useful for spotting market traps, liquidity sweeps, and swing reversals. ⸻ ...
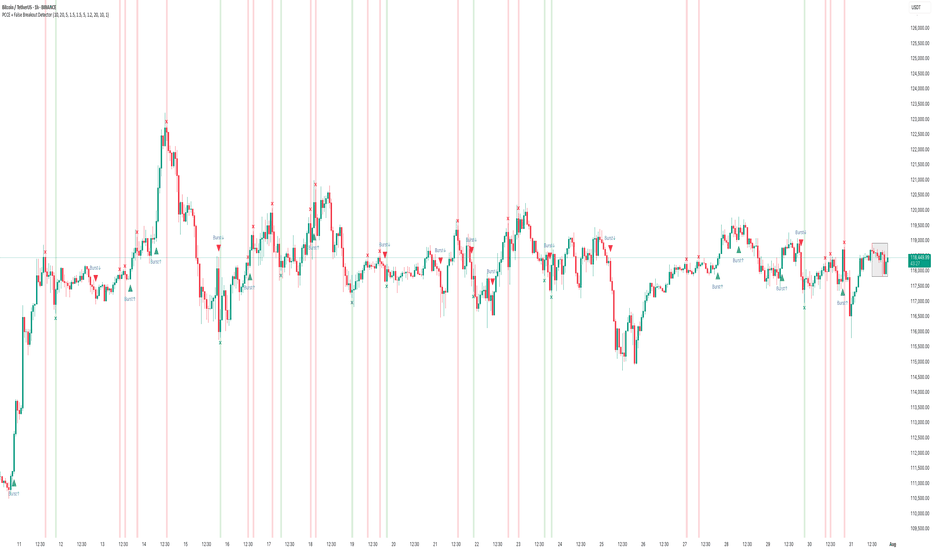
How to Use the PCCE + False Breakout Detector to Catch Trap Zones in BTC Chart: BTC/USDT (1H) Tool Used: PCCE + False Breakout Detector Type: Educational – How to identify false breakouts and anticipate trend shifts. ⸻ 🧠 What the Indicator Does: The PCCE + False Breakout Detector is designed to identify breakouts from coiling ranges and filter out trap...
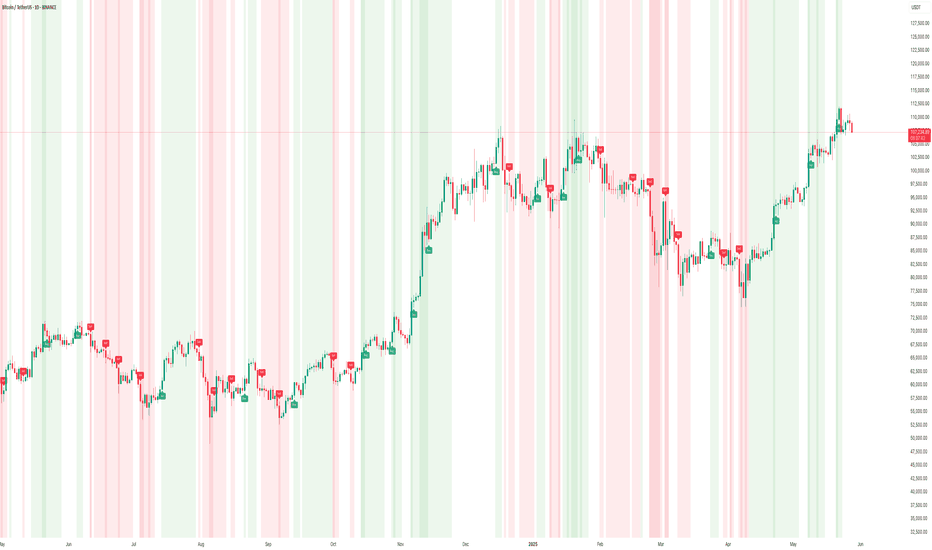
How to Use the Sentiment Cycle Indicator to Detect Trend Shifts in BTC Chart: BTC/USDT (1D) Tool Used: Sentiment Cycle Indicator Type: Educational – How to interpret sentiment shifts and time corrections. ⸻ 🟢 What the Indicator Does: The Sentiment Cycle Indicator is designed to help identify emotional cycles in price movements by mapping bullish...
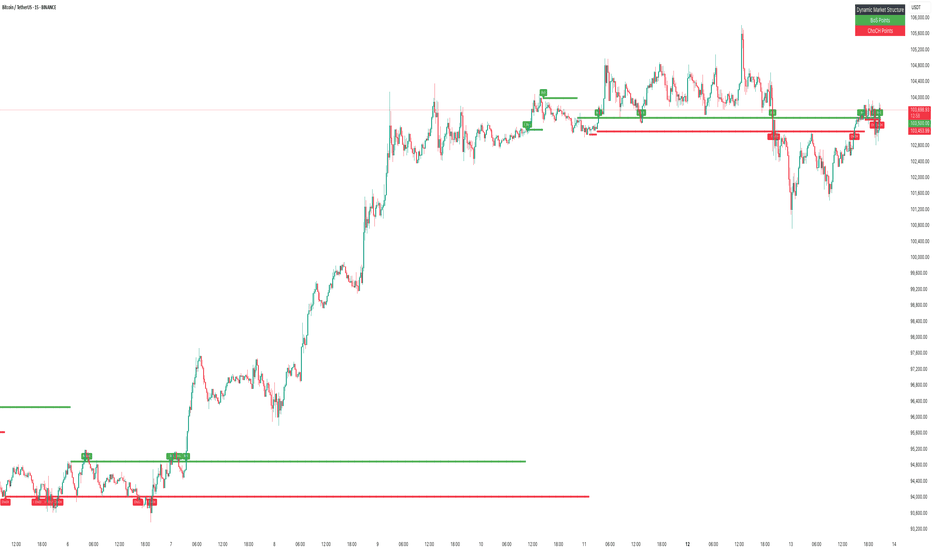
🔍 Idea Overview This chart demonstrates the effectiveness of the Dynamic Market Structure Indicator in live conditions, capturing key Break of Structure (BoS) and Change of Character (ChoCH) points. Each zone dynamically adapts based on price behavior and helps identify crucial turning points. 📌 Highlights from the Chart • ✅ Early BoS detection led to...
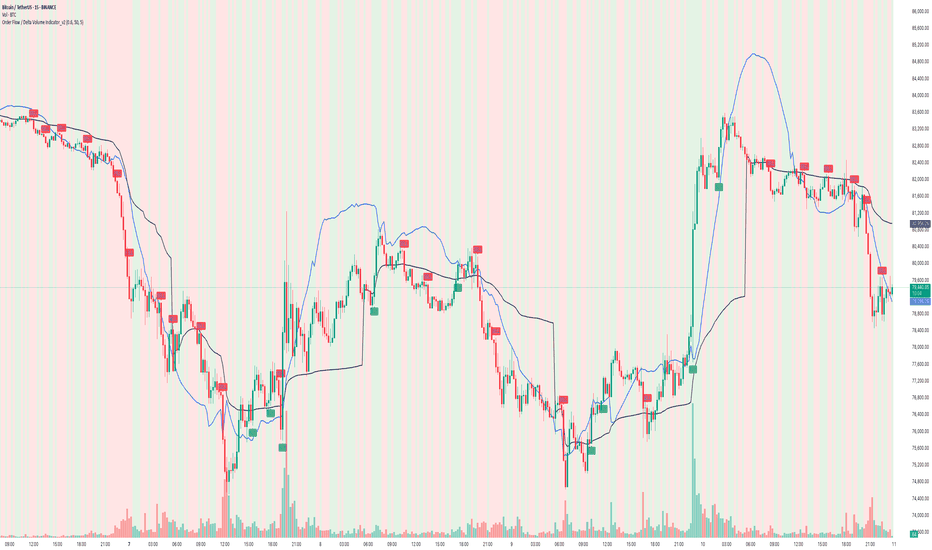
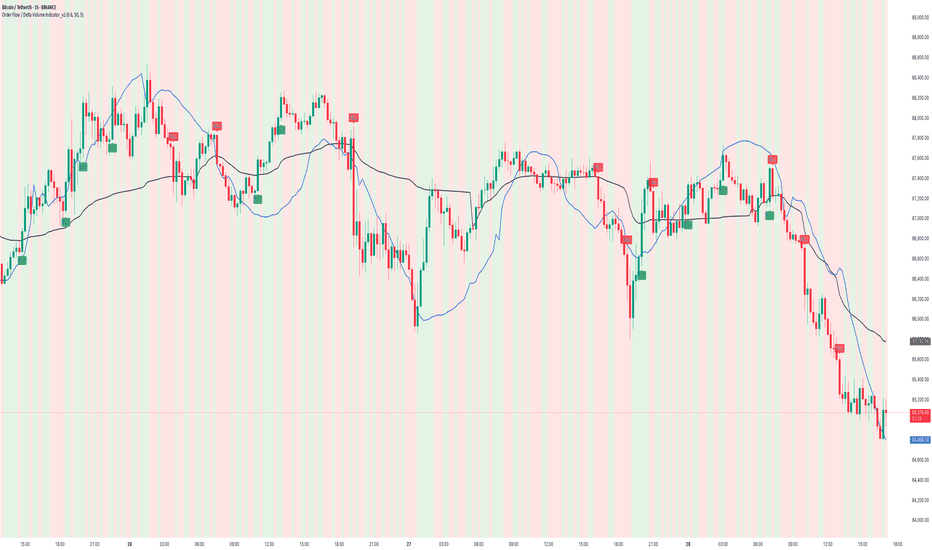
Order Flow / Delta Volume Indicator: Performance & Trap Identification Analysis ### Overview The Order Flow / Delta Volume Indicator analyzes real-time buying and selling imbalances , accurately capturing momentum shifts and highlighting potential market traps . This analysis clearly demonstrates the indicator’s effectiveness in pinpointing trend reversals,...
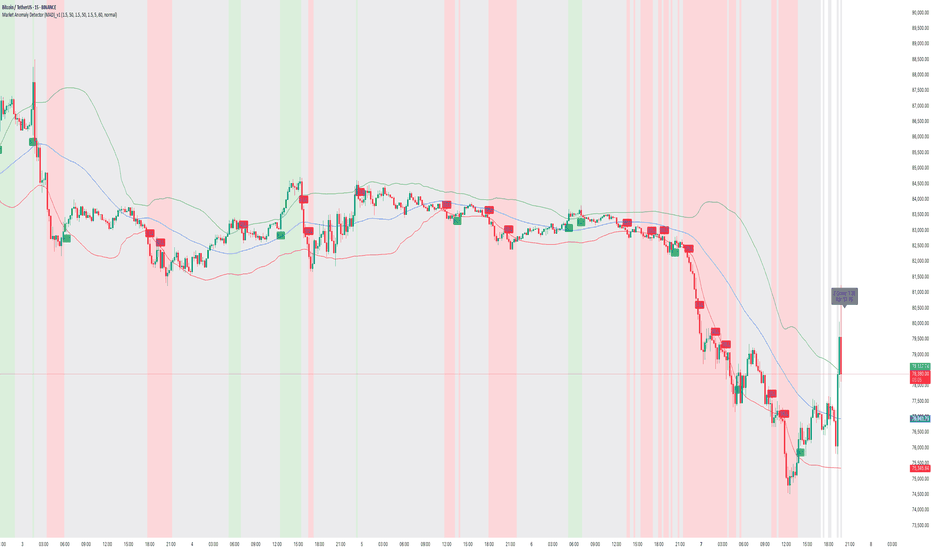
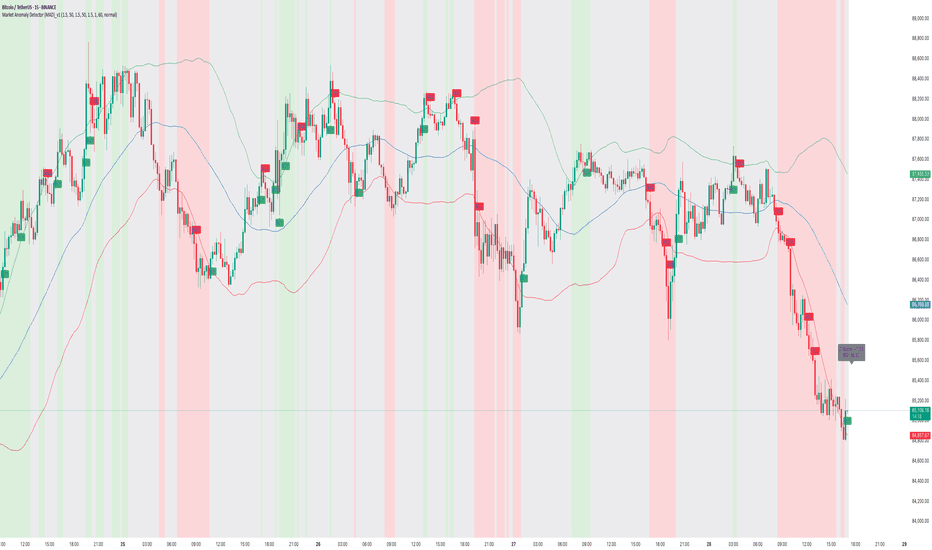
Market Anomaly Detector (MAD): Real-Time Performance Analysis Overview The Market Anomaly Detector (MAD) Indicator efficiently identifies market momentum shifts and volatility breakouts, clearly marking bullish and bearish opportunities . This real-time chart demonstrates the practical efficacy of MAD in capturing timely market entries and exits. ...
Overview The Order Flow / Delta Volume Indicator combines order flow dynamics with delta volume analysis , pinpointing market shifts by tracking buying and selling pressure . This chart analysis demonstrates how effectively the indicator identifies precise moments of market turns and shifts in momentum. How It Works Order Flow Dynamics Tracks...
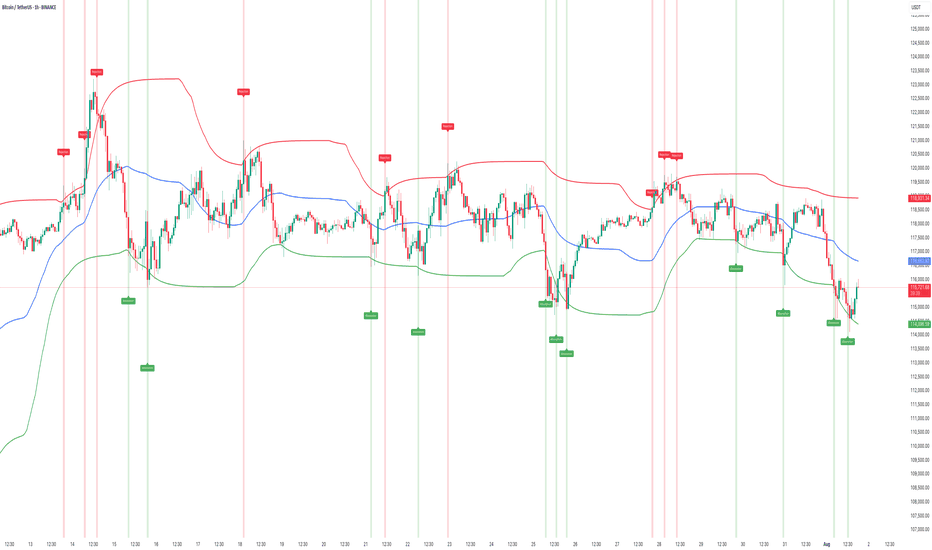
Overview The Market Anomaly Detector (MAD) Indicator effectively captures market reversals , trend shifts , and volatility cycles through its distinctive visual components—the Mainline ( blue ), Upper Band ( green ), and Lower Band ( red ). This idea explores the practical performance of the MAD indicator, emphasizing its clear signals during recent...
Overview The Market Anomaly Detector (MAD) Indicator is designed to capture market reversals, trend shifts, and volatility cycles using a combination of its Mainline (blue), Upper Band (green), and Lower Band (red) . This idea explores how the indicator performed in real market conditions, highlighting how price interactions with these bands provided...
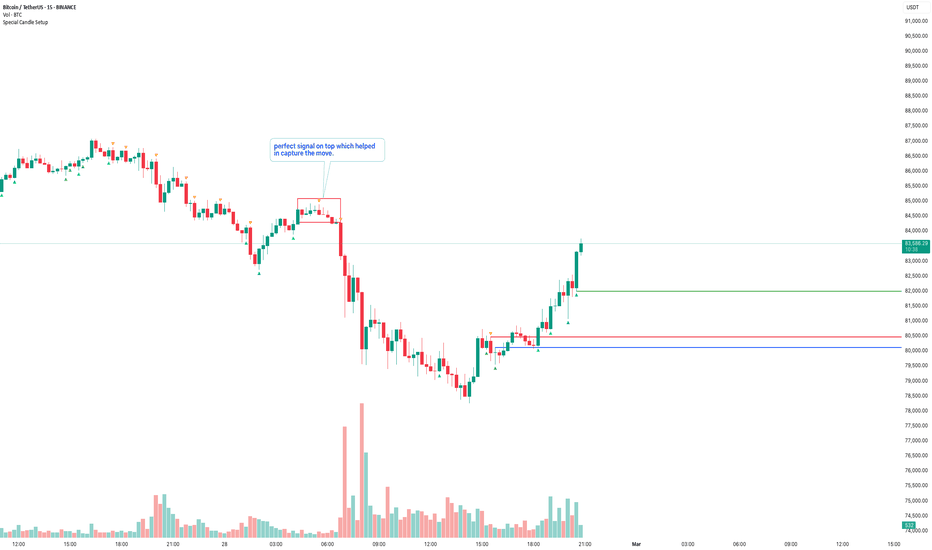
Overview The Special Candle Setup Indicator has once again proven its effectiveness in detecting high-probability candlestick formations. In this chart, a bearish pattern was identified at the top, providing an early indication of a potential downside move. This setup allowed traders to position themselves accordingly, capturing the downward trend...
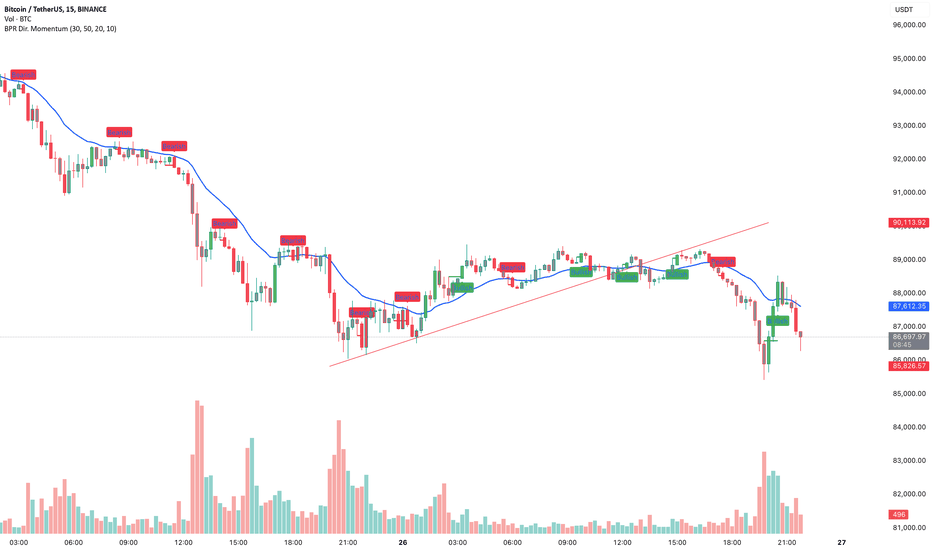
The BPR with Directional Momentum-Filtered Breakouts indicator identifies breakout opportunities by filtering momentum shifts and trend strength. The script integrates Balance Price Range (BPR) with an EMA-based trend filter and a cooldown mechanism to refine signal accuracy. Performance Analysis 📉 Bearish Signals Effectiveness • The indicator...
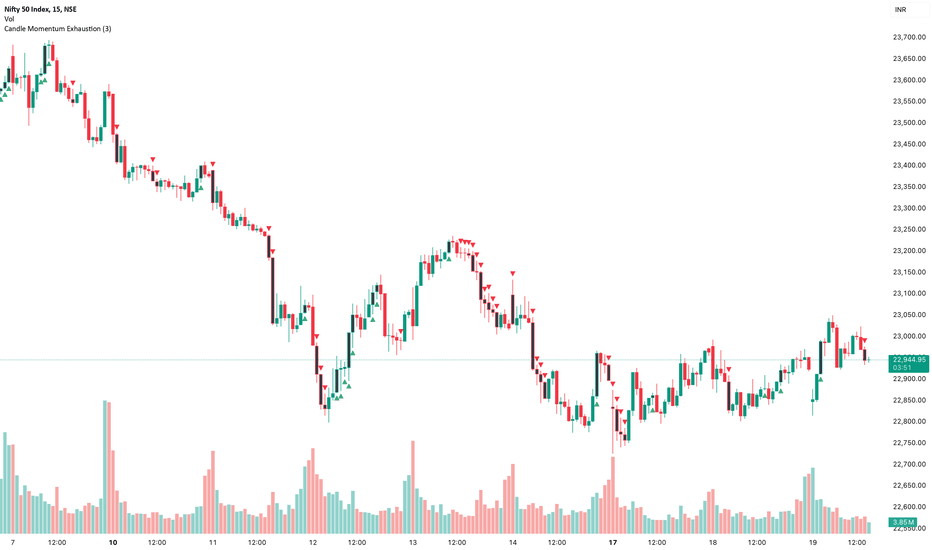
🚀 Candle Momentum Exhaustion Indicator – Spotting Market Reversals Like a Pro! 🔥 Live in Action! Our Candle Momentum Exhaustion Indicator is pr oving its strength in identifying key exhaustion points in the market. Using a black candle fill to highlight exhaustion areas, the indicator successfully detects when momentum weakens, signaling potential reversals...
Find out the video to know how price reacted and how we predicted the level and at last there is an amazing setup which works 100% in trending market either upside or downside.
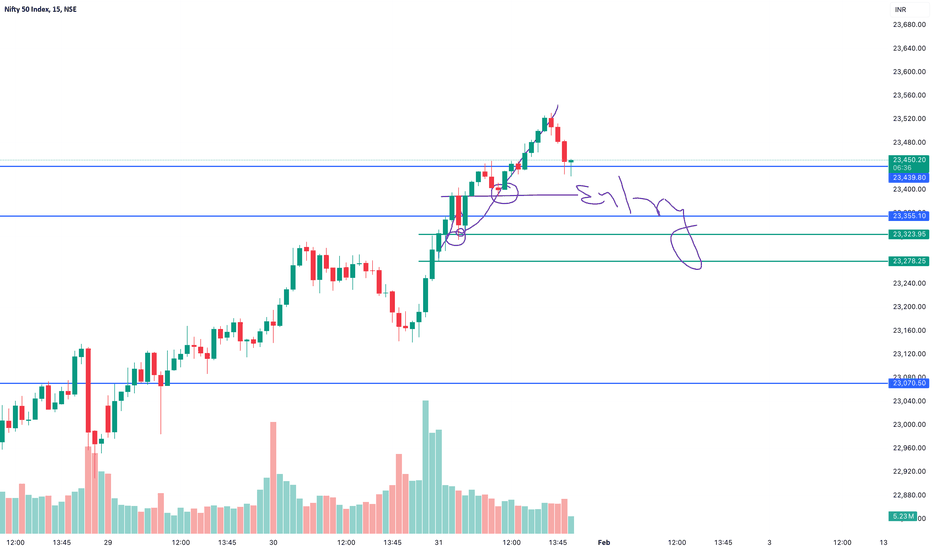
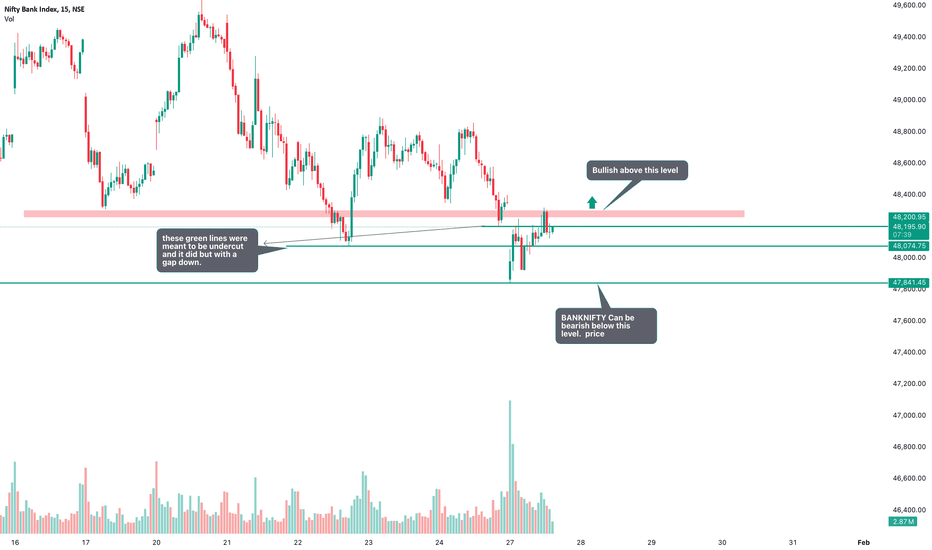
I mentioned the significance of the green lines visible on the chart, which represent key levels. Specifically, I highlighted yesterday’s low and explained that if the price breaks below this level, it could undercut the previous support at 48,074. As we can see, both levels were breached with a gap down. However, the price has been recovering since then and...
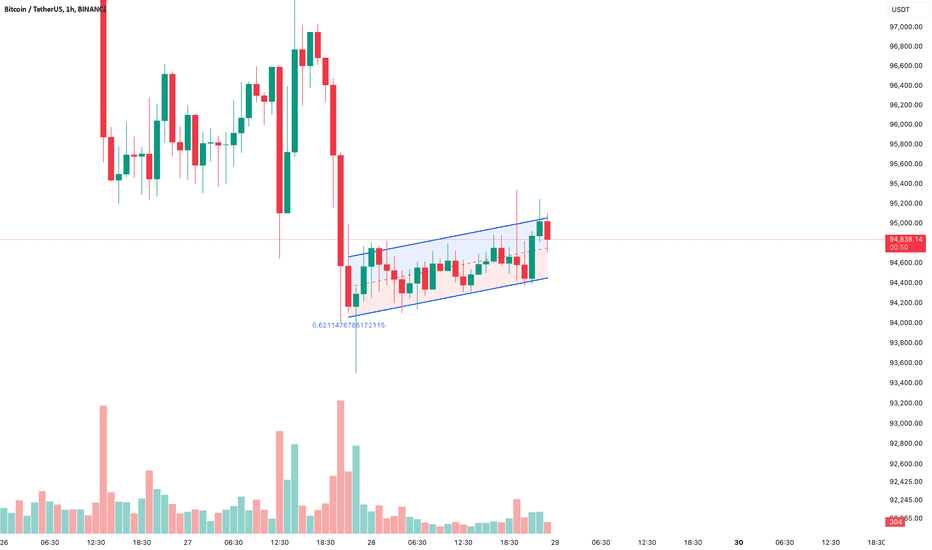
Look at the 1H chart and i see bearish flag and pole pattern... what you think?
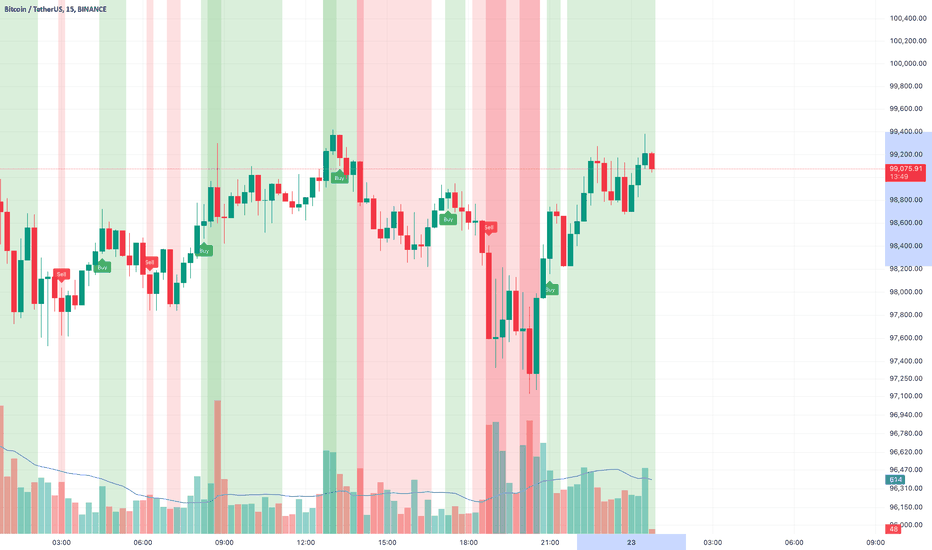
Here is the live performance result of sentiment indicator.. it was able to capture 1300 points in short side and now 800+ on buy side and its still on..
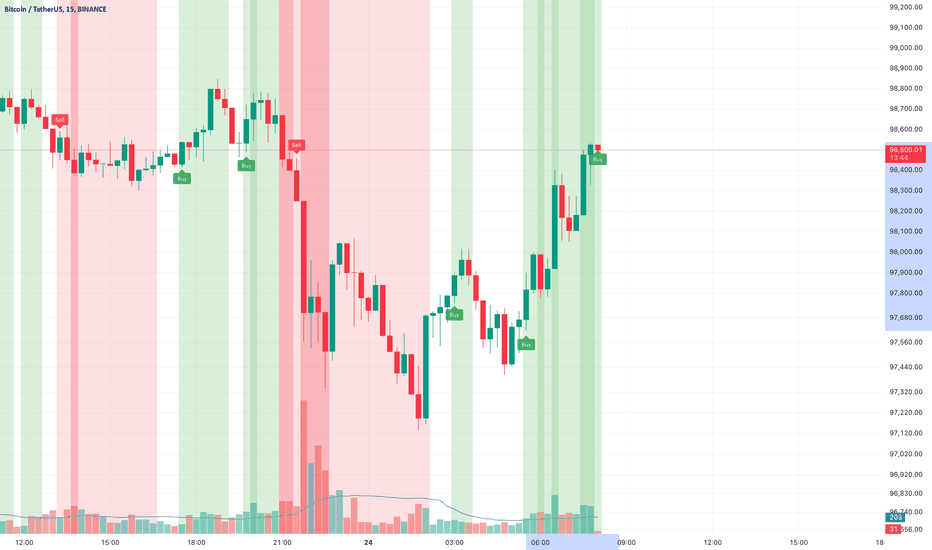
Indicator didn't both for 203 red candles and it was still thinking that it can be bullish and here is the result.. that was well captured in live.. Real power of the indicator.. this was just an example. it has done tremendous job many times.
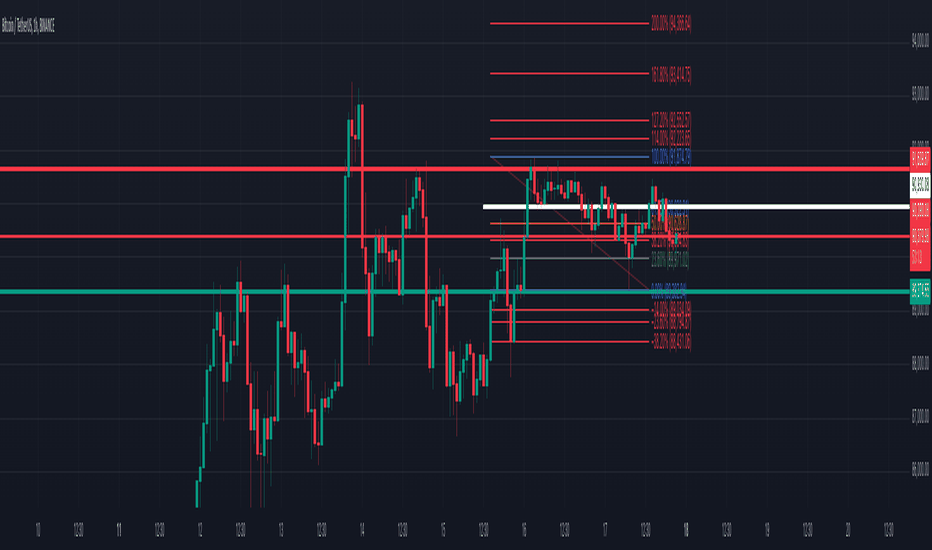
If BTC manages to close above 90930 on 1h chart then it can become bullish again.. It is Bullish in long term. see Fic levels for support and resistance levels.. along with other strong support levels.. Sat/Sun usually no volume so it remains sidways or trapping day. lets what happens tomorrow..
