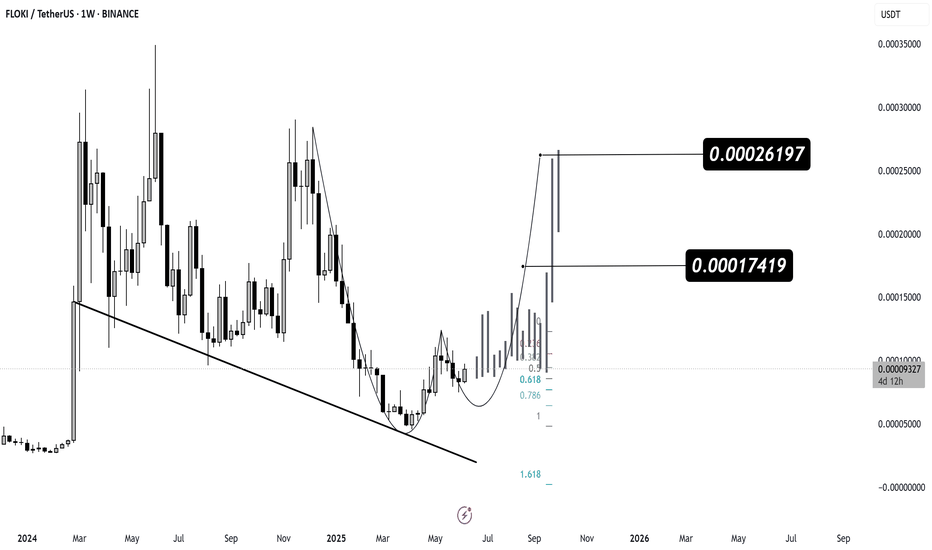
🔍 Key Technical Overview: FLOKI has recently broken above a long-term descending trendline, signaling a potential major reversal. The price is forming a rounded bottom pattern, indicating accumulation and a potential bullish breakout. 📈 Bullish Price Targets: First Target: 0.00017419 USDT ↳ Based on prior structure and Fibonacci 1.0 projection. Second...
🔍 Current Price Action: Current Price: 0.19892 USDT The price is reacting positively from a key support zone (highlighted with circles), indicating a strong bounce and potential for upward continuation. 📈 Target Resistance Levels: 0.20302 USDT – First short-term resistance, may be tested soon. 0.23355 USDT – Intermediate resistance; a key breakout...
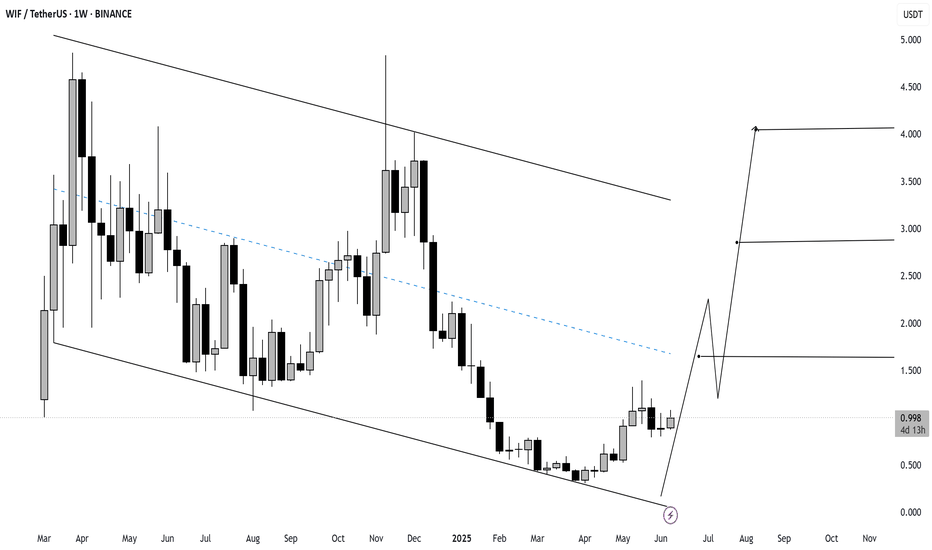
The chart for WIF (Dogwifhat) on the weekly timeframe shows a bullish breakout setup emerging from a long-term descending channel. Price has bounced off the lower boundary and is now pushing higher. 🔍 Key Technical Highlights: Current Price: $0.996 Structure: Descending channel (breakout in progress) Momentum: Weekly candle closed +12.04%, indicating...
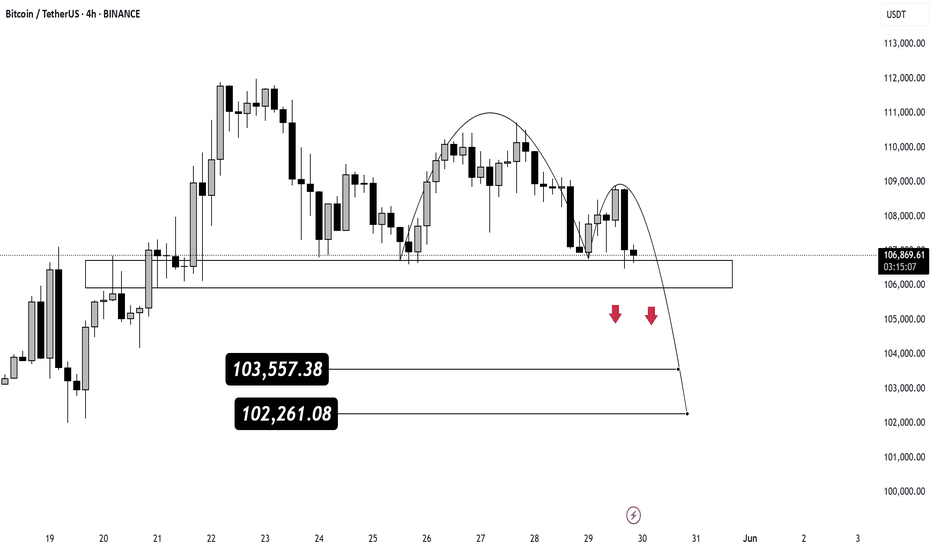
Bitcoin is forming a classic Head & Shoulders pattern on the 4H chart — a sign of potential bearish reversal. Price is currently testing the neckline support zone around $106,800. 🔴 A breakdown below this level could trigger a move toward the next support zones: 📉 Target 1: $103,557 📉 Target 2: $102,261 ⚠️ Keep an eye on how BTC reacts around the neckline. A...
Bitcoin is consolidating inside a bullish channel, retesting previous breakout zone after a falling wedge breakout. Price is holding above the 0.5 Fib retracement — momentum still favors bulls. 📌 Key Support: $107K–$108K 📈 Targets: 🎯 Target 1: $114,445 🎯 Target 2: $116,840 Any strong bounce from lower trendline could trigger the next leg up. Watch for...
$AIXBT is shaping a bullish cup pattern and is now approaching key resistance. A breakout and hold above this level could trigger strong upside continuation. 📍 Breakout Zone: ~$0.24–$0.25 📈 Bullish Targets: 🎯 Target 1: $0.3123 🎯 Target 2: $0.3553 Watch for volume confirmation and daily close above resistance to confirm momentum.
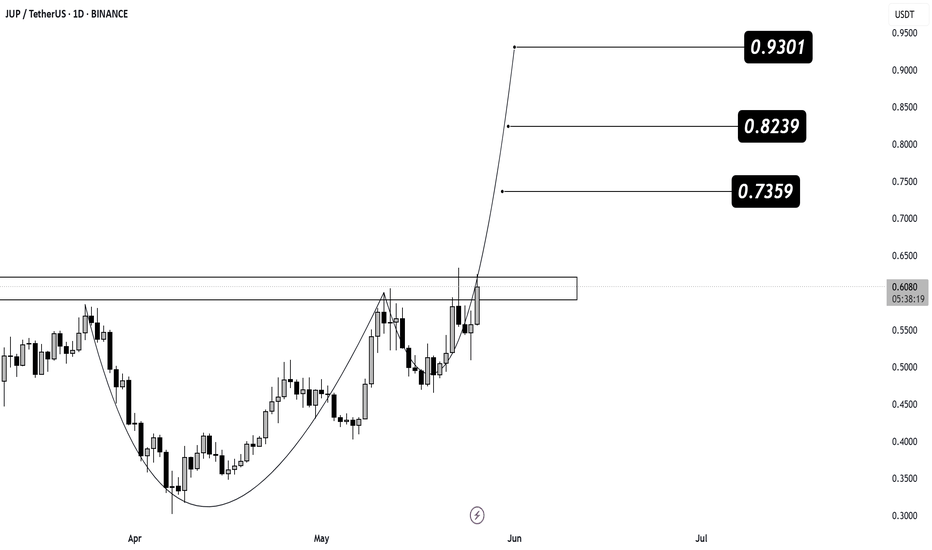
LSE:JUP is completing a cup formation and is now testing a key resistance zone. A strong breakout above this level could spark the next leg up. 📍 Breakout Zone: ~$0.60 📈 Targets on Breakout: 🎯 Target 1: $0.7359 🎯 Target 2: $0.8239 🎯 Target 3: $0.9301 Watch for a daily close above the resistance zone to confirm bullish momentum. Volume increase will be key.
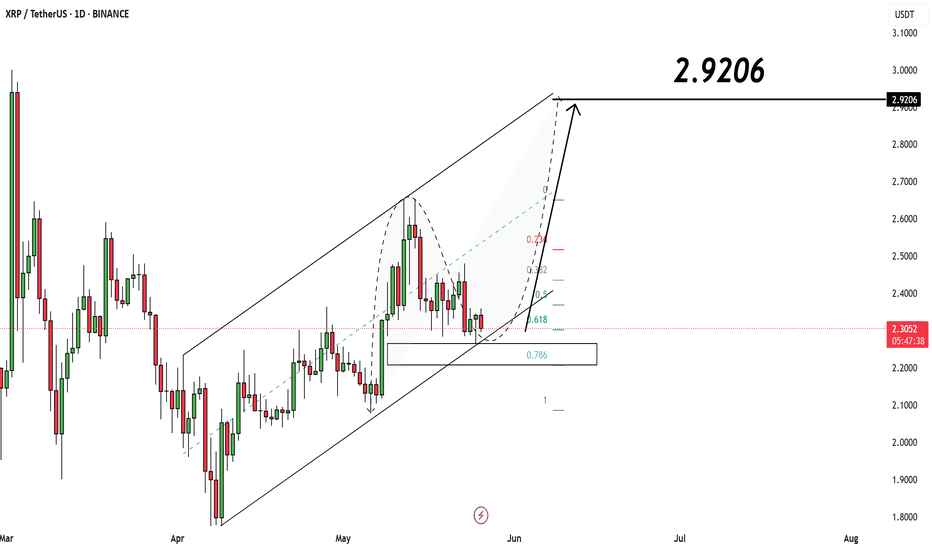
CRYPTOCAP:XRP is currently trading inside a rising channel and holding the midline support around the 0.618 Fibonacci level. This zone has acted as a launchpad in the past and could again support a strong upward move. ✅ Structure: Bullish channel 🧠 Key Support: ~$2.18–$2.22 (aligned with 0.618–0.786 Fib levels) 📍 Trigger: Bullish continuation from this zone...
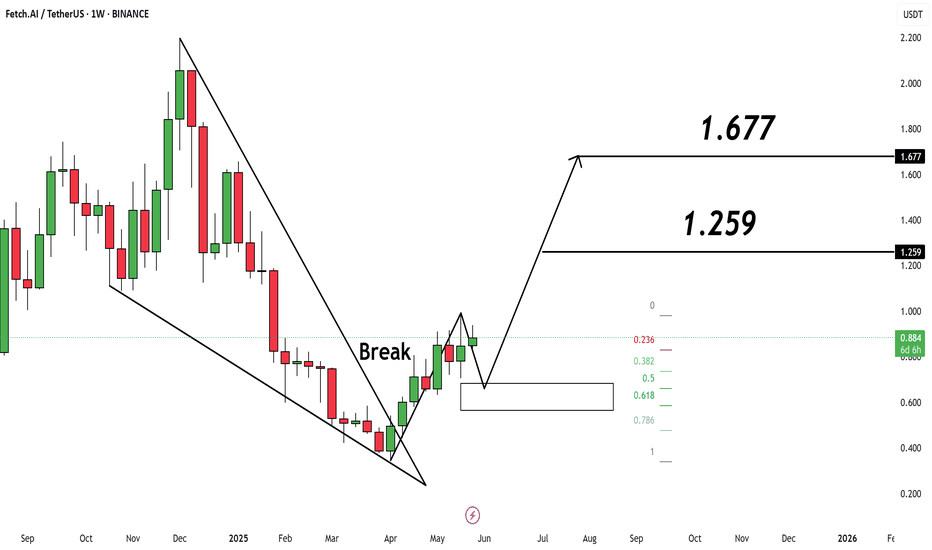
🚀 FET Weekly Breakout Update – Eyes on the Next Leg! NYSE:FET has successfully broken out of the falling wedge structure, a strong bullish reversal pattern. Price is currently hovering near the breakout level, preparing for a potential retest. 📍 Key zone to watch: $0.68–$0.72 This area aligns with the 0.618–0.5 Fibonacci levels and should act as strong support...
📊 Technical Overview: Pattern Identified: A Falling Wedge breakout to the upside — a classic bullish reversal pattern after a prolonged downtrend. Breakout Confirmation: The breakout occurred near a key support level, increasing the reliability of the move. Current Candle: Bullish candle above the wedge, confirming breakout strength. 🎯 Potential Price...
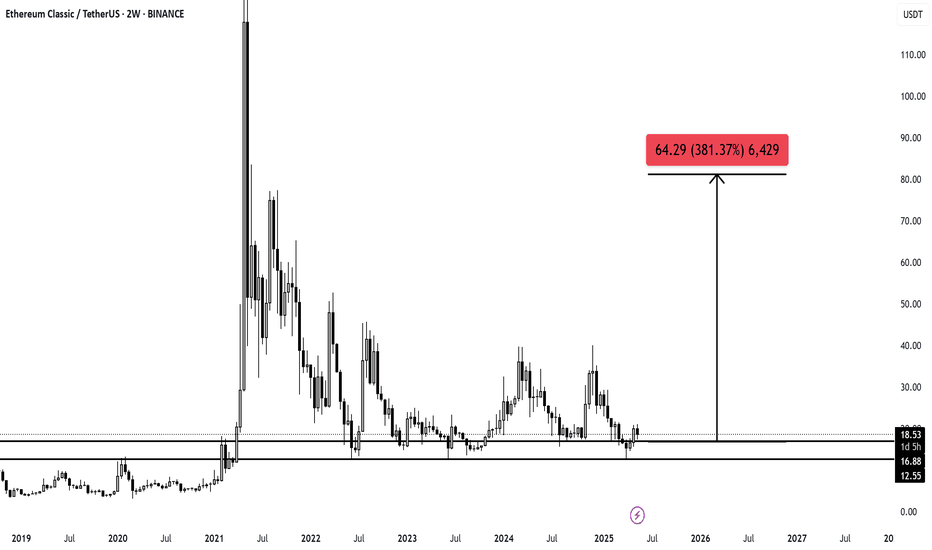
📊 Technical Summary Support Levels: $12.55 and $16.88 – both have historically acted as accumulation zones. Current Price: ~$18.55 Resistance/Target Zone: $64.29 — this aligns with a historical resistance area and implies a +381% potential upside. Pattern Context: Price has been consolidating for nearly two years within a wide range after the 2021 peak. This...
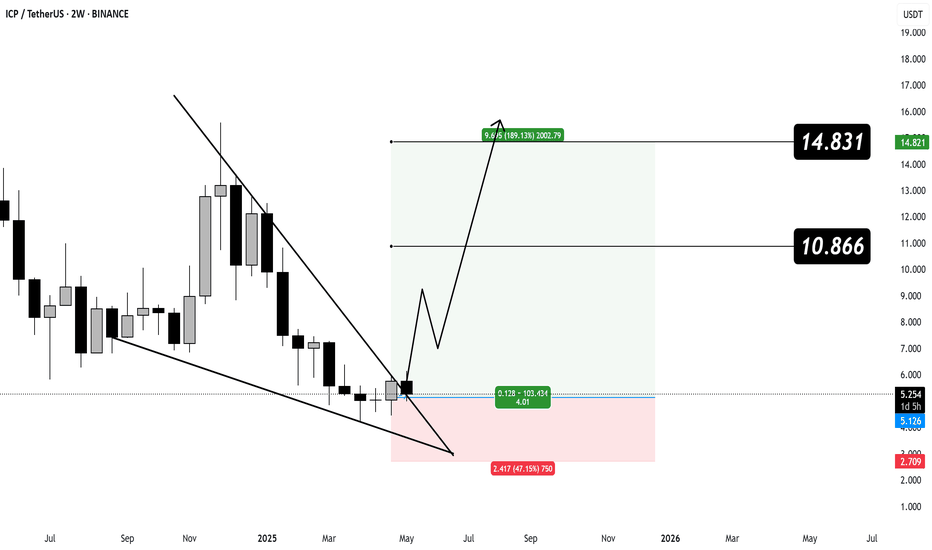
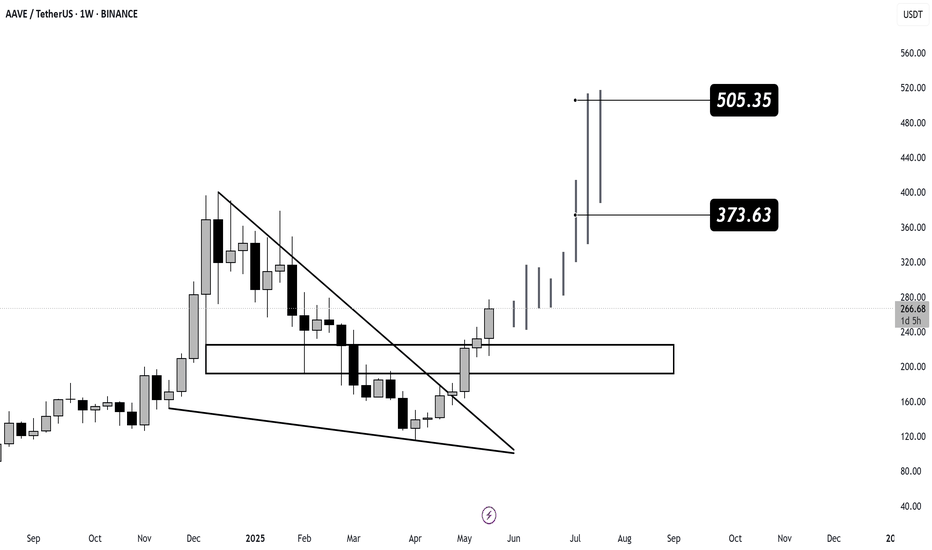
🔍 Technical Overview Pattern: Falling wedge (a bullish reversal formation). Breakout: Clearly confirmed with strong bullish candles. Support zone: Retested successfully around $160–$180 before continuation. Current Price: ~$266.50 Weekly Gain: +14.81% 🎯 Upside Targets Target 1: $373.63 — First major resistance zone. Target 2: $505.35 — Long-term bullish...
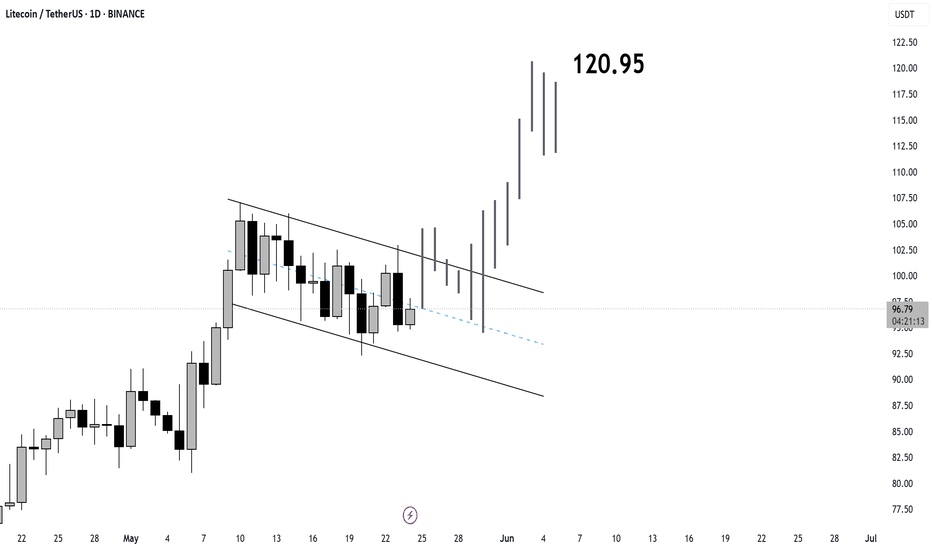
🔍 Technical Analysis Summary: Pattern: Falling Wedge (bullish reversal pattern) Breakout Direction: Upward breakout from the wedge appears to be projected. Current Price: ~$96.72 Target Price: $120.95 (projected post-breakout target) 🟢 Bullish Signs: The falling wedge typically signals a potential trend reversal to the upside. The breakout projection...
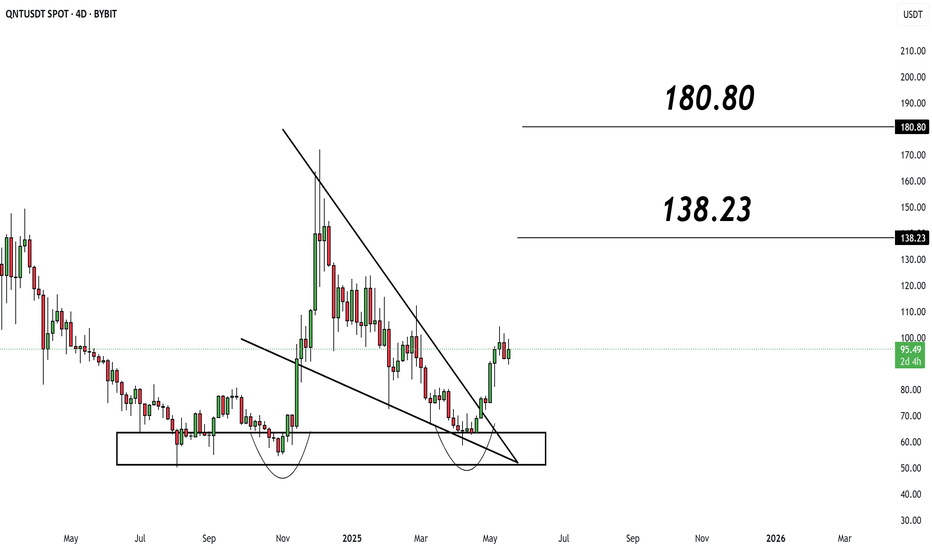
The chart shows a classic Double Bottom pattern formed within a strong support zone between $70–$80, followed by a bullish breakout from a Falling Wedge – a reliable reversal pattern. ✅ Technical Highlights: ✅ Falling Wedge Breakout: A bullish breakout confirms momentum shift. ✅ Current Price: $94.51 ✅ Strong Support Zone: $70–$80 ✅ Clear upside targets are...
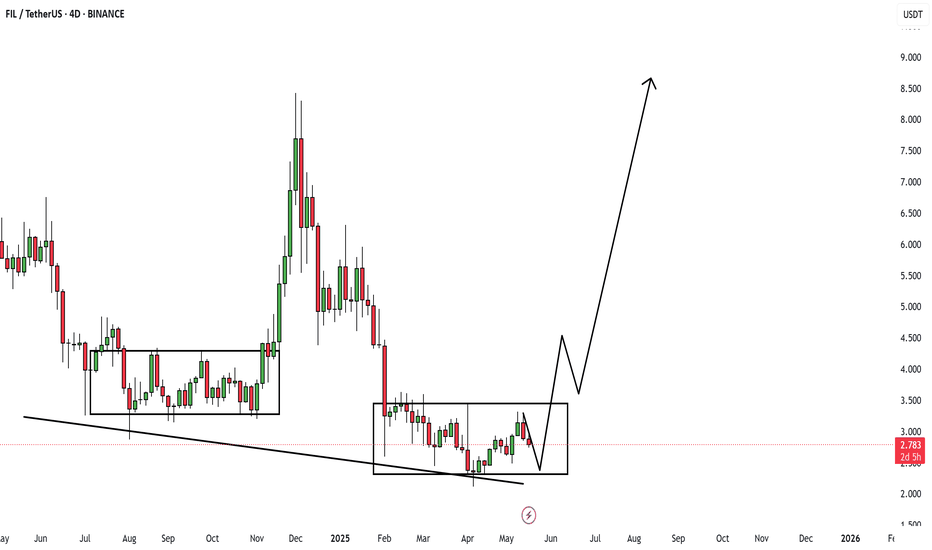
📊 Technical Analysis Summary – FIL/USDT 🔸 Pattern Observed: Double Accumulation Range: Two clear consolidation phases are boxed out in the chart, showing accumulation at relatively equal support zones. Descending Support Line: The lower black trendline connects the major lows, creating a descending support structure, indicating compression and possible breakout...
🔄 Falling Wedge Breakout + Rounded Bottom The chart shows a confirmed breakout from a classic falling wedge pattern, combined with a rounded bottom formation, signaling a strong potential for trend reversal to the upside in the mid-to-long term. 📍 The circled zone highlights the breakout point where bullish momentum accelerated. 🧠 Key Technical...
✅ Rounded Bottom Pattern Formation ENA appears to be forming a rounded bottom, a classic accumulation and reversal pattern. Price has bounced from a strong demand zone near $0.25, where historically bulls have shown aggressive entry. 🔍 Technical Breakdown: Accumulation Zone (Support): $0.2515 – acting as the long-term base. Current Price: ~$0.3788 Pattern...
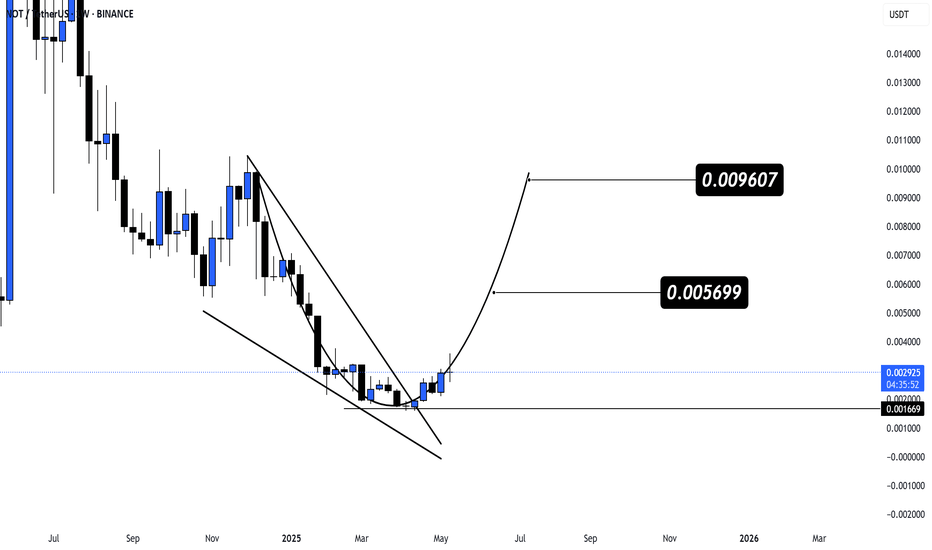
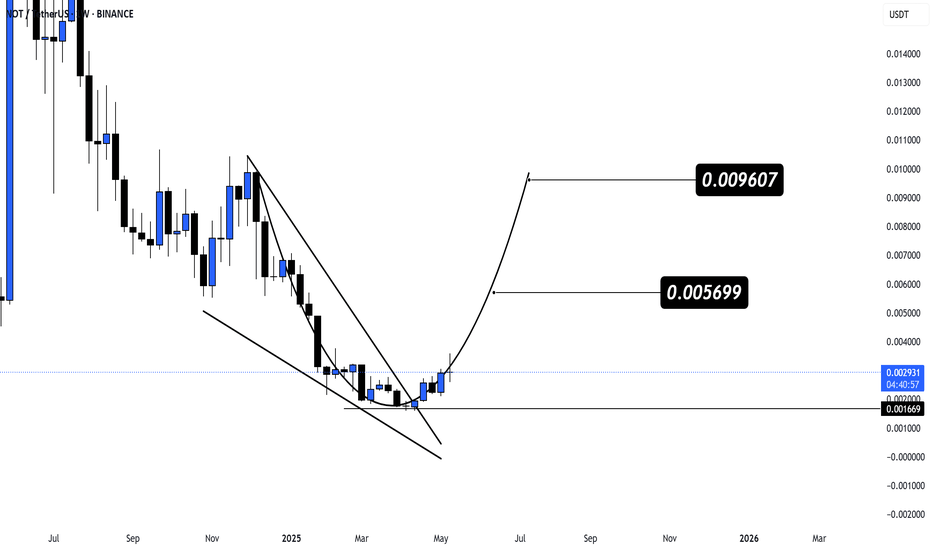
✅ Bullish Falling Wedge Breakout The chart shows a clean breakout from a falling wedge pattern, a bullish reversal structure. This marks the end of the long-term downtrend and potentially the start of a new uptrend. 🔍 Key Technical Insights: Breakout Level: $0.0027–$0.0029 range Support: $0.00166 (base of wedge & critical invalidation zone) Pattern Type:...
