Wave-Tech
PlusPrepare for a potential Boom if we see a significant pullback in rates, followed by an Epic Bust thereafter! Overview: The U.S. 10-Year Treasury Yield exhibits an 80-year cyclical pattern, aligning with Elliott Wave Theory at Super-Cycle and Cycle Degrees. The historical peak of 15.82% (Wave V) in the early 1980s marked the end of a Super-Cycle uptrend,...
Per the daily price action, the move off recent all-time highs appears corrective. The RSI is showing a bullish price divergence against the 107,720 print low, which may mark an (A) wave base at an intermediate degree. If that low holds, a counter-trend bounce could rally the market back toward the .618 retracement near the 117,929 level to potentially mark the...
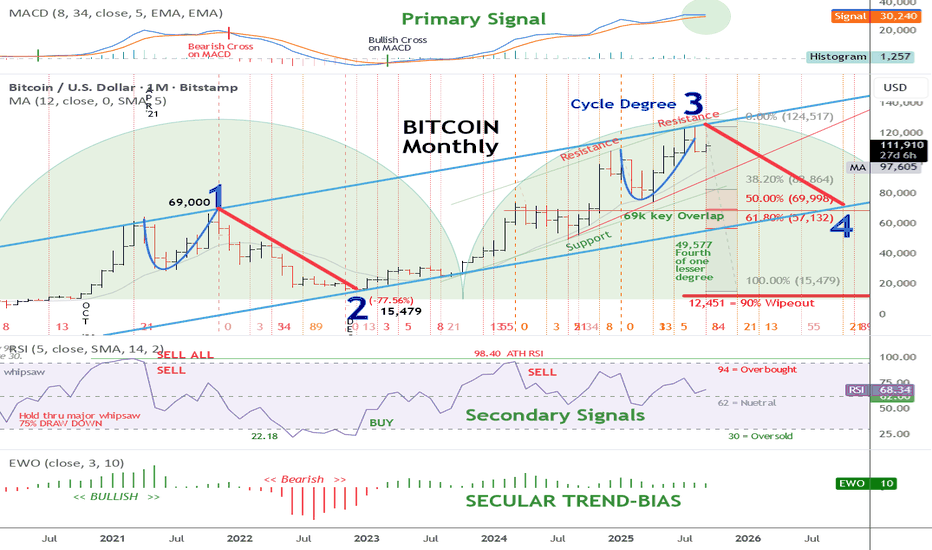
Why Bitcoin Might Have Reached Its Four-Year Cycle Top Historical Pattern: Bitcoin's four-year cycle often peaks around halving events, influencing supply and price dynamics. MACD Signal: The primary signal indicator in the upper panel remains in a bullish position, with no bearish cross, indicating ongoing upward momentum. Wave 3 Peak: The current print...
I am considering adding to an underweight exposure to BTC as a hedge against the real threat of persistent double-digit inflation and the ultimate failure of all fiat currencies. My portfolio has been overweight in physical Gold and Silver since 2005. Over the years, I made the mistake of not onboarding an adequate amount of BTC into my holdings. I believe that...
Since the historic print low of 70.69 in 2008, the US dollar has risen more than 55% to its current levels north of 110. There is no telling just how high the dollar can run amid the parabolic move upward from its 2021 low. An inverse head and shoulder pattern suggests a minimum upside price target of 117.64 or around 7% north of current levels. Fibonacci time...


