ama-Beeps
Premium🚀 High-Quality ADA Long Setup (4H Chart) This trade is forming on carefully marked zones and clear trends. 🔑 Key Highlights 1. 4H Resistance Zone Price has tapped this strong resistance zone 5 times already. The more it gets tested, the higher the probability it will break on the next attempt. 2. Entry Zone We are not entering immediately — patience is key...
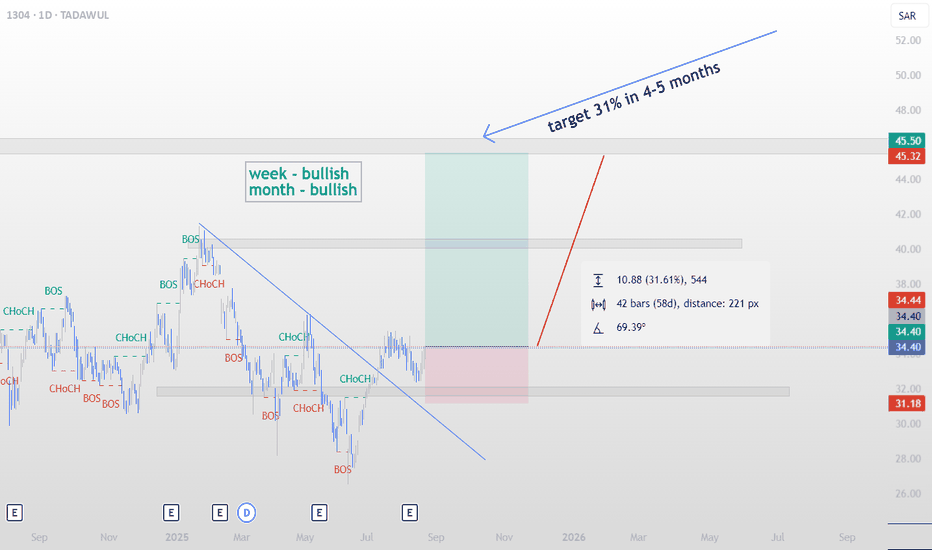
An investment opportunity is unfolding on Al Yamama Steel (Tadawul: 1304). We are anticipating a potential 31% price appreciation within 4–5 months, targeting the 45.50 SAR zone. 🔑 Key Highlights: Weekly & Monthly Bias → Bullish: Both higher timeframes are already aligned to the upside. Daily CHoCH Confirmations: Multiple Change of Character signals show...
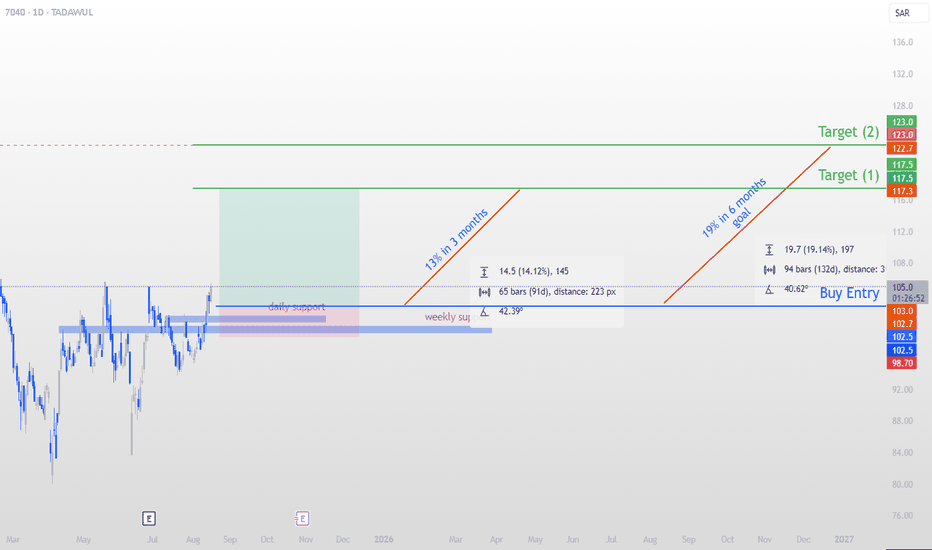
We are not looking to jump in immediately — patience is key. The retracement around 102.5 SAR offers a favorable entry with a 3.95 Risk-to-Reward ratio. The protective stop loss is placed at 98.7 SAR. The weekly bias remains bullish, supporting our long-term perspective on this move. 📌 Trade Plan Entry: 102.5 SAR Stop Loss: 98.7 SAR Risk-to-Reward: 3.95 📈...
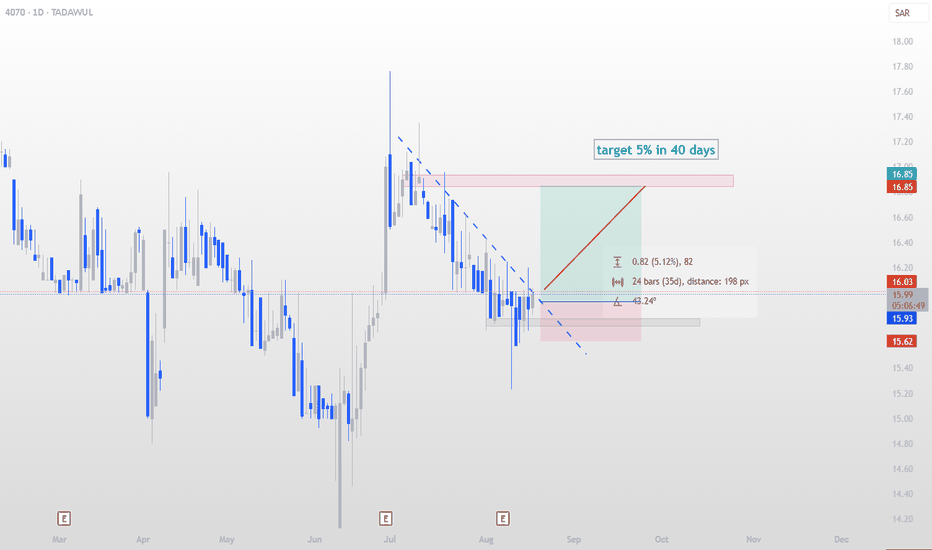
4070 – Tihama Advertising & Public Relations Entry: 15.93 SAR Target: 16.85 SAR (≈ 5% in 40 days) Stop Loss: 15.62 SAR Risk-Reward Ratio: ~3.0 Trend Analysis: Weekly trend: Bearish Monthly trend: Bearish Current price action suggests we are in an accumulation zone, with the market likely to remain range-bound before any breakout. Trade Outlook: This is...
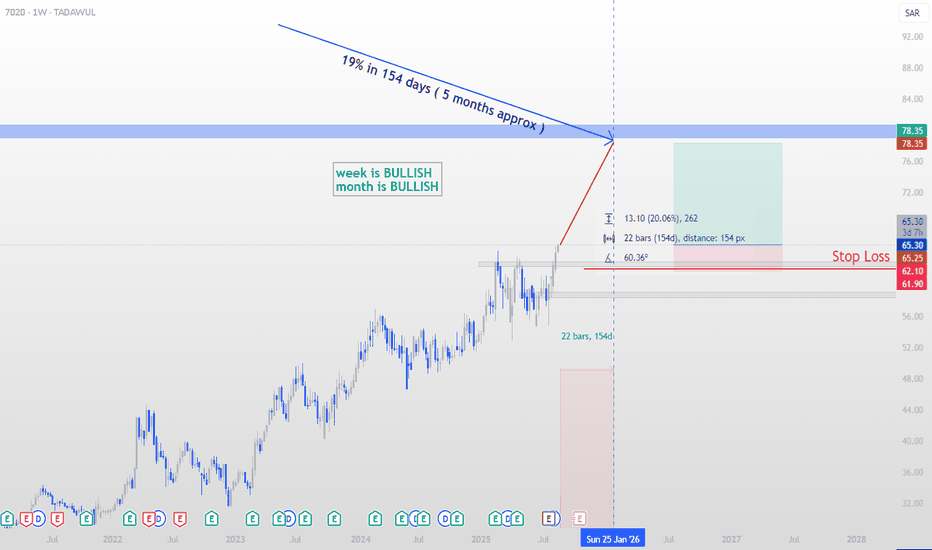
This stock deserves a spot in our portfolio. Although we missed a slightly better entry a few days ago that could have added around 2.5% extra, the current setup still offers strong potential. Entry Zone: Current RR at 3.84 makes this a good entry. Target: ~19% upside in the next 154 days. Stop Loss: Well-defined at 5.21%. Bias: Both weekly and monthly trends...
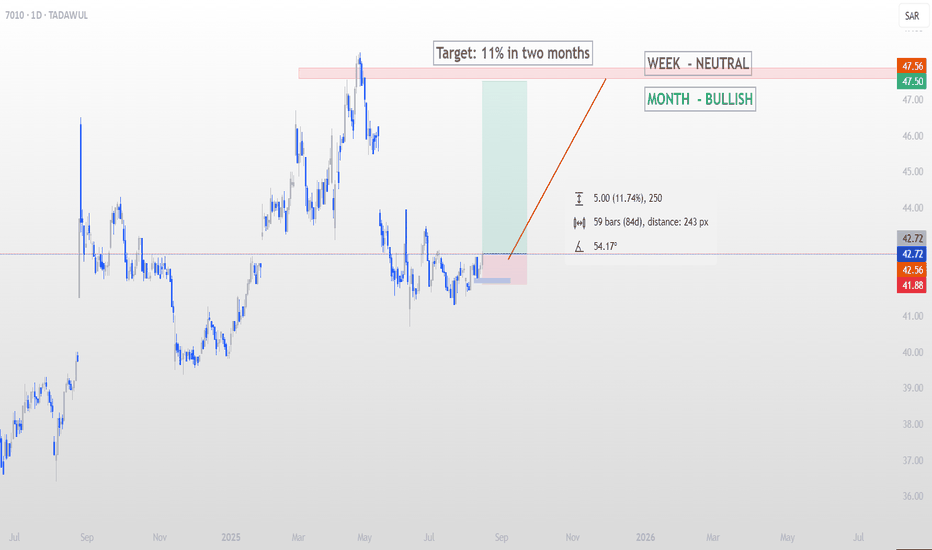
Today, I’m sharing a potential swing setup on Saudi Telecom Co. (7010) with a Risk/Reward Ratio of 5.69 and an upside potential of 11.74% over the next two months. Weekly Bias: Neutral Monthly Bias: Bullish Target: SAR 47.56 (approx. +11.74%) Stop Loss: SAR 41.88 (approx. -1.97%) Entry Zone: Marked on chart Timeframe: Daily The key zones have been carefully...
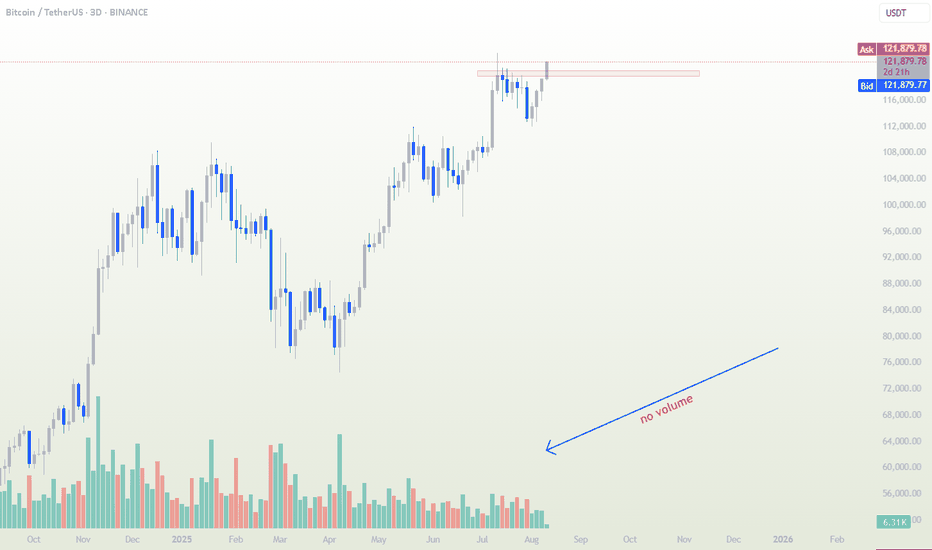
⚠️ Watch Out – Breakout Without Volume Price is testing the resistance zone again, but look closely at the volume bars — there’s no real participation behind this move. Without strong buying volume, it’s unlikely the market can sustain a bullish breakout. Low-volume breakouts often result in false moves or quick pullbacks as there’s no fuel to keep driving price...
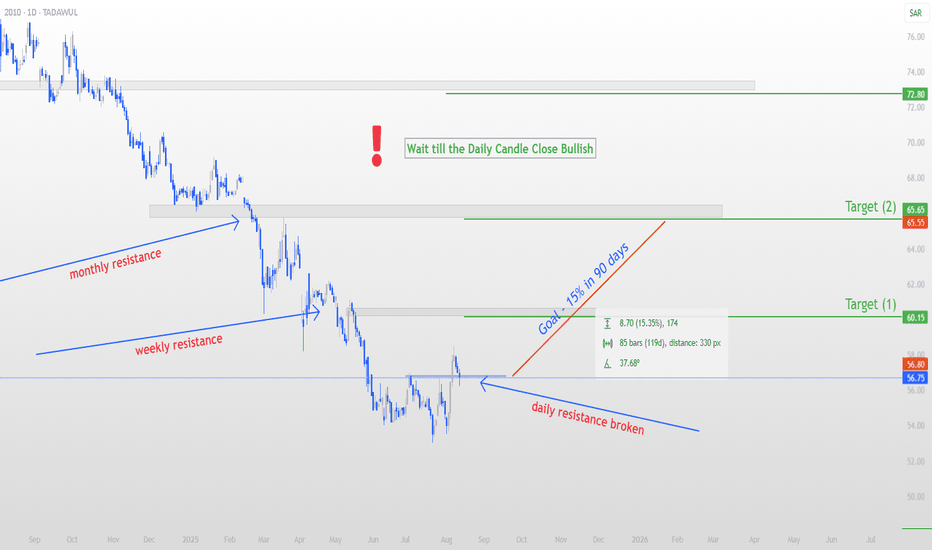
Our goal for this trade is to achieve +15% within 90 days, perfectly aligning with our annual yield target. ⚠ Do not enter right away — wait for the daily candle to close bullish before taking a position. Daily resistance has been broken, signaling bullish momentum. Weekly chart structure is bullish, adding confidence to the setup. We will monitor price action...
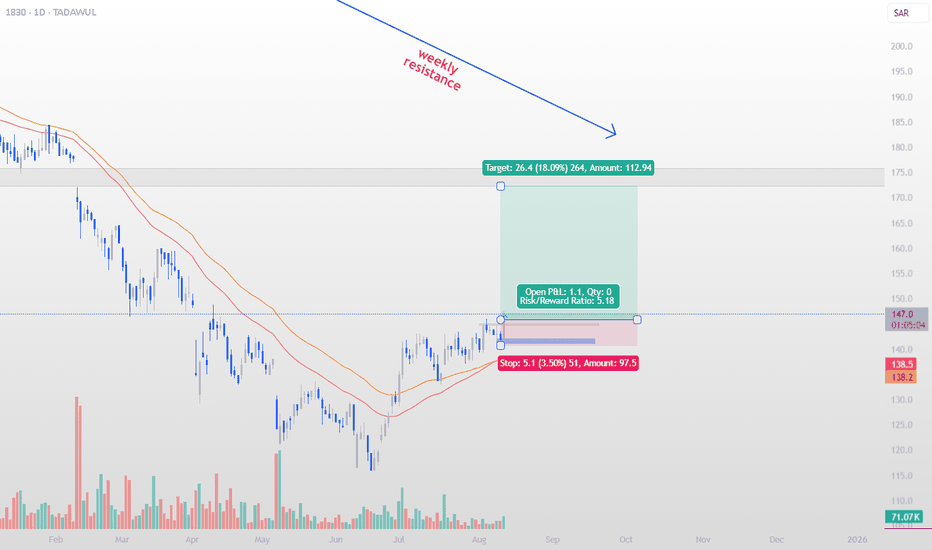
We’ve just received an alert for a beautiful swing setup on Leejam Sports Co. (TADAWUL). From the current technicals, we can easily anticipate a 15% price rise within the next 3 months — a very healthy gain, especially if you’re aiming for a 35–40% annual yield. Risk & Reward: Target Gain: +15% (within ~3 months) Risk: -4% potential downside Risk/Reward Ratio:...
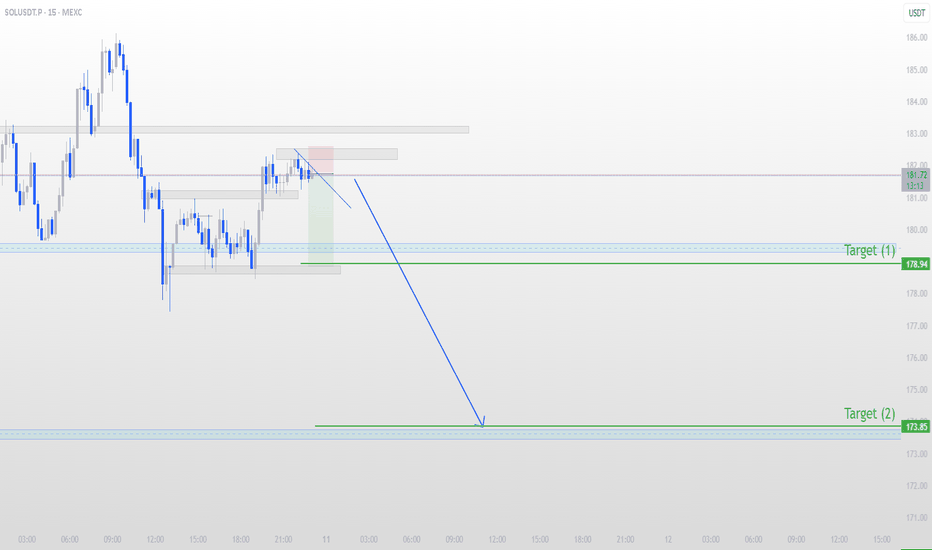
Content: Price has retested the supply zone and shown rejection, forming a descending structure on the 15m chart. My plan: Entry: After confirming break of minor support. Target 1: 178.94 (near-term demand / liquidity zone) Target 2: 173.85 (major demand zone from previous structure) Invalidation: Above the recent supply zone. This setup is based on structure...
with a risk factor of 2.59 Avax is ready to take an upward ride with a potential 50% fib retracement target at least. Disclaimer: Not financial advice – just sharing my market outlook. Always manage risk and do your own research before taking trades. 💡 Educational Note: For sharper precision, drop to 4H or 2H charts and identify the latest ChoCH (Change of...
Trend Broken: The long-term downtrend has finally been broken, signaling a potential shift in market structure. Liquidity Taken: Recent price action swept the lows, grabbing liquidity before bouncing back. MACD Turning Up: Momentum is starting to build on the upside, indicating possible bullish continuation. 📍 Plan: Watching for follow-through towards the key...
I’ve spotted a potential retracement play on HNT/USDT that aligns with my swing trading plan. 📊 Setup Details: Entry Zone: Near current consolidation after reclaiming local support Target 1: $5.383 (around the 38% Fibonacci retracement) Target 2: Watching closely for a potential push toward the 50.0% Fib level if momentum continues Stop Loss: $2.305 (below...
SOL has retraced back to the 38% Fibonacci level on the 5-minute timeframe, showing strong potential for a bounce. On the 15-minute timeframe, we anticipate a move towards at least the 50% Fibonacci retracement level. This setup is supported by additional technical tools I’ve aligned, providing further confirmation. ⚠️ Entry is advised only if you find...
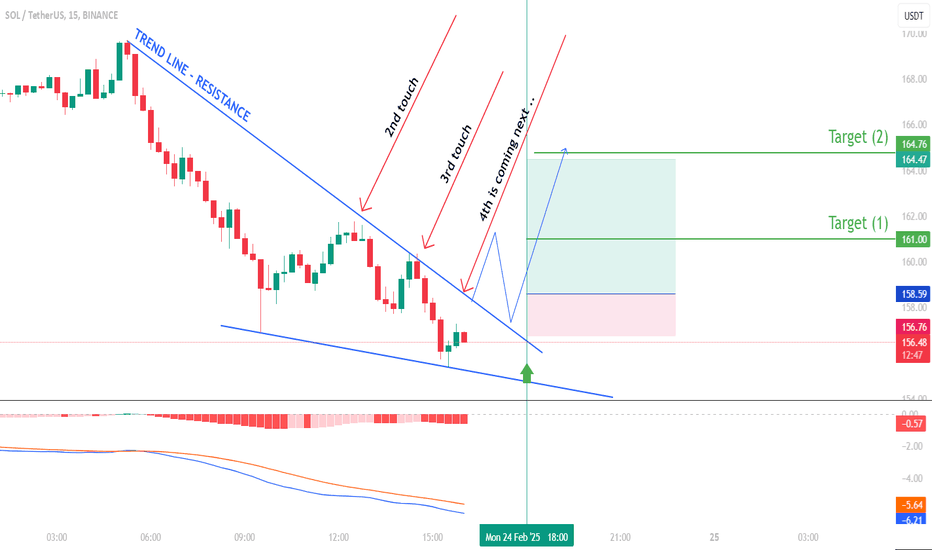
This trade setup on the SOLUSDT pair is based on a descending wedge pattern, where the price is making lower highs and lower lows within a contracting range. The trendline resistance has been tested multiple times, with the upcoming 4th touch increasing the probability of a breakout. Trade Plan: Entry: After the breakout of the trendline resistance, followed by a...
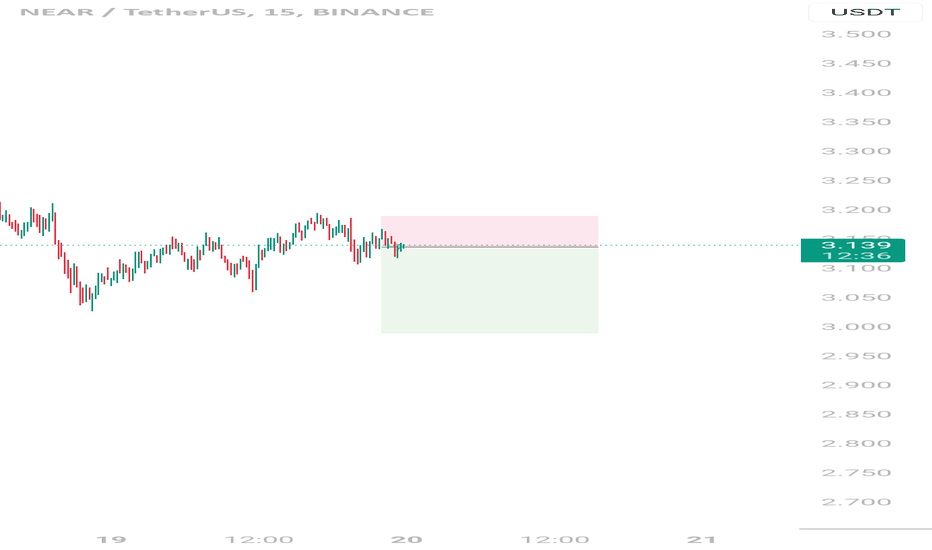
This trade setup on NEAR/USDT is based on a potential short opportunity observed on the 15-minute timeframe. The price is currently at $3.14, with a clear risk-to-reward ratio defined. The stop-loss is positioned above the recent high, while the take-profit target extends toward a lower support level. The setup aligns with a structured approach to swing trading,...
Since Bitcoin's inception, the crypto market has experienced four major bull-bear cycles that have defined its trajectory over the last 14 years. This chart provides a detailed analysis of these historical trends, emphasizing the diminishing returns observed during each bull cycle: 2013 Bull Cycle: Bitcoin surged an astonishing 22,700%, marking its first major...
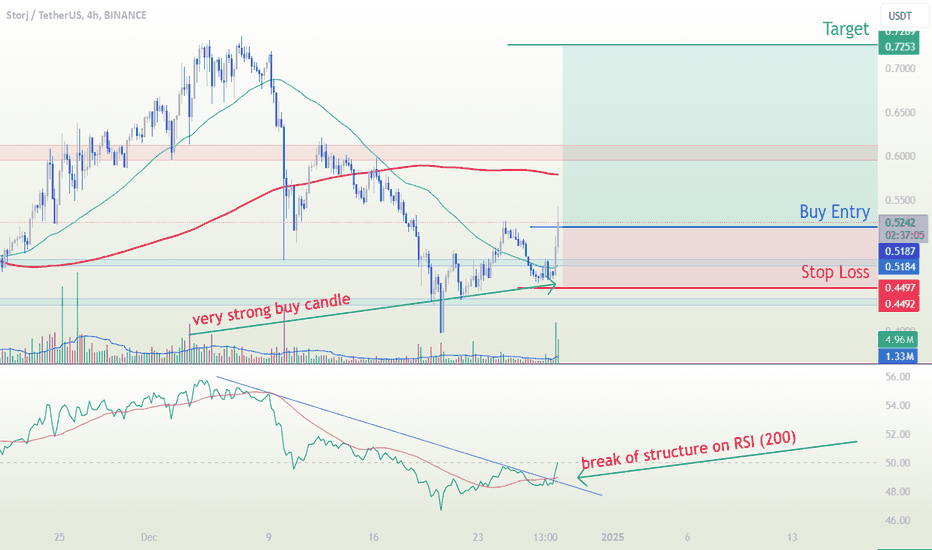
We’ve identified a compelling buy opportunity on the STORJ/USDT pair based on the following observations: Break of Structure: The RSI (200-period) has confirmed a breakout, signaling a potential shift in momentum. Engulfing Candle: A strong bullish engulfing candle indicates a robust buying interest. Volume Spike: The significant increase in volume further...

