fibonacci
indicator
spx500
supportandresistance
trendanalysis
trendline
Less Tags
Show All Tags
All Types
Type
All Types
Indicators
Strategies
Libraries
All Accesses
Script access
All Accesses
Open
Protected
Invite-only
Public & Private
Privacy
Public & Private
Public
Private
With two times unsuccessful attempts in the recent months, the S&P 500 was unable to form a bullish candle above 3000 resistance zone. If the Fed rate cut and other fundamentals go against the stocks market a corrective wave is expected. the most important support line is the .0236 Fibo retracement level from the deeps of Feb 2016 which is located at 2739 which...
4
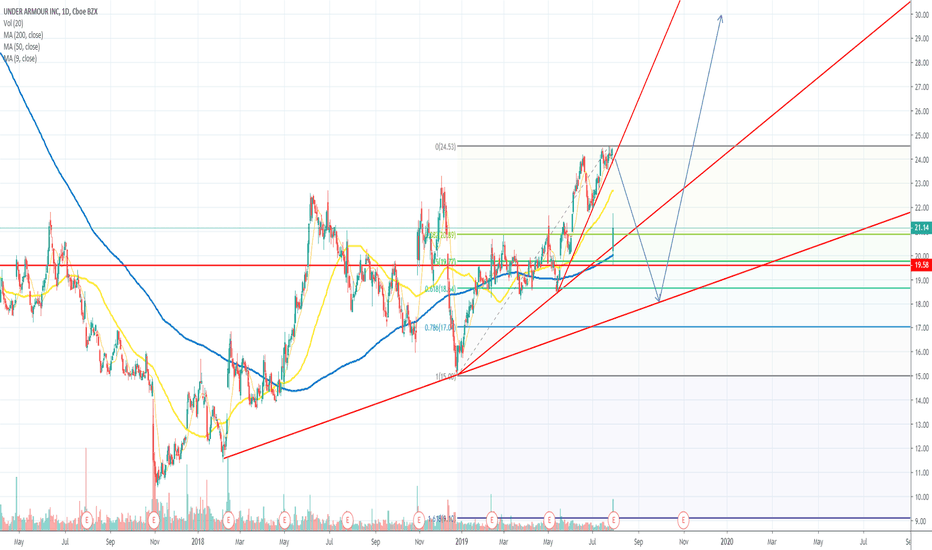
Due to recent earning reports, there might be upcoming selling pressure and momentum. Price is above MA 200 and %50 Fibo level, long term upward trendline still not broken.
3
User has no followers
577
819
2971
Message
Follow
Following
Unfollow
793
1291
3625
Message
Follow
Following
Unfollow
36346
1906
232994
Message
Follow
Following
Unfollow
168
143
3150
Message
Follow
Following
Unfollow
Type
Script access
Privacy


