enduringmiss
EssentialLast seen
Ideas
2Scripts
0Joined Jan 18, 2018
chartpattern
indicator
trendanalysis
Less Tags
Show All Tags
All Types
Type
All Types
Indicators
Strategies
Libraries
All Accesses
Script access
All Accesses
Open
Protected
Invite-only
Public & Private
Privacy
Public & Private
Public
Private
Hi Guys, We are at the very crucial months for the entire traditional market. I want to use S&P 500 as an indicator to give a high level understanding about the trend for the upcoming months. Let's directly dive into the chart analysis. Look at the monthly chart, S&P 500 is almost forming a H&S pattern overall. I had two yellow horizontal lines to indicate the...
3
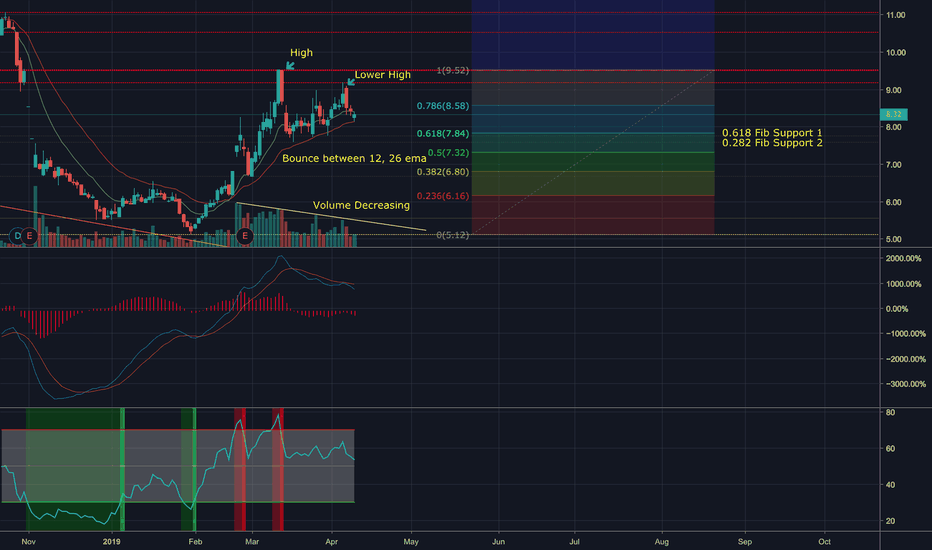
Look at the daily chart, I originally thought 300324 will be rejected at a strong resistance level at around 8.6 when it had a strong bounce off from the low of 5.12. However bulls surprised me and pushed it up to 9.5 price range, and then hard rejected it back to 8.6, by forming a tweezer top pattern. Then 8.6 becomes a crucial price level that the price was...
1
219
48
998
Message
Follow
Following
Unfollow
4
0
0
Message
Follow
Following
Unfollow
219
48
998
Message
Follow
Following
Unfollow
79831
771
238638
Message
Follow
Following
Unfollow
Type
Script access
Privacy


