fibonacci6180
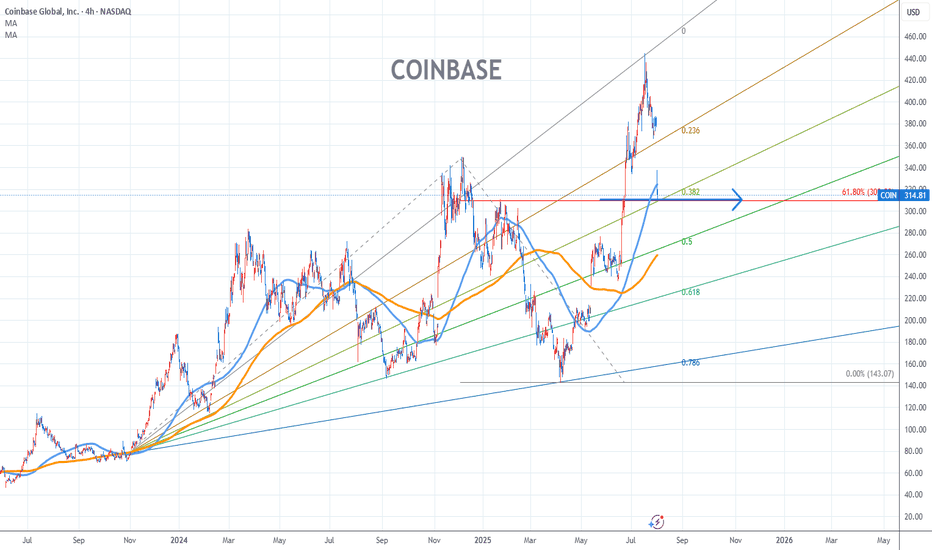
EssentialTrading Idea 1) Find a FIBO slingshot 2) Check FIBO 61.80% level 3) Entry Point > 310/61.80% Chart time frame:C A) 15 min(1W-3M) B) 1 hr(3M-6M) C) 4 hr(6M-1year) D) 1 day(1-3years) Stock progress:C A) Keep rising over 61.80% resistance B) 61.80% resistance C) 61.80% support D) Hit the bottom E) Hit the top Stocks rise as they rise from support and fall from...
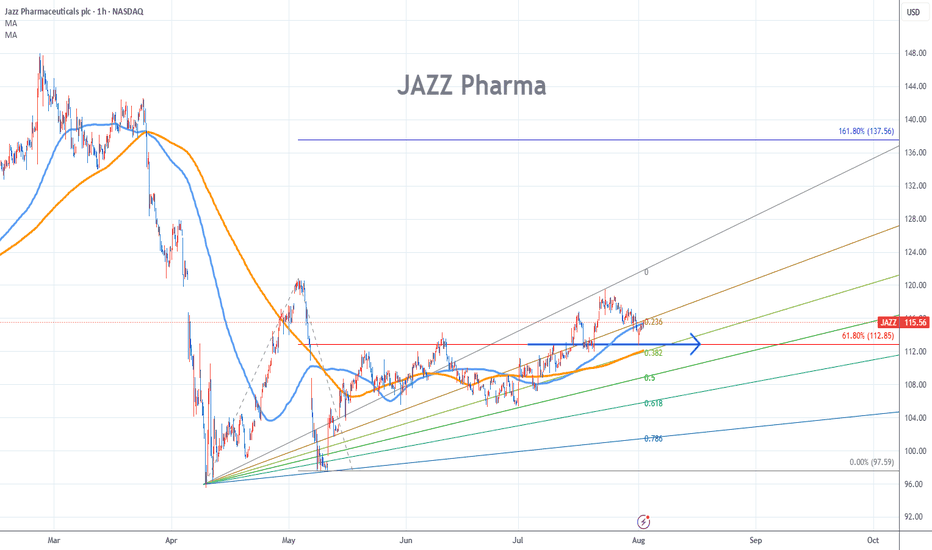
Trading Idea 1) Find a FIBO slingshot 2) Check FIBO 61.80% level 3) Entry Point > 112/61.80% Chart time frame:B A) 15 min(1W-3M) B) 1 hr(3M-6M) C) 4 hr(6M-1year) D) 1 day(1-3years) Stock progress:C A) Keep rising over 61.80% resistance B) 61.80% resistance C) 61.80% support D) Hit the bottom E) Hit the top Stocks rise as they rise from support and fall from...
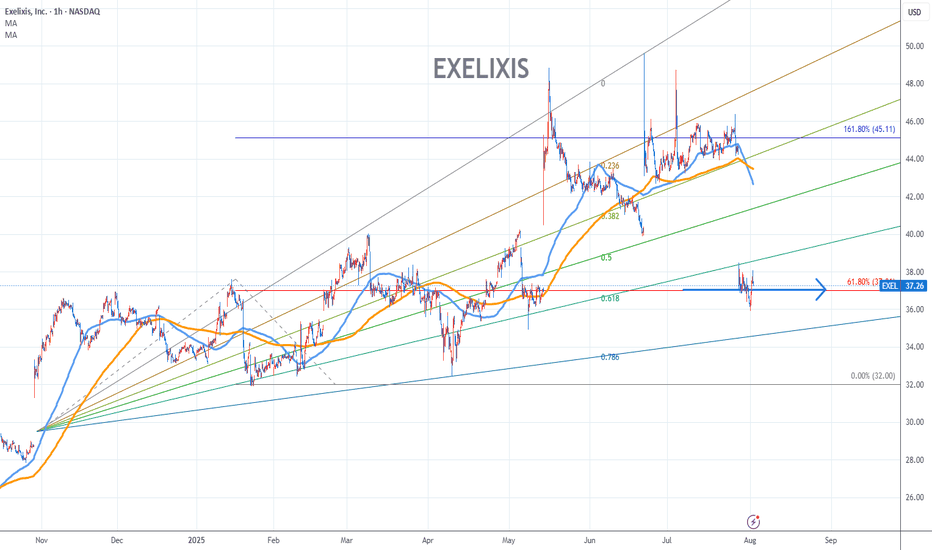
Exelixis Stock Chart Fibonacci Analysis 080125 Trading idea - Entry point > 37/61.80% Trading Idea 1) Find a FIBO slingshot 2) Check FIBO 61.80% level 3) Entry Point > 37/61.80% Chart time frame:B A) 15 min(1W-3M) B) 1 hr(3M-6M) C) 4 hr(6M-1year) D) 1 day(1-3years) Stock progress:A A) Keep rising over 61.80% resistance B) 61.80% resistance C) 61.80%...
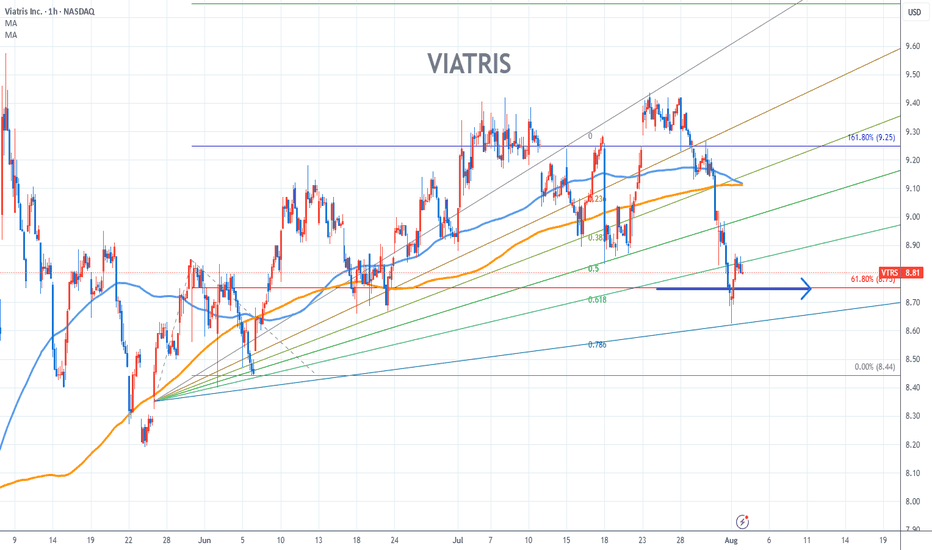
Trading Idea 1) Find a FIBO slingshot 2) Check FIBO 61.80% level 3) Entry Point > 8.8/61.80% Chart time frame:B A) 15 min(1W-3M) B) 1 hr(3M-6M) C) 4 hr(6M-1year) D) 1 day(1-3years) Stock progress:A A) Keep rising over 61.80% resistance B) 61.80% resistance C) 61.80% support D) Hit the bottom E) Hit the top Stocks rise as they rise from support and fall from...
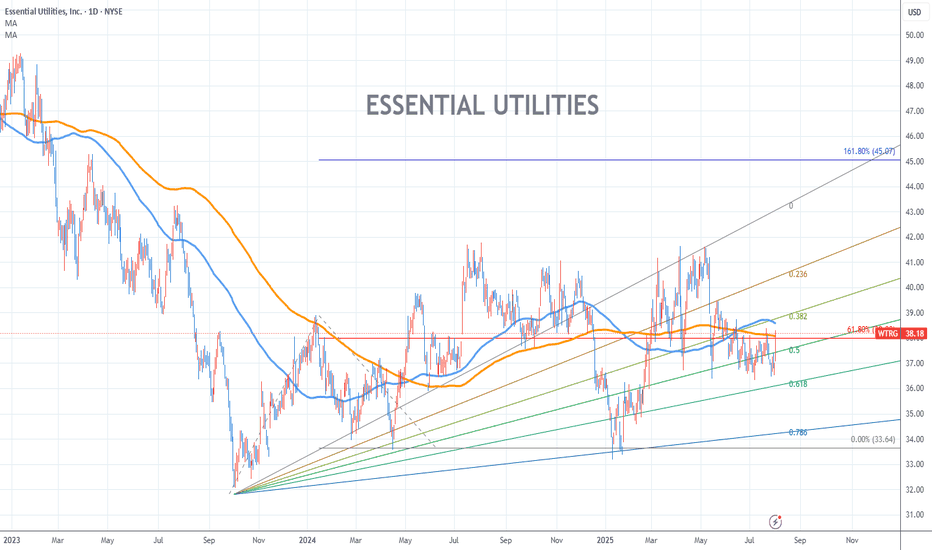
Trading Idea 1) Find a FIBO slingshot 2) Check FIBO 61.80% level 3) Entry Point > 38/61.80% Chart time frame:D A) 15 min(1W-3M) B) 1 hr(3M-6M) C) 4 hr(6M-1year) D) 1 day(1-3years) Stock progress:A A) Keep rising over 61.80% resistance B) 61.80% resistance C) 61.80% support D) Hit the bottom E) Hit the top Stocks rise as they rise from support and fall from...
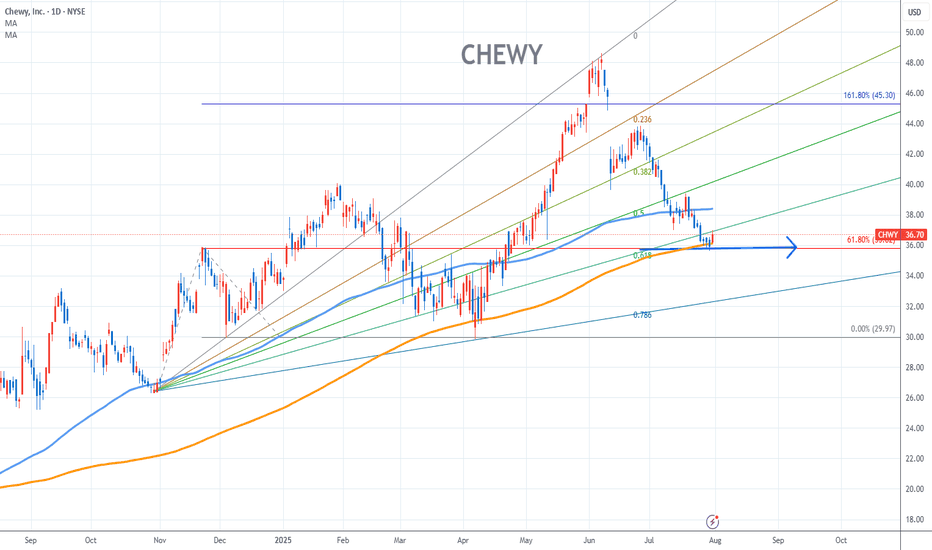
Trading Idea 1) Find a FIBO slingshot 2) Check FIBO 61.80% level 3) Entry Point > 36/61.80% Chart time frame:D A) 15 min(1W-3M) B) 1 hr(3M-6M) C) 4 hr(6M-1year) D) 1 day(1-3years) Stock progress:C A) Keep rising over 61.80% resistance B) 61.80% resistance C) 61.80% support D) Hit the bottom E) Hit the top Stocks rise as they rise from support and fall from...
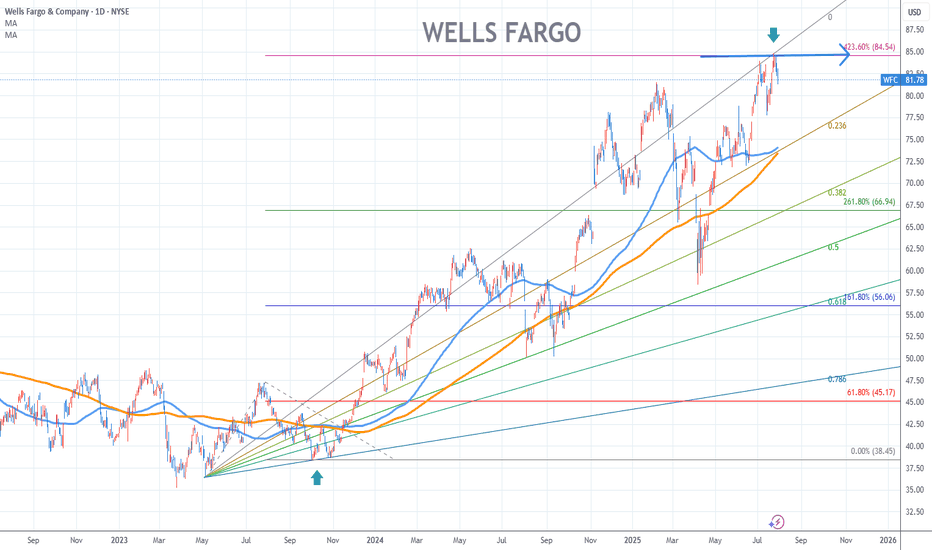
Hit the 84.5/423.60% resistance level. Trading Idea Chart time frame:D A) 15 min(1W-3M) B) 1 hr(3M-6M) C) 4 hr(6M-1year) D) 1 day(1-3years) Stock progress:E A) Keep rising over 61.80% resistance B) 61.80% resistance C) 61.80% support D) Hit the bottom E) Hit the top Stocks rise as they rise from support and fall from resistance. Our goal is to find a low...
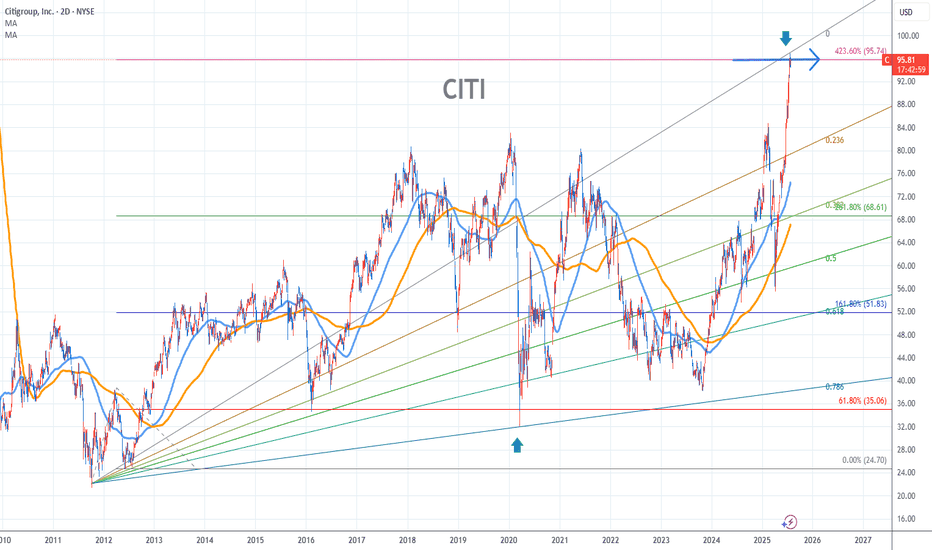
Hit the 96/423.60% resistance level. Chart time frame:D A) 15 min(1W-3M) B) 1 hr(3M-6M) C) 4 hr(6M-1year) D) 1 day(1-3years) Stock progress:E A) Keep rising over 61.80% resistance B) 61.80% resistance C) 61.80% support D) Hit the bottom E) Hit the top Stocks rise as they rise from support and fall from resistance. Our goal is to find a low support point and...
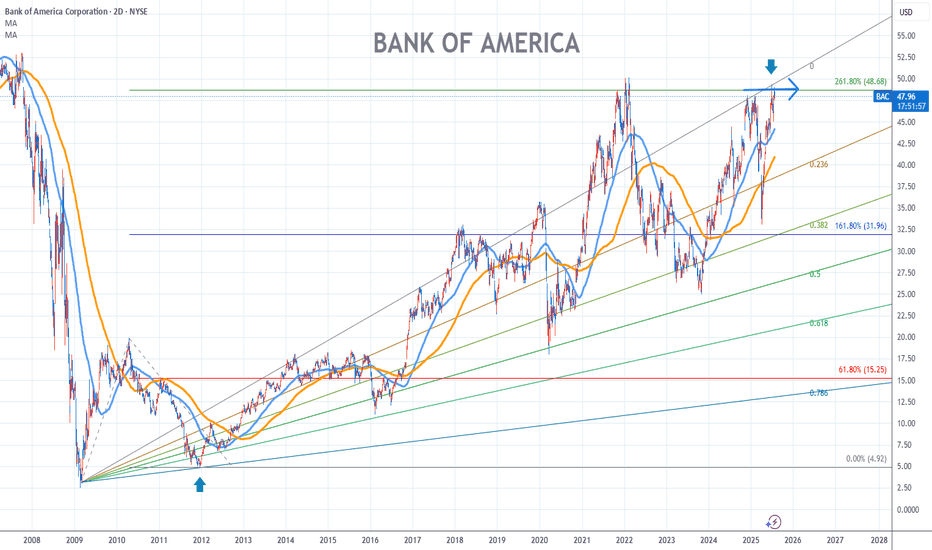
Hit the 48.7/261.80% resistance level. Trading Idea Chart time frame:D A) 15 min(1W-3M) B) 1 hr(3M-6M) C) 4 hr(6M-1year) D) 1 day(1-3years) Stock progress:E A) Keep rising over 61.80% resistance B) 61.80% resistance C) 61.80% support D) Hit the bottom E) Hit the top Stocks rise as they rise from support and fall from resistance. Our goal is to find a low...
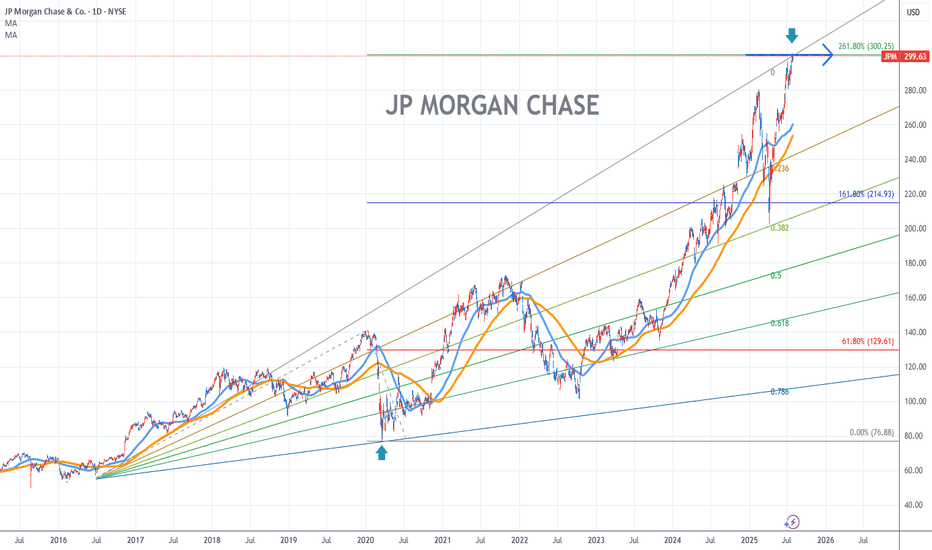
Trading Idea Hit the 300/261.80% resistance level. Chart time frame:D A) 15 min(1W-3M) B) 1 hr(3M-6M) C) 4 hr(6M-1year) D) 1 day(1-3years) Stock progress:E A) Keep rising over 61.80% resistance B) 61.80% resistance C) 61.80% support D) Hit the bottom E) Hit the top Stocks rise as they rise from support and fall from resistance. Our goal is to find a low...
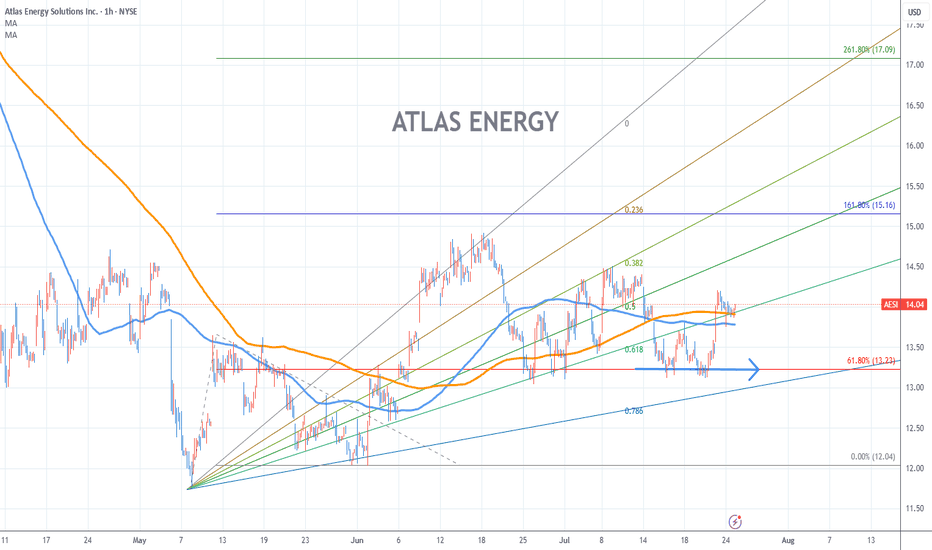
Trading Idea 1) Find a FIBO slingshot 2) Check FIBO 61.80% level 3) Entry Point > 13.2/61.80% Chart time frame:B A) 15 min(1W-3M) B) 1 hr(3M-6M) C) 4 hr(6M-1year) D) 1 day(1-3years) Stock progress:C A) Keep rising over 61.80% resistance B) 61.80% resistance C) 61.80% support D) Hit the bottom E) Hit the top Stocks rise as they rise from support and fall from...
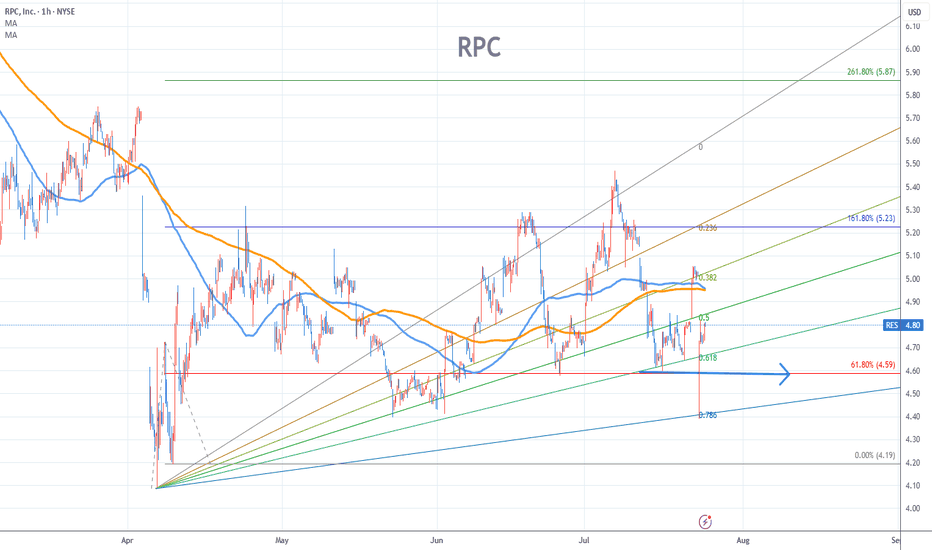
Trading Idea 1) Find a FIBO slingshot 2) Check FIBO 61.80% level 3) Entry Point > 4.6/61.80% Chart time frame:B A) 15 min(1W-3M) B) 1 hr(3M-6M) C) 4 hr(6M-1year) D) 1 day(1-3years) Stock progress:A A) Keep rising over 61.80% resistance B) 61.80% resistance C) 61.80% support D) Hit the bottom E) Hit the top Stocks rise as they rise from support and fall from...
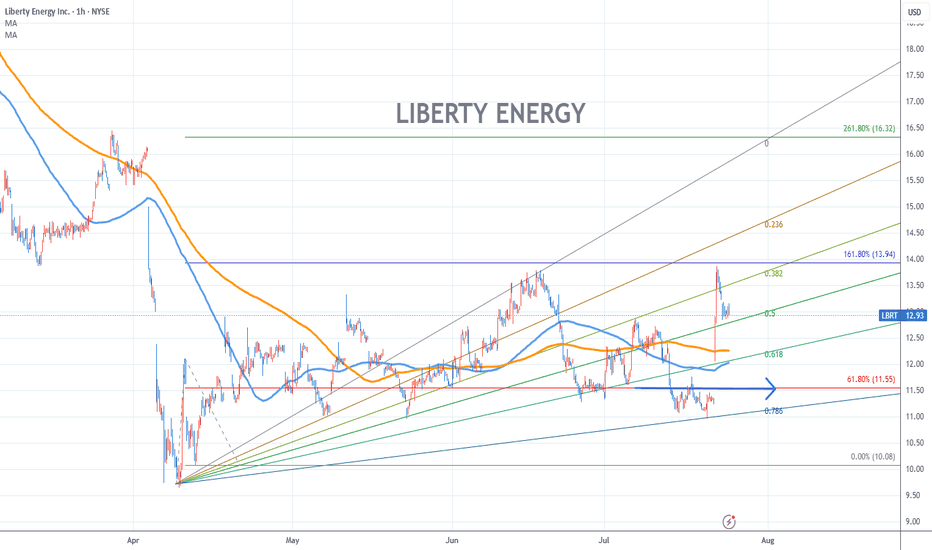
Trading Idea 1) Find a FIBO slingshot 2) Check FIBO 61.80% level 3) Entry Point > 11.6/61.80% Chart time frame:B A) 15 min(1W-3M) B) 1 hr(3M-6M) C) 4 hr(6M-1year) D) 1 day(1-3years) Stock progress:A A) Keep rising over 61.80% resistance B) 61.80% resistance C) 61.80% support D) Hit the bottom E) Hit the top Stocks rise as they rise from support and fall from...
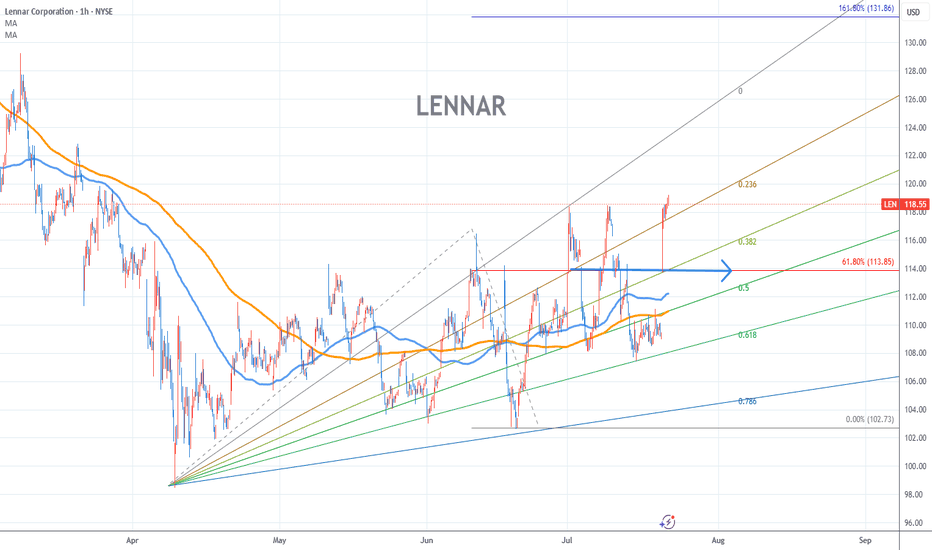
Trading Idea 1) Find a FIBO slingshot 2) Check FIBO 61.80% level 3) Entry Point > 114/61.80% Chart time frame:B A) 15 min(1W-3M) B) 1 hr(3M-6M) C) 4 hr(6M-1year) D) 1 day(1-3years) Stock progress:A A) Keep rising over 61.80% resistance B) 61.80% resistance C) 61.80% support D) Hit the bottom E) Hit the top Stocks rise as they rise from support and fall from...
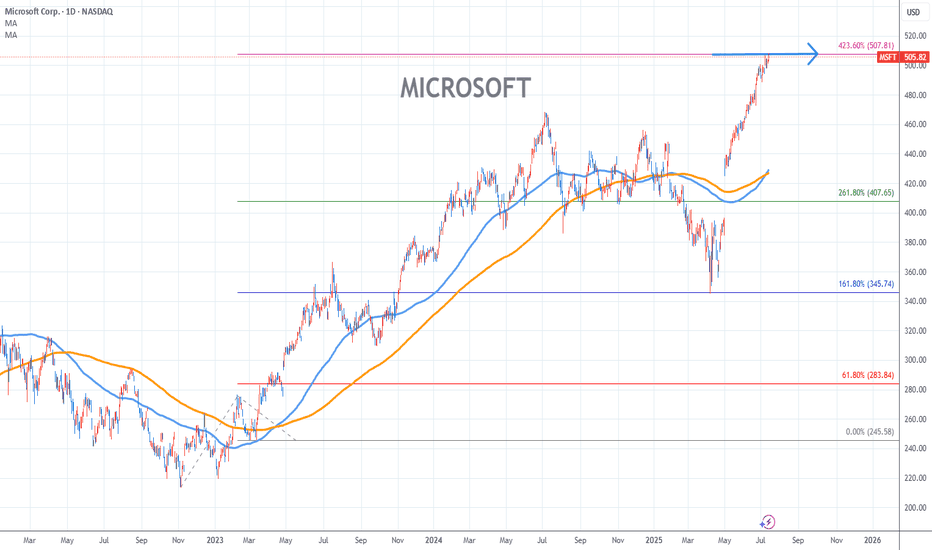
Trading idea - Hit the top > 507/423.60% Chart time frame:D A) 15 min(1W-3M) B) 1 hr(3M-6M) C) 4 hr(6M-1year) D) 1 day(1-3years) Stock progress:E A) Keep rising over 61.80% resistance B) 61.80% resistance C) 61.80% support D) Hit the bottom E) Hit the top Stocks rise as they rise from support and fall from resistance. Our goal is to find a low support point...
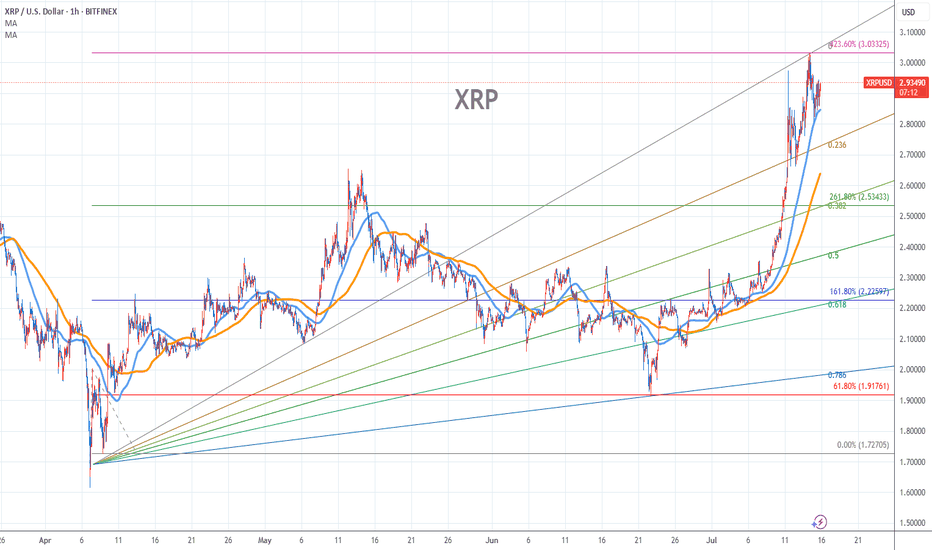
Trading idea - Hit the top - 3.03/423.60% Chart time frame:B A) 15 min(1W-3M) B) 1 hr(3M-6M) C) 4 hr(6M-1year) D) 1 day(1-3years) Stock progress:E A) Keep rising over 61.80% resistance B) 61.80% resistance C) 61.80% support D) Hit the bottom E) Hit the top Stocks rise as they rise from support and fall from resistance. Our goal is to find a low support point...
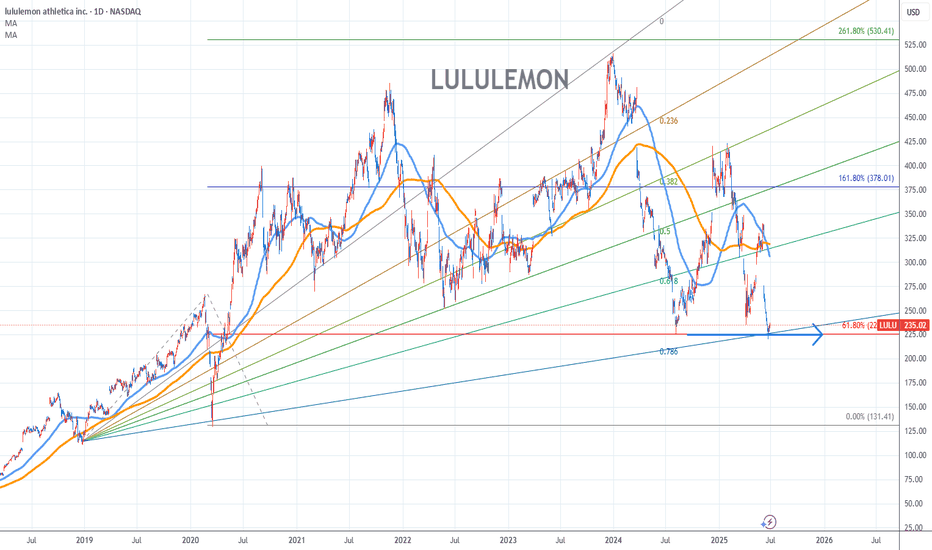
Trading Idea 1) Find a FIBO slingshot 2) Check FIBO 61.80% level 3) Entry Point > 225/61.80% Chart time frame:D A) 15 min(1W-3M) B) 1 hr(3M-6M) C) 4 hr(6M-1year) D) 1 day(1-3years) Stock progress:C A) Keep rising over 61.80% resistance B) 61.80% resistance C) 61.80% support D) Hit the bottom E) Hit the top Stocks rise as they rise from support and fall from...
Trading Idea 1) Find a FIBO slingshot 2) Check FIBO 61.80% level 3) Entry Point > 100,622/61.80% Chart time frame:C A) 15 min(1W-3M) B) 1 hr(3M-6M) C) 4 hr(6M-1year) D) 1 day(1-3years) Stock progress:A A) Keep rising over 61.80% resistance B) 61.80% resistance C) 61.80% support D) Hit the bottom E) Hit the top Stocks rise as they rise from support and fall...
