fxtraderanthony
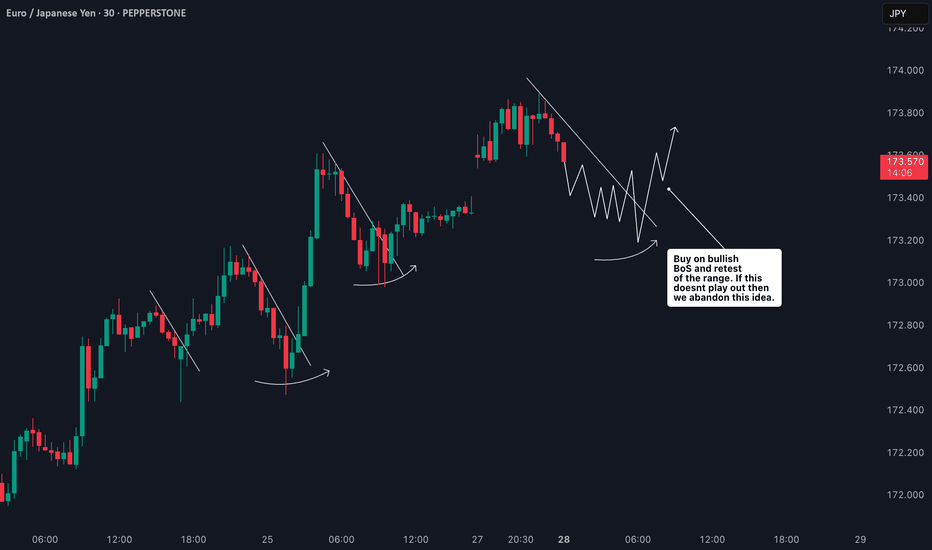
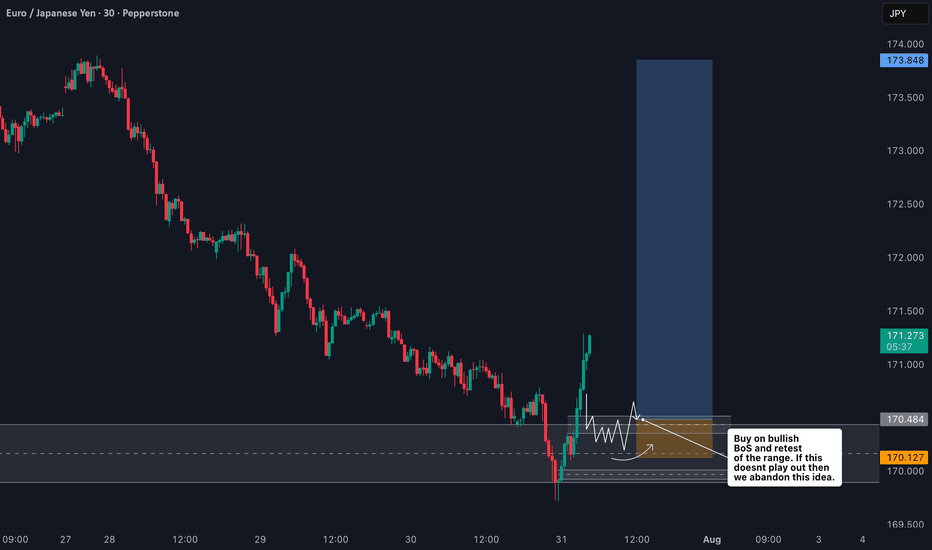
PremiumThe EURJPY is clearly in a strong bullish trend 📈, as shown by a consistent pattern of higher highs and higher lows on the 1H timeframe ⏱️. In this video, I’m looking to capitalize on a pullback as a potential buy opportunity 🎯. We dive into my entry strategy, explore how to align with the prevailing trend, and break down key concepts such as price action, market...
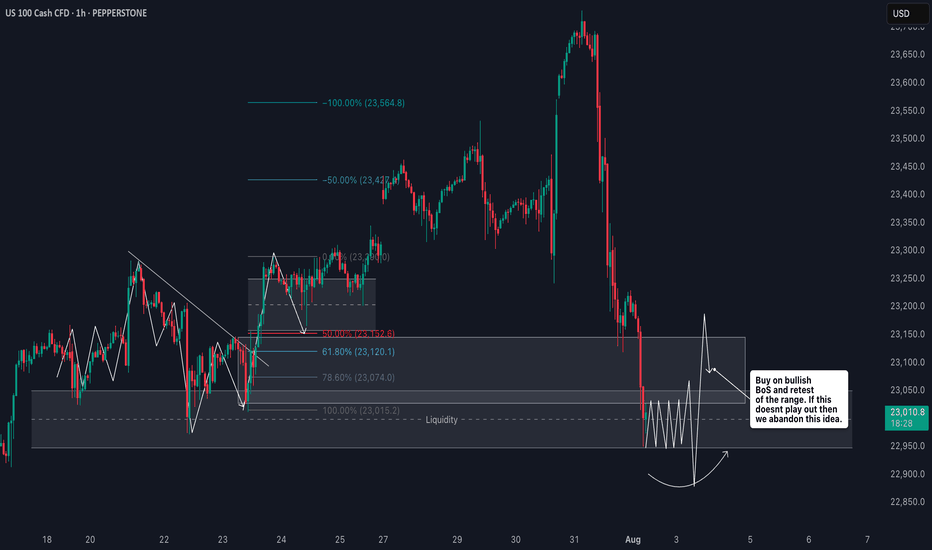
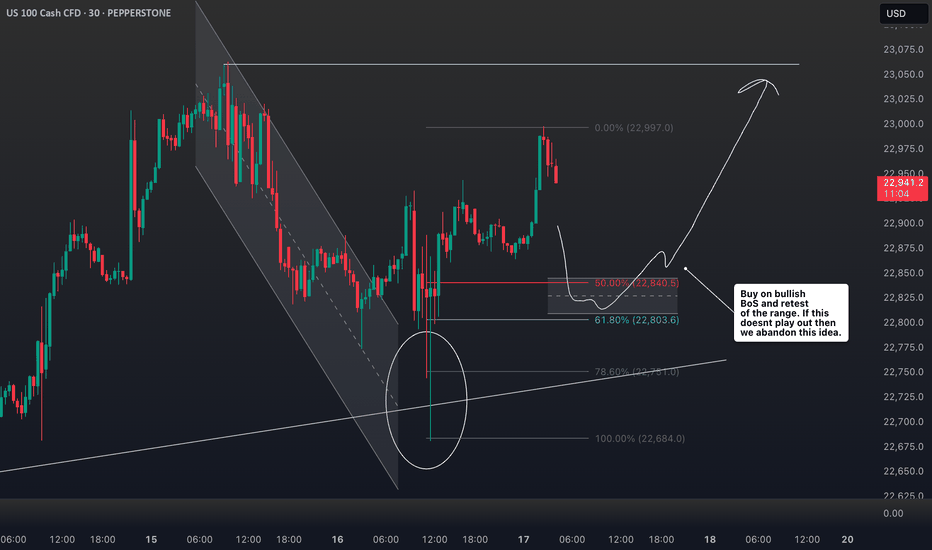
📊 NASDAQ 100 (NAS100) Trade Outlook 📈 The NASDAQ 100 is holding a strong bullish trend on the higher timeframes 🟢. However, we’re currently seeing a notable pullback into a key support zone ⚠️ — price has dipped beneath previous lows, tapping into what appears to be an institutional accumulation range 🏦. This move is likely targeting the liquidity resting below...
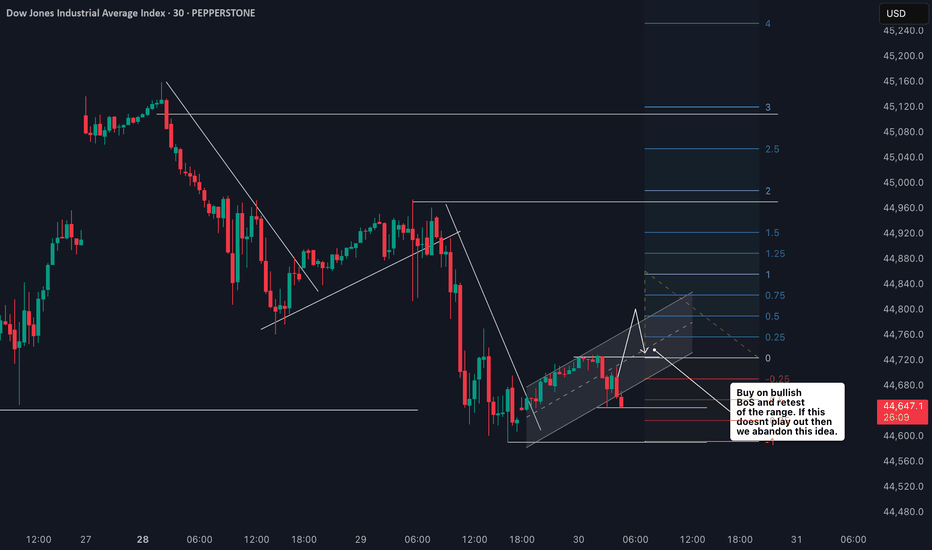
📈 US30 (Dow Jones) is currently in a strong bullish trend 🔥. This is clearly visible on the 4H chart, where we’re seeing a consistent pattern of higher highs and higher lows 🔼🔼. 👀 I’m watching for a potential long opportunity, especially since the higher timeframes remain firmly bullish 🟢. 🎥 In the video, we break it down: A quick overview of the 4-hour...
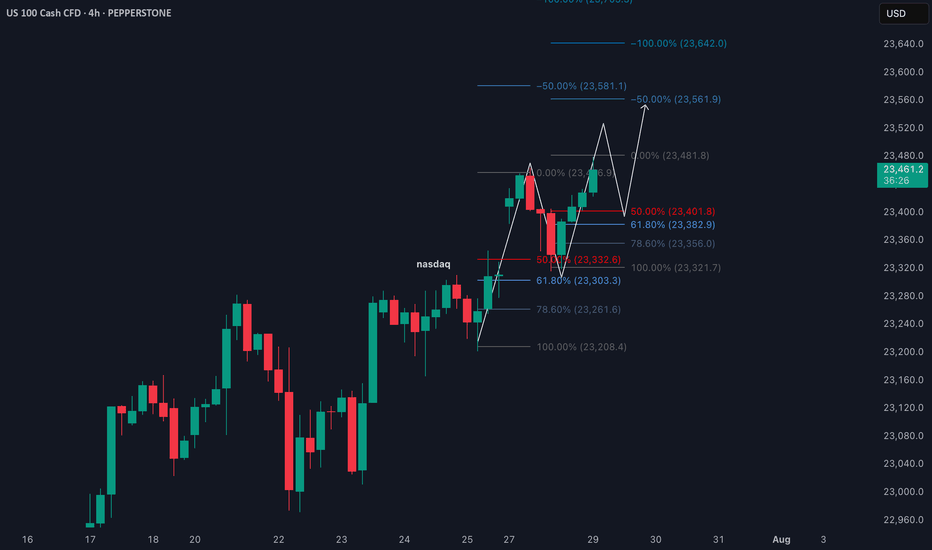
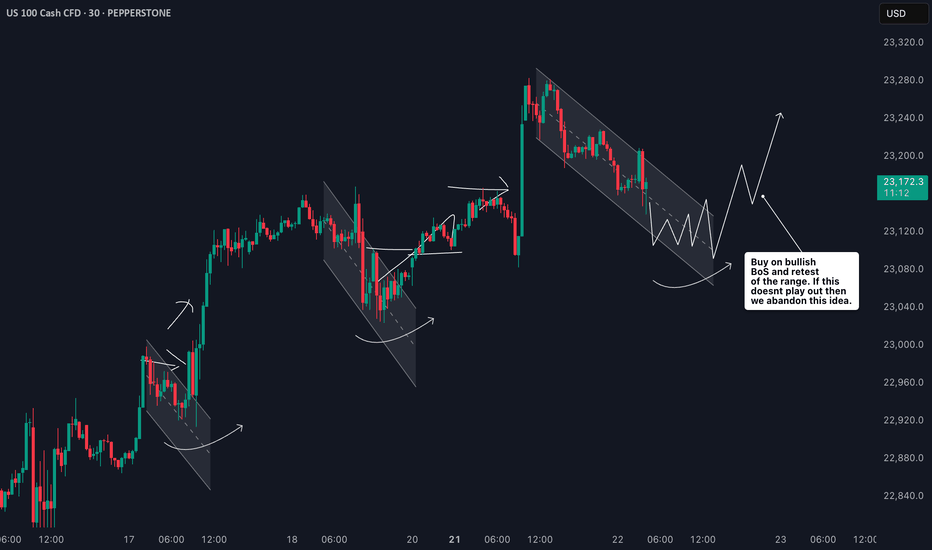
📈 NASDAQ 100 (NAS100) is holding a strong bullish trend 🚀. After a weekend gap-up 🕳️➡️📈, price retraced back into the gap zone—exactly what you'd expect in a healthy trending market. 🔍 I'm applying my Fibonacci Expansion + Retrace Strategy 🔢, watching closely for a pullback into equilibrium ⚖️ within the previous price swing. That’s where I’ll be waiting for a...
📈 EURJPY Analysis Update 🔍 I'm currently watching EURJPY closely. On the weekly timeframe, the pair is clearly in a strong bullish trend 🚀. Price has recently tapped into a previous daily bullish order block 🧱 — a key zone of interest. Now, I’m watching for a break of structure (BoS) 📉 followed by a bullish continuation, especially if price pulls back into the...
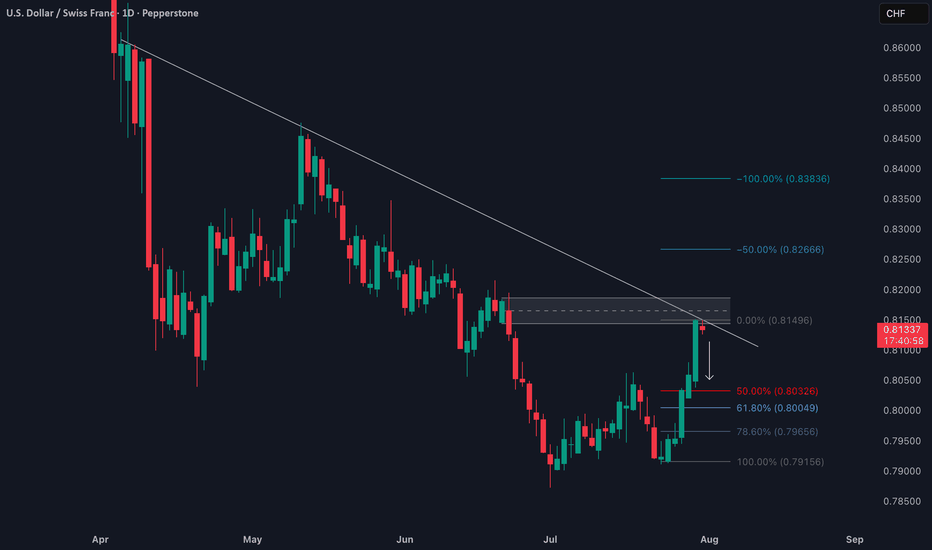
📉 USDCHF remains firmly in a downtrend on both the weekly (1W) and daily (1D) timeframes. The recent bullish retracement is now confronting a critical resistance zone 🔒 — defined by a descending trendline and a daily order block between 0.8150–0.8200. 🧱 Price action at this level shows clear signs of rejection, aligning with a bear flag formation, which could...
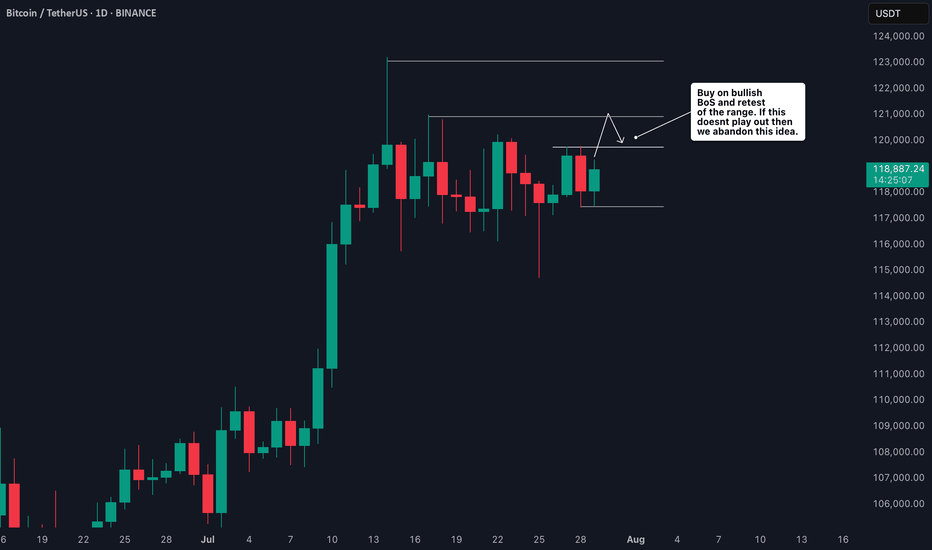
🟠 Bitcoin (BTC) is currently trading range-bound on the daily timeframe ⏳📉📈. I’m monitoring price action for a bullish break and retest 🔓🔁 of the current range to confirm a potential long entry 🎯. 📍 Key levels are already marked on the chart 🗺️— 🛑 Stop-loss would sit just below the previous swing low, 🎯 Target aligns with the higher price zone marked out to the...
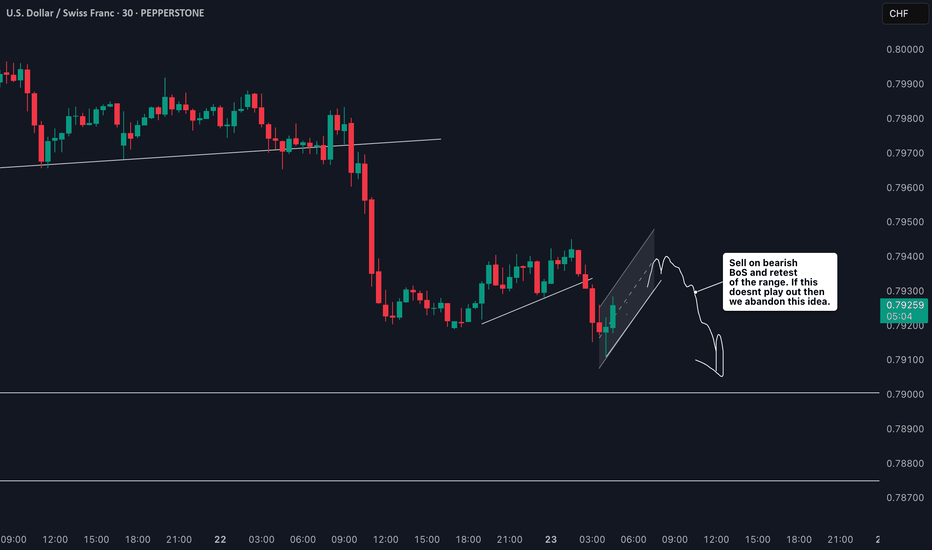
📉 USDCHF Trade Idea Breakdown Taking a close look at USDCHF, we’re currently in a clear downtrend 🔻. Price is under pressure on the higher timeframes, but on the lower timeframes (15m & 30m), we’re seeing a pullback 🌀. What I’m watching for now is a rejection at resistance 🔄 followed by a bearish break in market structure ⛔️. If that confirms, I’ll be looking to...
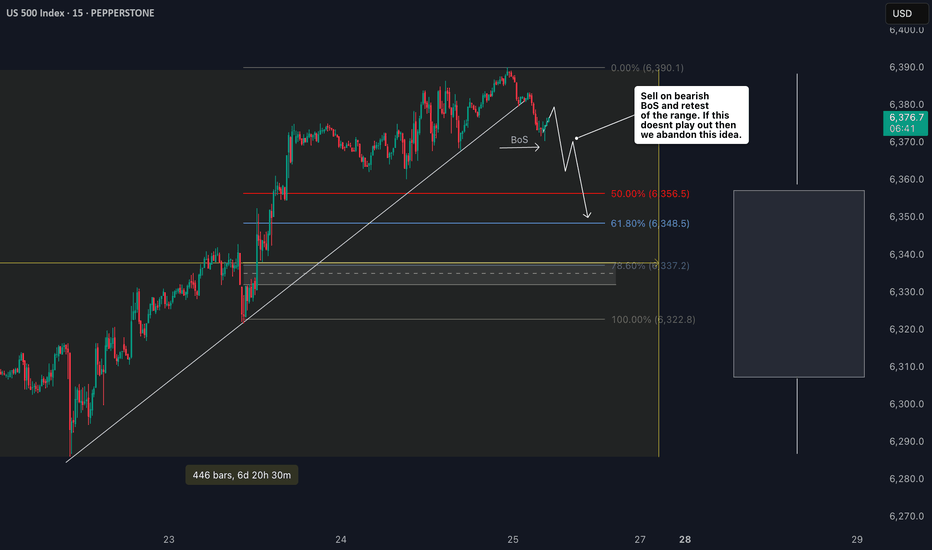
Currently watching the S&P 500 (US500) closely 👀. The index has been in a strong bullish trend 📈, but I’m now evaluating a potential counter-trend opportunity. Given the strength we’ve seen this week — possibly a “foolish rally” — there’s a chance we’ve either printed or are close to printing the high of the week 🧱. That opens the door for a retracement setup,...
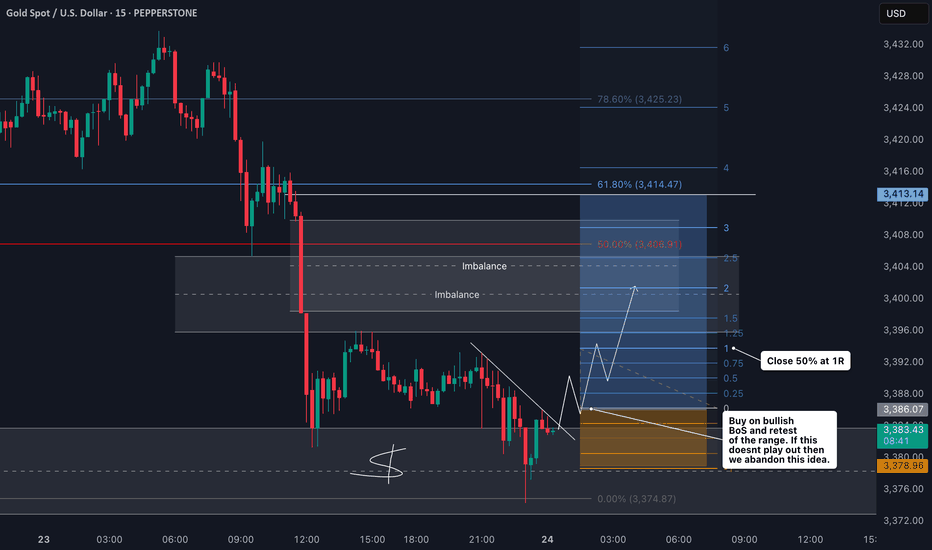
🚨 Gold Update & Trade Plan 🚨 Taking a look at Gold (XAUUSD) right now — it's been trending strongly in an uptrend 📈, showing impressive momentum over the past sessions. However, we've recently seen a deep pullback 🔻 that has tapped into a key liquidity pool 💧. From this level, I'm anticipating a bullish reaction 🔁, and I’m eyeing a potential scalping or intraday...
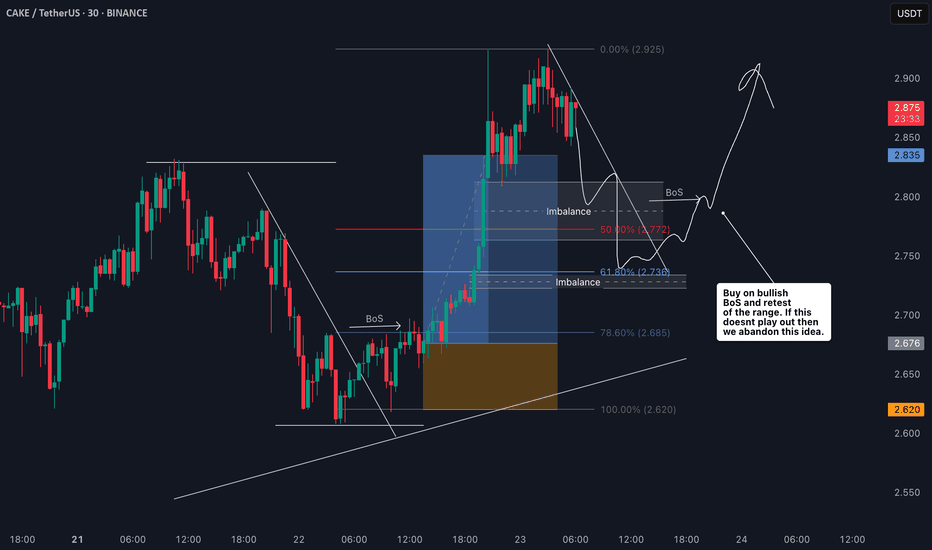
📊 CAKE/USDT Trade Setup Overview Taking a closer look at CAKE/USDT, price action has been moving nicely with a strong bullish trend on the 4H chart — printing consistent higher highs and higher lows 🔼📈. Right now, it’s looking a little overextended, and I’m eyeing a potential pullback into my optimal entry zone around the 50%–61.8% Fibonacci retracement level...
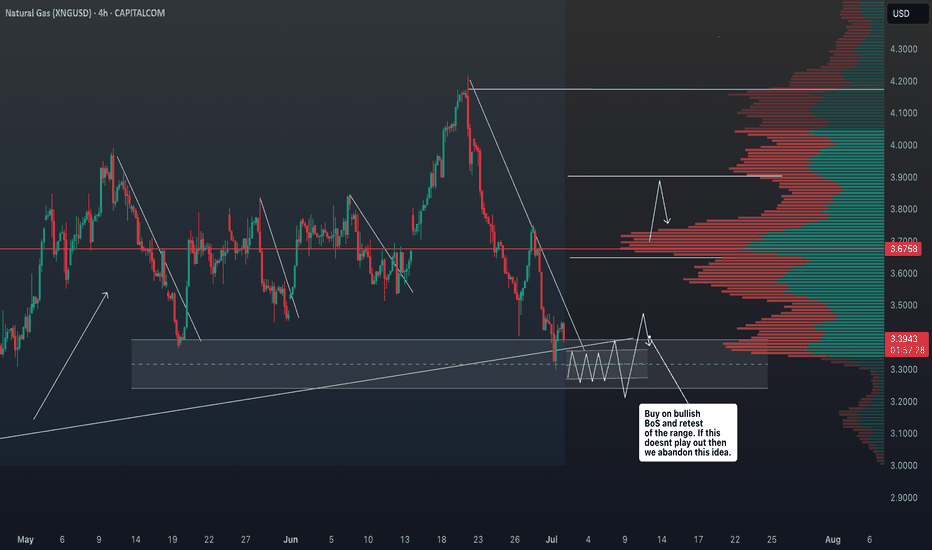
In this video, I break down the current XNGUSD (Natural Gas) chart using pure price action analysis on the daily timeframe. This update builds on my previous post, where I shared a comprehensive outlook supported by fundamentals, including supply/demand imbalances, geopolitical risks, and long-term LNG export growth. In this video, I focus purely on the...
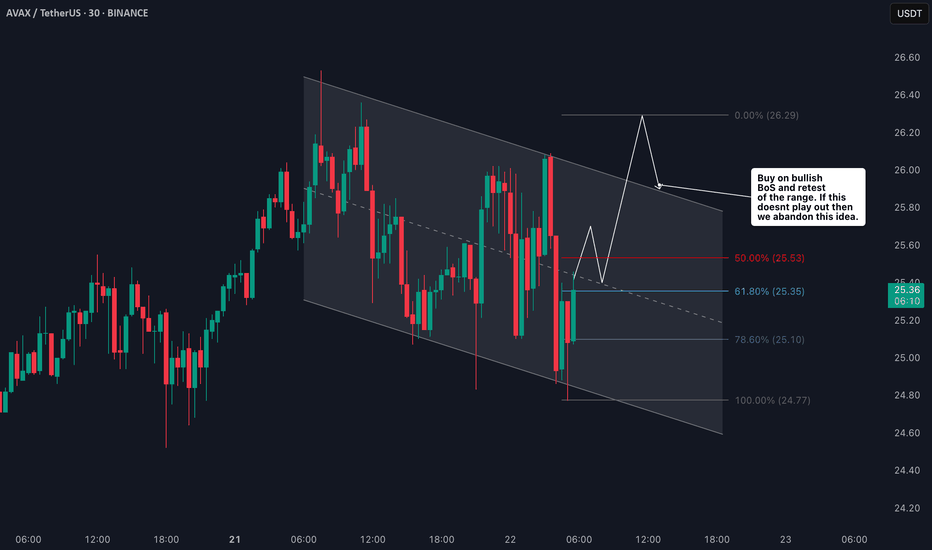
🚀 AVAX/USDT Avalanche is currently in a strong bullish trend 🔼. On the 4H chart, price is pulling back slightly 📉, and I’m watching for momentum to pick up and break above the current range high 📊—that’s where I’ll be looking for the next entry. 🎯 My bias remains long, and in the video I break everything down in detail: 🔍 Price action 🧱 Market structure 📈 Overall...
📊 NASDAQ 100 (NAS100) remains bullish, showing a clean, well-structured uptrend—higher highs and higher lows 🔼📈. Price has now pulled back into my optimal entry zone 🎯. At this stage, I’m waiting for a bullish break in market structure before considering an entry 🟢🔓. Patience is key—let the structure confirm first. Not financial advice ❌💼
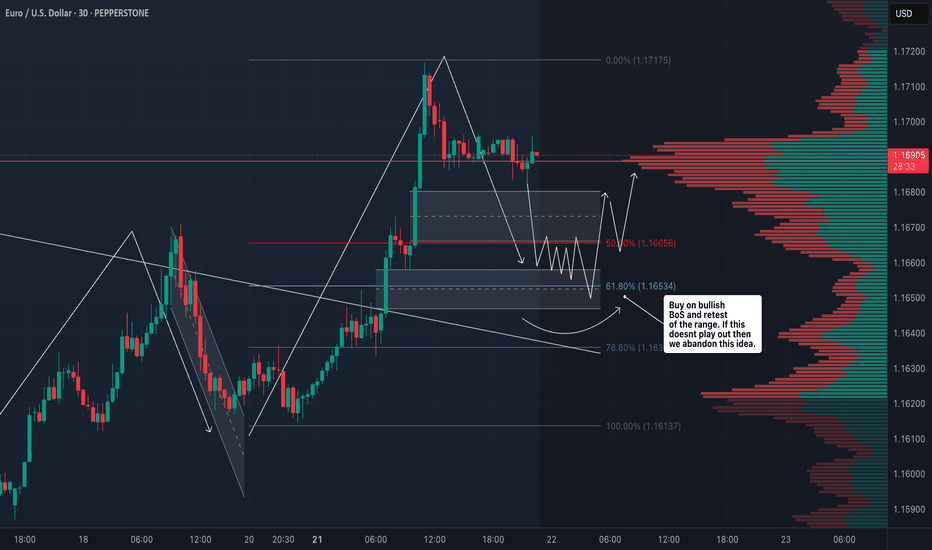
📍 Watching EURUSD closely—it's recently broken bullish (market structure) on the daily timeframe 📈. I’m now waiting for a retrace into a fair value gap, watching for the rebalance and a possible support zone touch before the next leg up 🔄🟢. 🎥 In this idea, I walk you through: 🔍 Price action 🧱 Market structure 📊 Trend direction 📋 And my personal trade plan for...
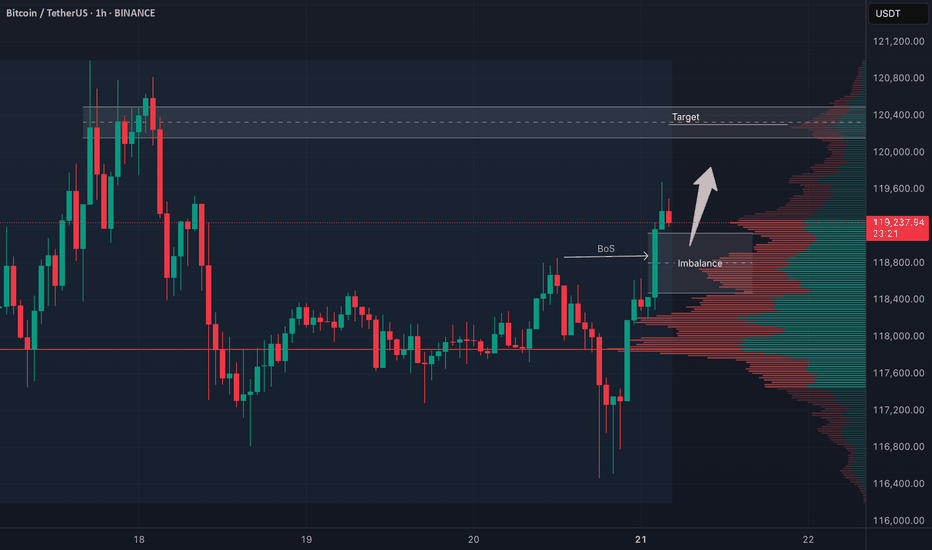
🚀 BTC (Bitcoin) has clearly broken bullish market structure on the 4-hour timeframe. 📈 My bias is to ride the momentum and look for a pullback to enter long. ✅ I follow a specific entry criteria — price must pull back into the imbalance, find support, and then form a bullish break of structure on a 15m chart to trigger an entry. ❌ If that setup doesn't play...
The NASDAQ 100 continues its strong uptrend 📈, recently breaking to new highs after a period of consolidation. The rally is broad-based but remains led by heavyweight tech names and AI-related stocks 🤖. Key Fundamental Drivers: AI & Tech Growth 🤖💡: The biggest catalyst is the ongoing boom in artificial intelligence and digital transformation. Companies in the...
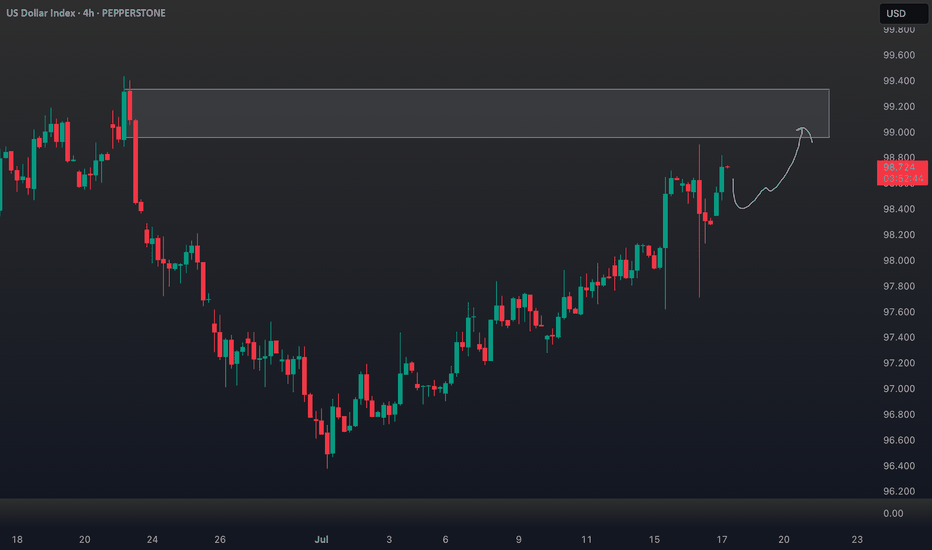
Technical Analysis (4H Chart & Broader Context) 📈🕓 The DXY 4H chart shows a clear bullish trend 🚀, with higher highs and higher lows since early July. DXY has caught a strong bid, breaking above short-term resistance near 98.40 and now eyeing the previous swing high 🎯. This matches the consensus among analysts: DXY remains in a bullish structure, with momentum...
