garrota
EssentialLast seen
Followers
5Following
0Ideas
5Scripts
0Joined Apr 23, 2012
indicator
natgasusd
naturalgas
ng1!
trendanalysis
ugaz
Less Tags
Show All Tags
All Types
Type
All Types
Indicators
Strategies
Libraries
All Accesses
Script access
All Accesses
Open
Protected
Invite-only
Public & Private
Privacy
Public & Private
Public
Private
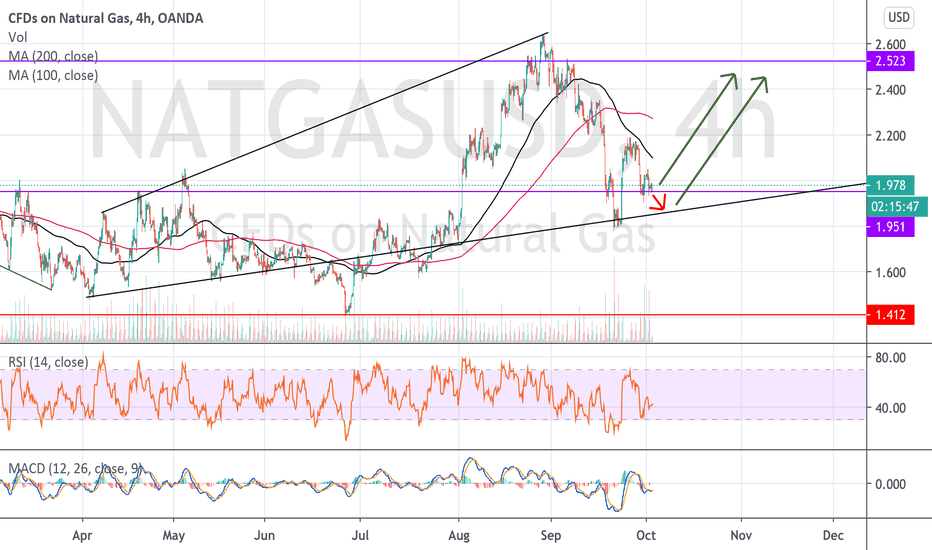
The natural gas graph clearly shows an expanding triangle and we are currently approaching its upper boundary.
1
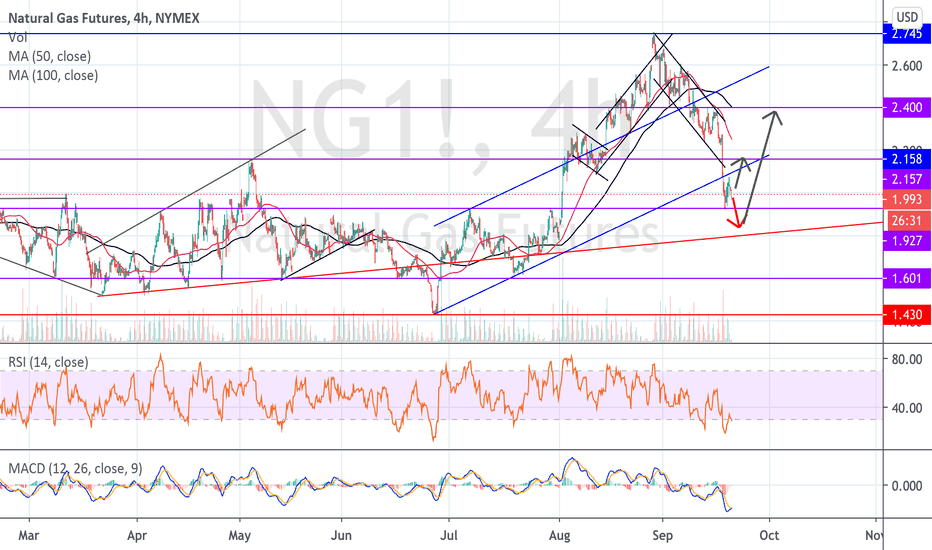
Natural gas completes correction to the previous wave of growth at the support line of the long-term uptrend.
2
A global reversal in the gas market has already occurred, a return to the $ 2 level and a rebound from it will confirm the reversal. The fast approach of the heating season and the tightening balance of supply and demand will support gas prices at a comfortable level above $ 2.
4
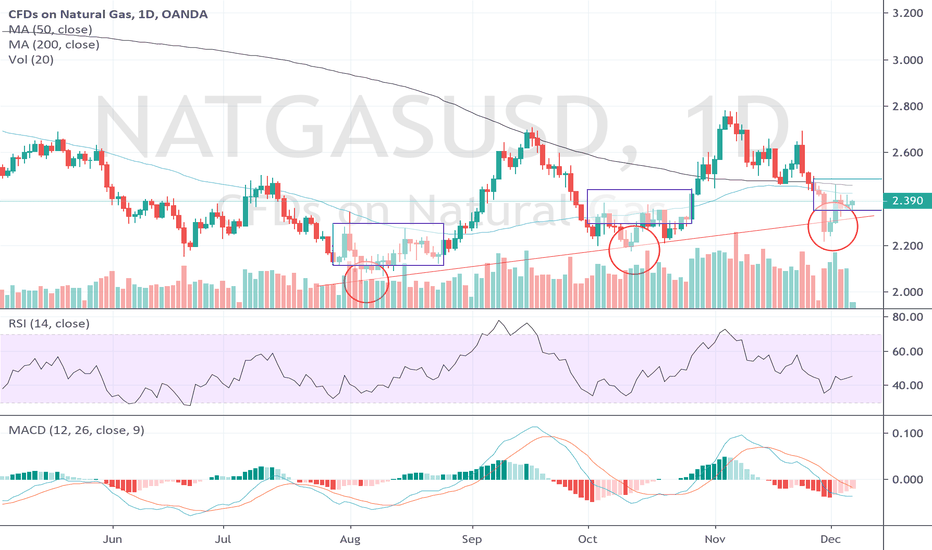
Bullish structure-consistently rising lows and highs. Perhaps the consolidation period before the new wave of growth will last 10-15 days. Growth targets in the region of 2.8-2.9$.
5
0
0
10
Message
Follow
Following
Unfollow
12
0
1
Message
Follow
Following
Unfollow
132
2
280
Message
Follow
Following
Unfollow
0
0
0
Message
Follow
Following
Unfollow
2
0
0
Message
Follow
Following
Unfollow
User follows nobody
Type
Script access
Privacy


