hns2020
EssentialLast seen
Followers
1Following
5Ideas
2Scripts
0
eem
fundamental
trendanalysis
Less Tags
Show All Tags
All Types
Type
All Types
Indicators
Strategies
Libraries
All Accesses
Script access
All Accesses
Open
Protected
Invite-only
Public & Private
Privacy
Public & Private
Public
Private
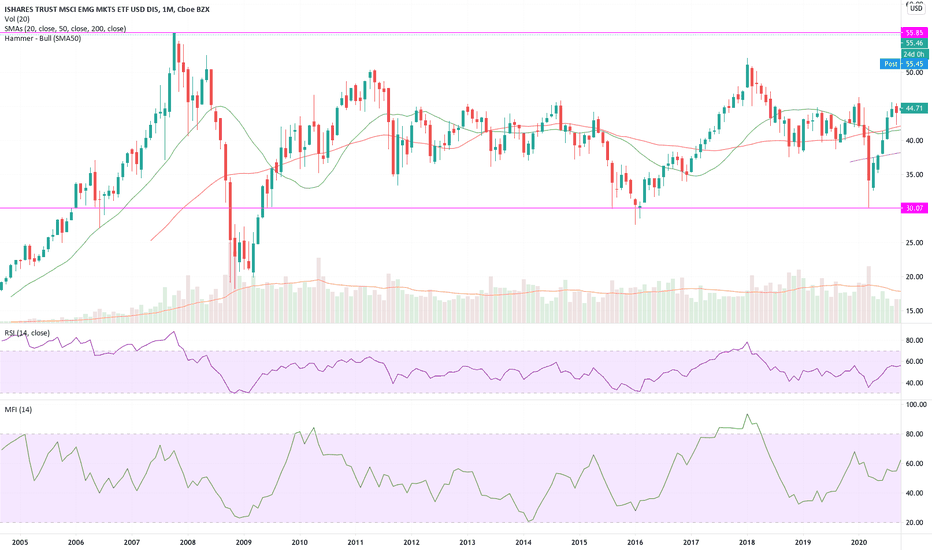
EEM ETF is going to break out from the multi-year bear phase. The monthly chart of EEM Oct 1st, 2007 was 55.83$, the current price is very close and looks bullish for the long term with 0% interest, and the US $$ money flowing to EEM is inevitable. EEM will outperform S&P.
0
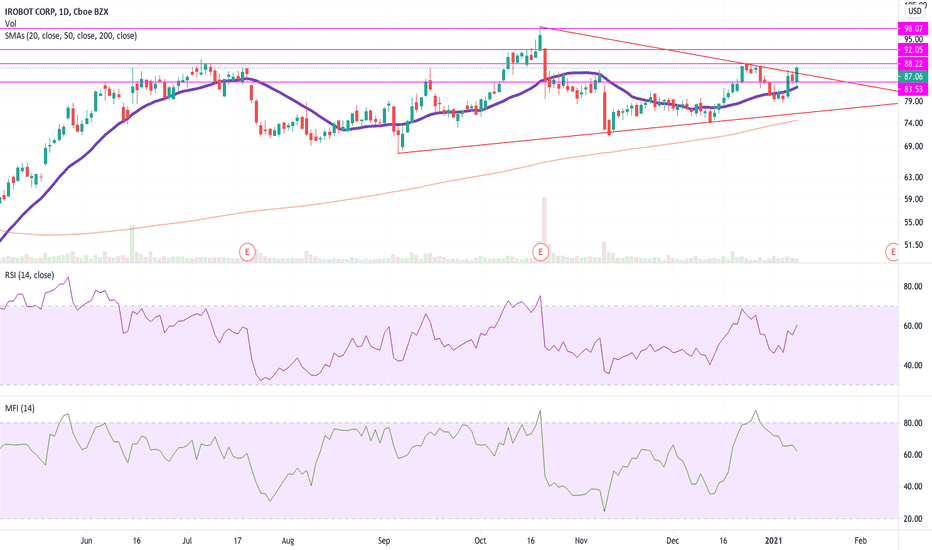
Breakout in IROBOT (IRBT) RSI at 60 and break in the trend line , only issue is volume is low today. Can wait how it behaves tomorrow. Resistance $88.26 ,$92 ,$98 and support $83.69 for stop loss at $83.50. Revenue: $1.3 billion Market Cap: $2.23 billion , I feel stock is undervalued.
2
1
0
0
Message
Follow
Following
Unfollow
1019
8
211
Message
Follow
Following
Unfollow
234
63
145
Message
Follow
Following
Unfollow
424643
425
67670
Message
Follow
Following
Unfollow
106
3
11
Message
Follow
Following
Unfollow
1
0
0
Message
Follow
Following
Unfollow
Type
Script access
Privacy


