Is it time to invest in NASDAQ:TLT ? It looks positive to me. With inflation cooling down it looks like bond prices could increase, which means rates are lower. We do have a Fed Meeting coming up so there could be more volatility depending on the “Feds” messaging. I am taking this long today with a ½ size position. I will place my stop just “below” yesterdays...
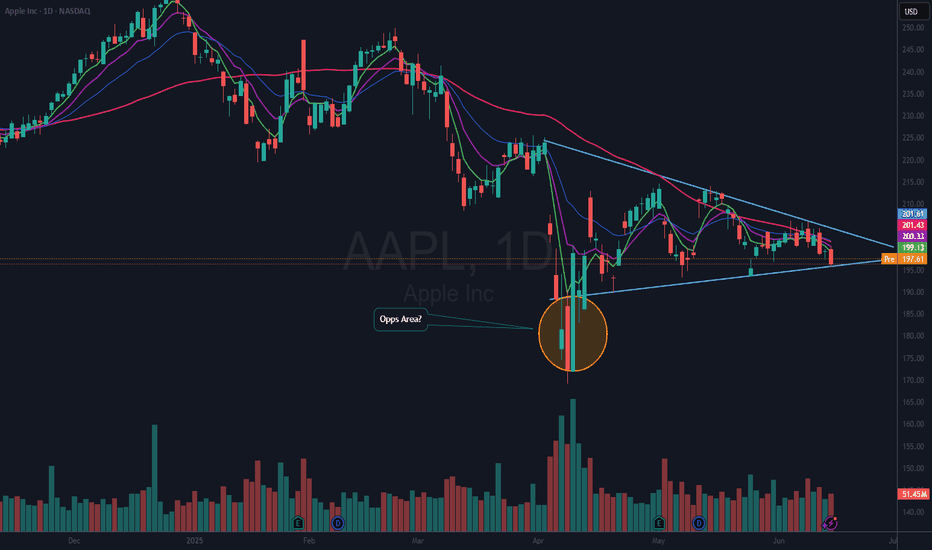
NASDAQ:AAPL is consolidating here in a wedging pattern. I do not know which way this will resolve. But, since I rarely if ever short, I am looking on the long side of a trade. The thing I like about a consolidation pattern like this is, you know when you are wrong very quickly. My plan is to take a ¼ size long position if / when it moves above the 50 DMA (red)...
NASDAQ:DASH looks like it is getting ready to break out. It is only $11 off, its 52-week high. Recent upgrades increased price targets to $235 and $240. One could look at the chart pattern and say it is a complex reverse head and shoulders, and today’s bar found support right at the neckline. I have been in this name for about 2 weeks as it recovered the 50 DMA...
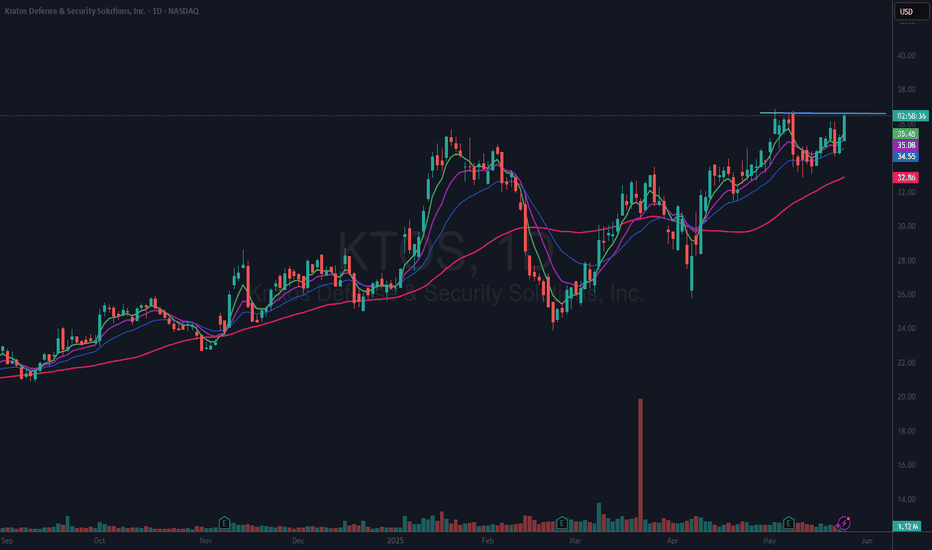
NASDAQ:KTOS is a small cap stock with the potential for big gains. They are in the Defense and Security sector and could benefit from U.S. military spending. It is also very liquid with over a million shares traded daily. This stock is sitting near all-time highs here and looks like it is ready to break out. But it could be a double top as well. I have been in...
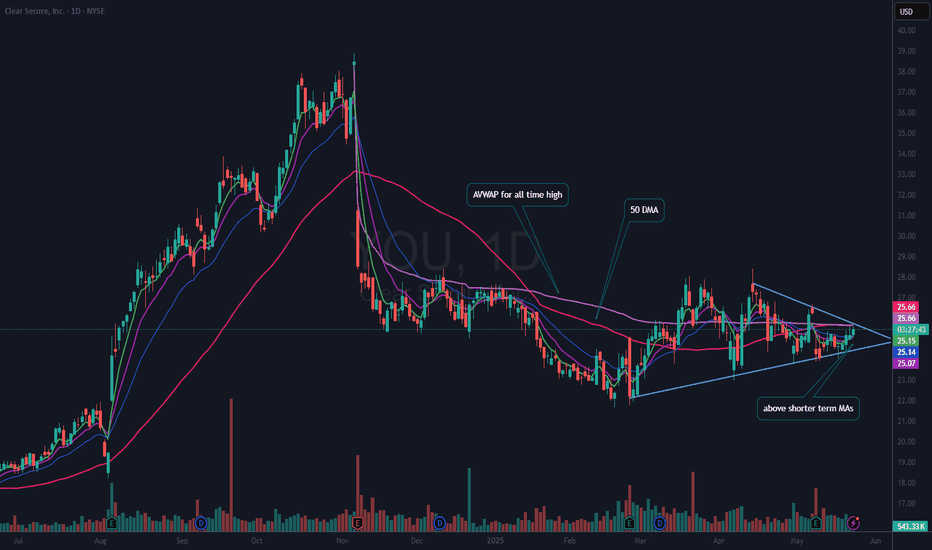
NYSE:YOU is a name I have “thought” could move higher. It is the Clear System at select airports. They continue to expand to other busy airports, and it is an IPO from 2021, so it has had time to squeeze out pure speculation. To be sure this type of wedging pattern can resolve either way. It is more of a consolidation type pattern. I like the fact that it is...
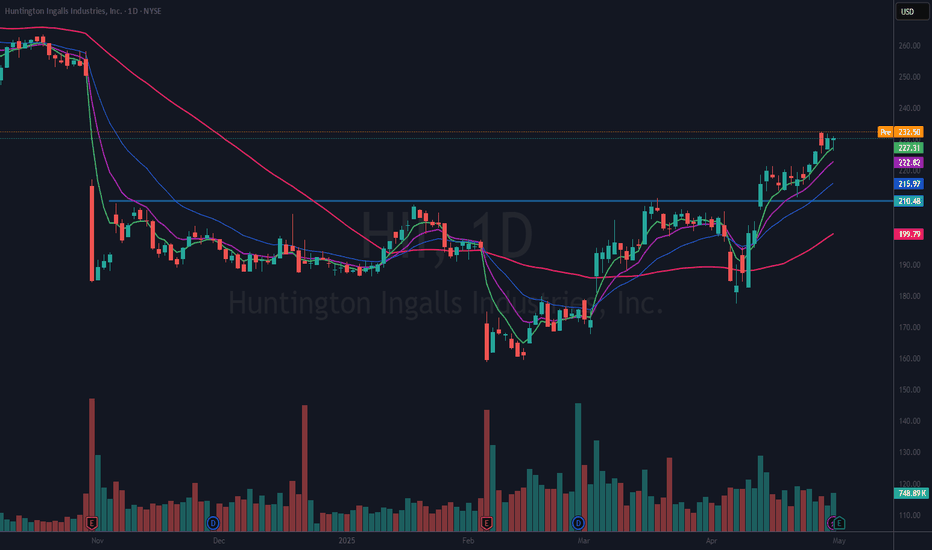
I have been long this name since April 17th. I held through earnings as it has been a slow but steady gainer. Revenue did fall about 2% YOY. However, this is a good candidate for the new ship building initiative. If you like this idea, please make it your own and be sure to follow "your" rules of trading. If you like this idea or any others I publish (and they...
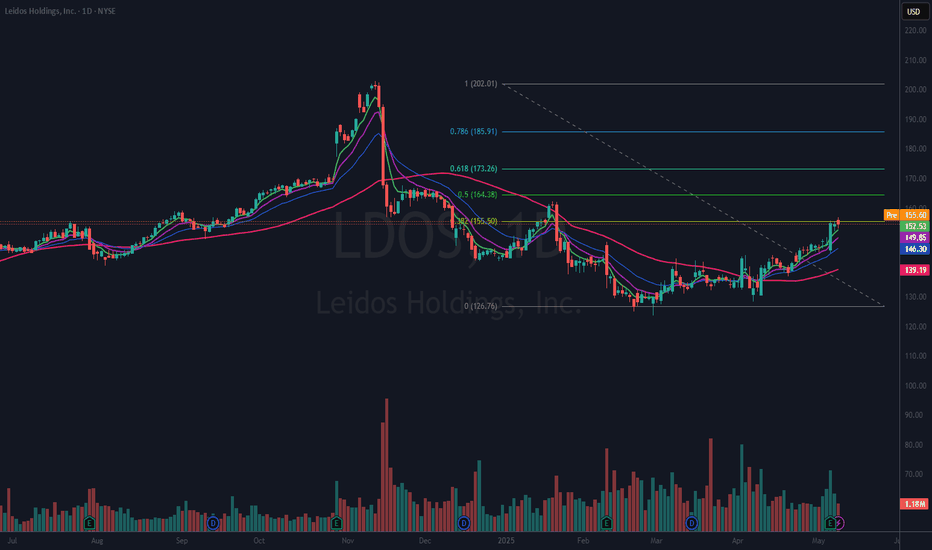
I have been long NYSE:LDOS since March 17th with a ½ size position. I have come close to being stopped out but, my stop never hit. I was up enough that I held through earnings on May 6th. I would expect that it could form a small handle on this cup base, but it may not. I like the fact that it is above all the Moving Averages. I am not an expert at Fibonacci...
NYSE:STZ Has been in a stage one base for about 4 months and is above all the Moving Averages with the fastest on top and slowest on bottom. With the new upgrade can it breakout into a stage 2 uptrend? I have an alert set at just 188.50, right in the resistance area. I will take the trade if it triggers with a stop just below the most recent low of 182.62. That...
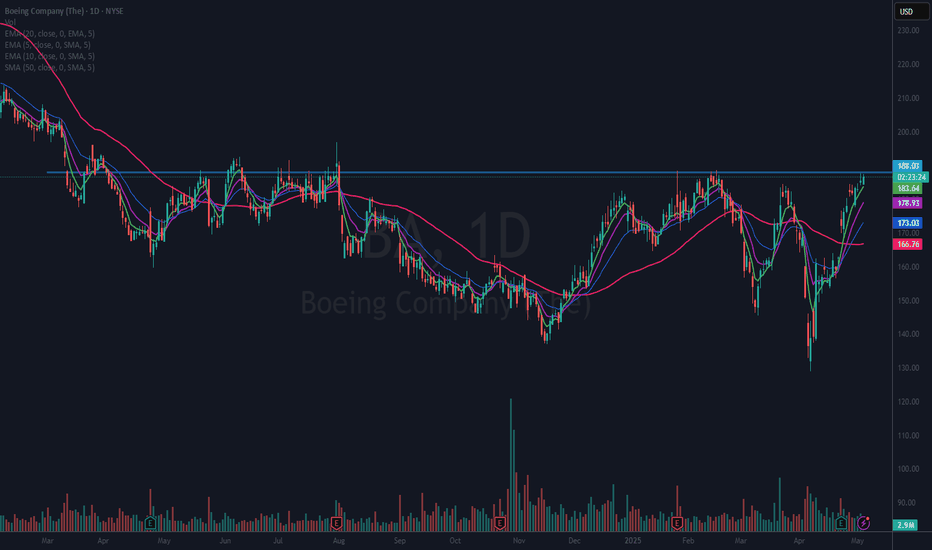
I am already long NYSE:BA since earnings report on April 23 with a full size position. I am looking for this to form a short flat base to allow the 10 (purple) and twenty ema (blue) to catch up. I will be looking to add to my position if that happens and it resumes the uptrend. Since it bottomed out on April 7th it has made about a 45% move. That is why I think...
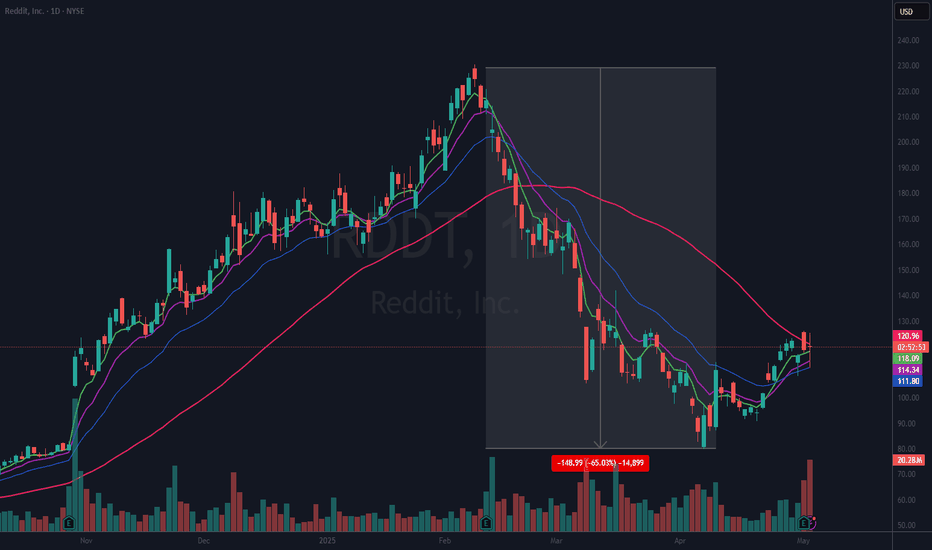
I have taken a position in NYSE:RDDT at $120.50 and I will put my stop on a definitive close under the 21 EMA (blue). At the current price that would be about an 8% stop. (Sometimes I take positions off before they hit my stop loss if it is not acting well.) I am looking for this to retake its prior leadership but it may not. From ATH to lowest low was a 65%...
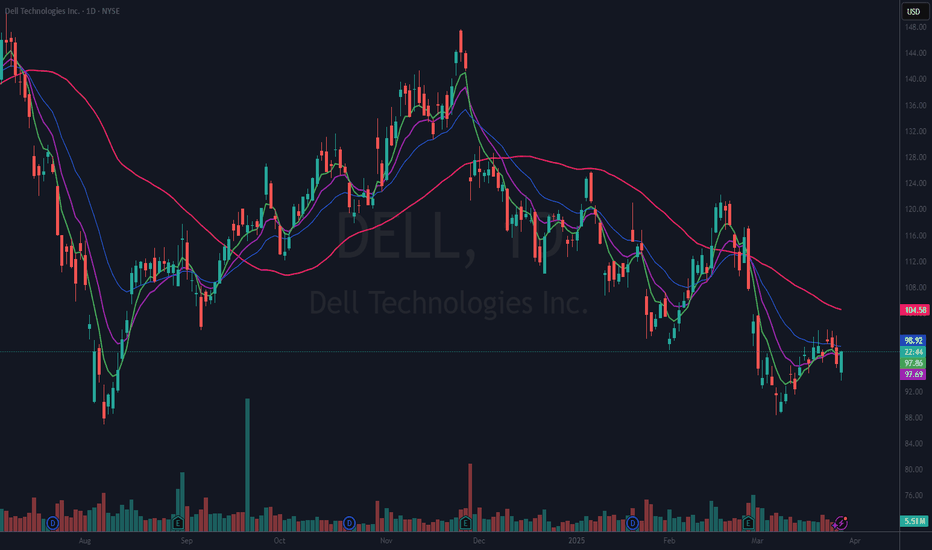
NYSE:DELL I got long on this one Feb 14th and I was stopped out just a few days later. I am looking at it again because they are a big supplier for AI hardware needs, and I think they are over sold. (Just because I think that does not make it so.) Here is what I am looking at. Today’s candle is a clear rejection of heading lower (at least for today). If we can...
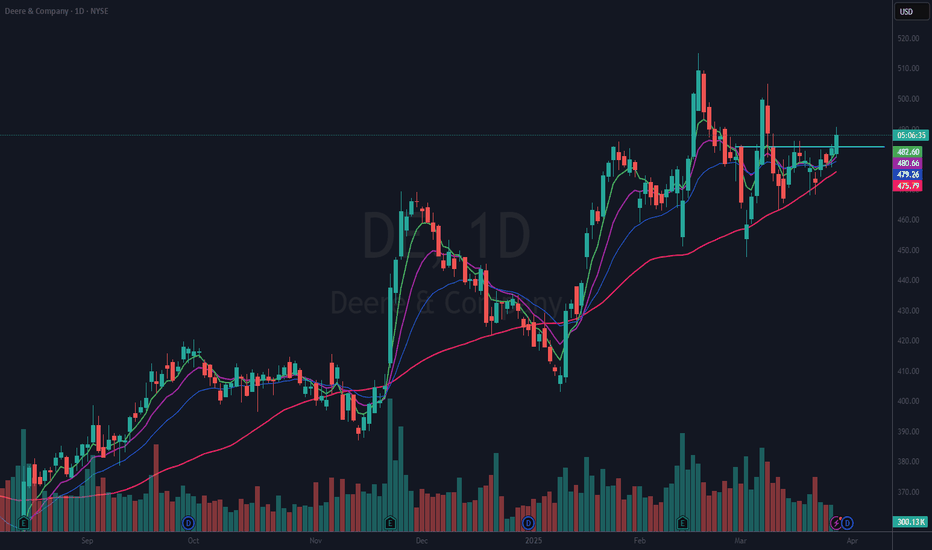
I went long NYSE:DE on Mar 5th after it bounced right back over the 50 DMA (red). It had been choppy, so I waited to add to the position until today. Why today? If you look you can see the pattern of the candles kept getting tighter and consolidating around the shorter term EMAs. I had drawn in what felt to me to be a resemblance of a flat base pattern. It broke...
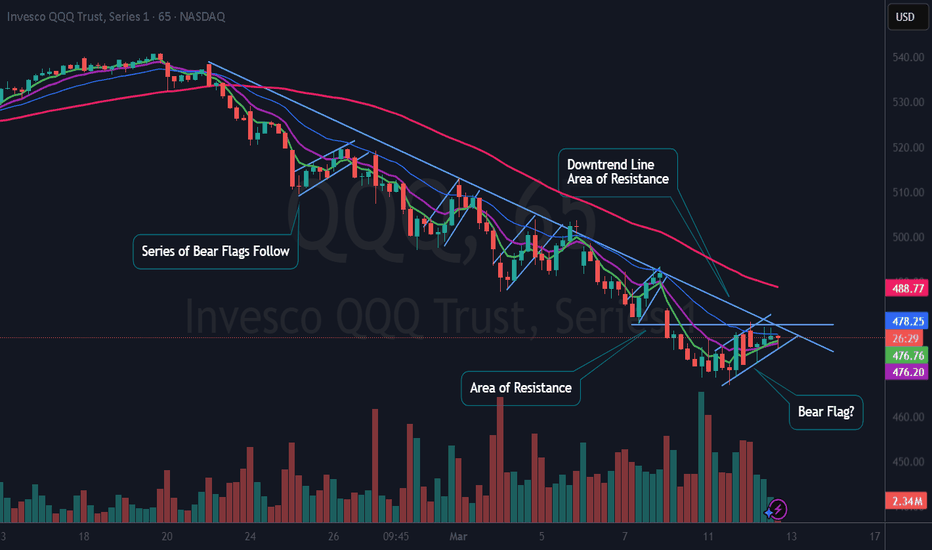
NASDAQ:QQQ For a bull case, I need to see this get above both the horizontal area of resistance and the downtrend line on this 65 minute chart. It looks like it could be forming yet another bear flag. All TBD. If it breaks the flag down, I would expect another leg lower. So what we have here is a case of do or die. Hope this helps
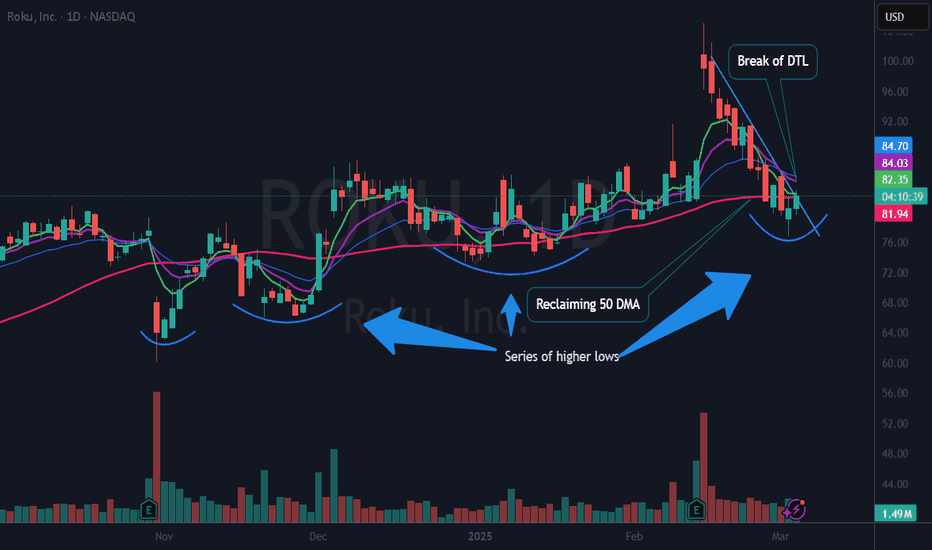
I have taken a 1/2 size position here on $ROKU. It had a nice big earnings gap and has since pulled back. It looks to me that it is now ready to reverse higher. See notes on chart. I have taken the fact that it broke (just barely) the Downtrend Line and put in what looks to be a reversal candle. My stop will be just below yesterday's low. This is my idea. If you...
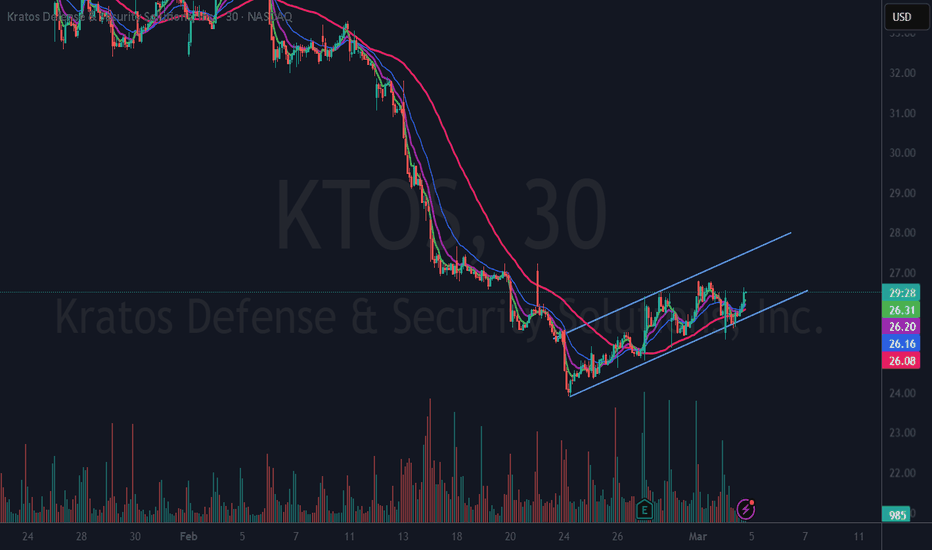
I took this long this morning after finding out that there is some insider buying. It looks like it is in a solid uptrend on this 30 minute chart. If this trade works it can run 20% to 30% in just a few weeks. All TBD. My stop is just below today's low. This is my idea, if you like it please make sure it fits with your trading plan.
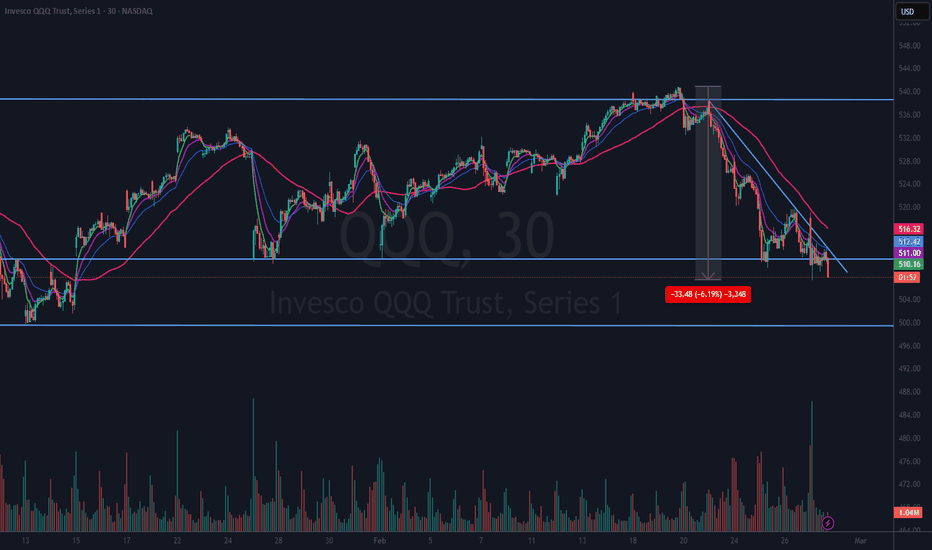
NASDAQ:QQQ I am stalking a bounce on the Q’s. From an intraday high (all time high) to an intraday low on this chart is about 6.2%. I would expect at least a dead cat bounce in the short term, but the market may not deliver for me. Having said that, I have an alert set on this 30-minute chart on the Downtrend line. “If” that triggers, I will go to a 5- or...
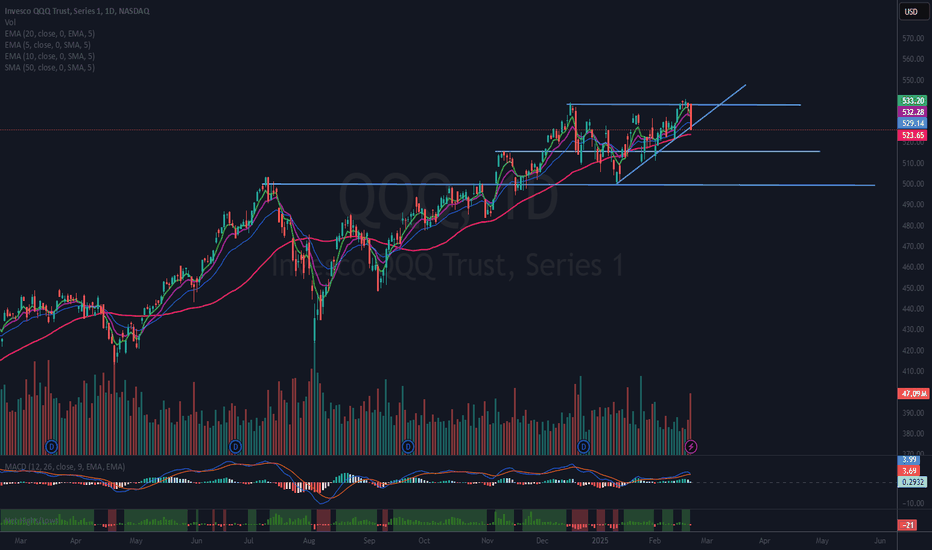
QQQ had a big bearish candle on Friday. If you look left on the chart there were 2 comparable recent days. On Dec 18, 2024, and Jan 7, 2025, both lead to further downside. On Dec 18, the decline before a rally was about 5.3% and the Jan 7 decline was around 4.9%. Friday’s decline was about 2.4%. “If” those declines are any guide, we could expect another 2.5% to 3%...
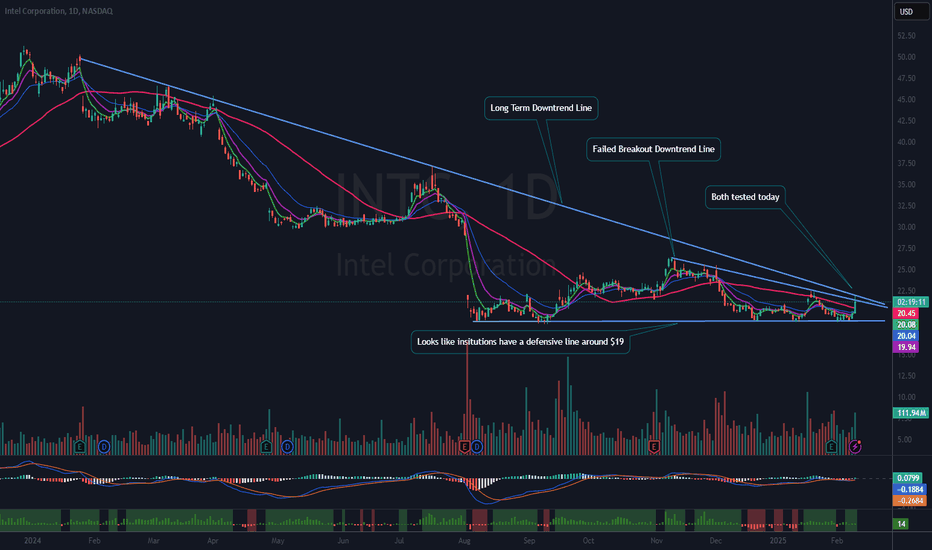
NASDAQ:INTC oh how the mighty fall from grace. But so much for nostalgia. INTC has been basing since August 2024 for over 6 months. It looks like it has support around $19. It has tried to get moving a few times but no go. Today it has tested both the longer term and shorter-term downtrend lines (DTL). It is testing today on the news that JD VANCE said AI will...


