justmaybejustmaybe
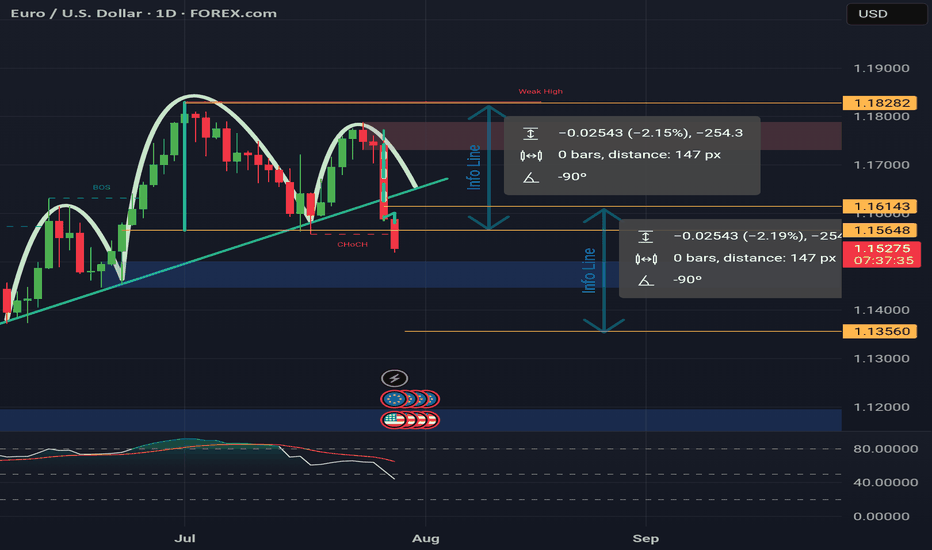
We're currently observing a significant Head & Shoulders pattern forming on the EUR/USD daily chart, with the price just breaking below the neckline on the right shoulder. Applying standard Head & Shoulders trading principles, we measure the distance from the head's peak to the neckline and project that same range downward from the breakdown point. Based on this,...
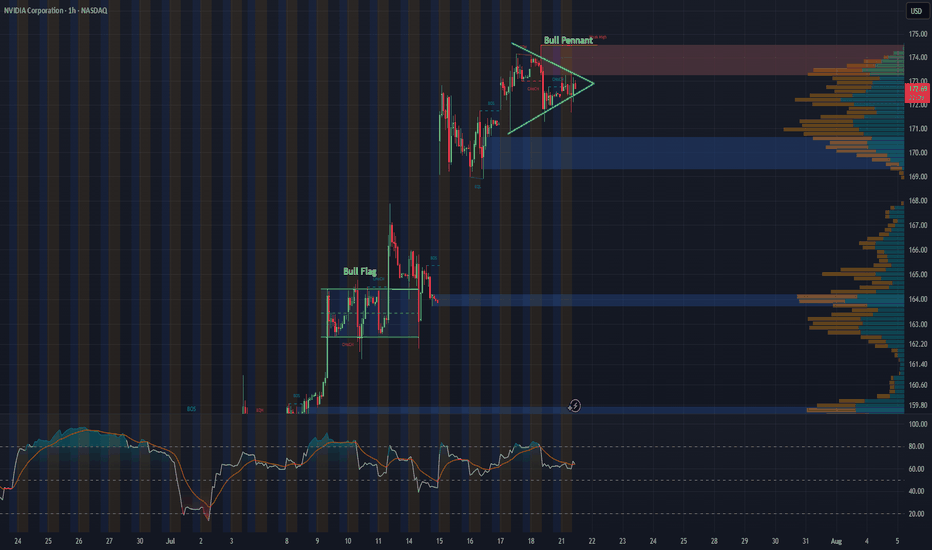
Hey everyone, just wanted to share a quick update on NVDA’s 1-hour chart. Following last week’s bull flag breakout, the stock appears to be consolidating into what looks like a solid bull pennant formation. With major tech earnings on the horizon and the recent approval to sell H20 chips to China, this pattern could be setting the stage for another breakout. Will...
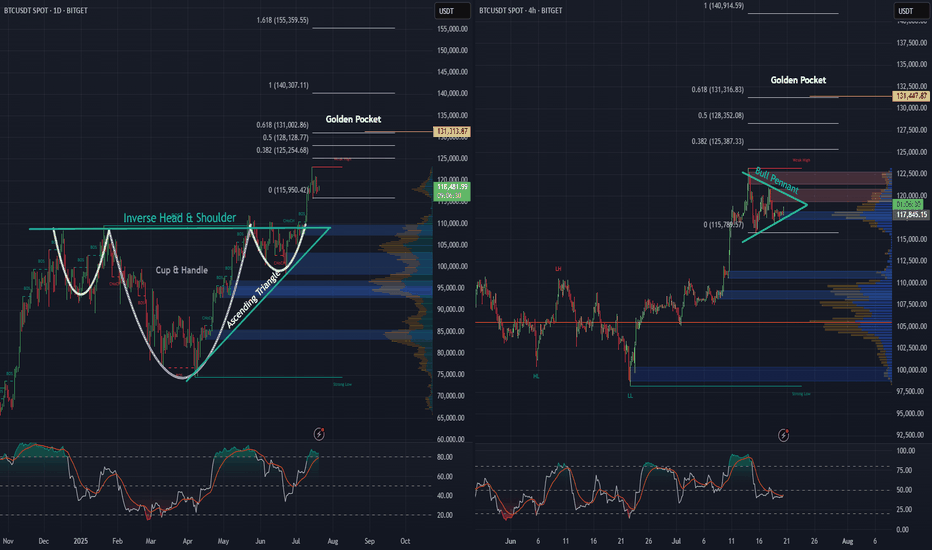
Looking at the Daily and 4-hour charts for BTC, we can see multiple bullish formations unfolding. An inverse head and shoulders - daily A cup and handle - daily An ascending triangle - daily Price action looks strong, as we’ve begun the breakout from the neckline on the inverse H&S, as well as the cup and handle and ascending triangle simultaneously, and...
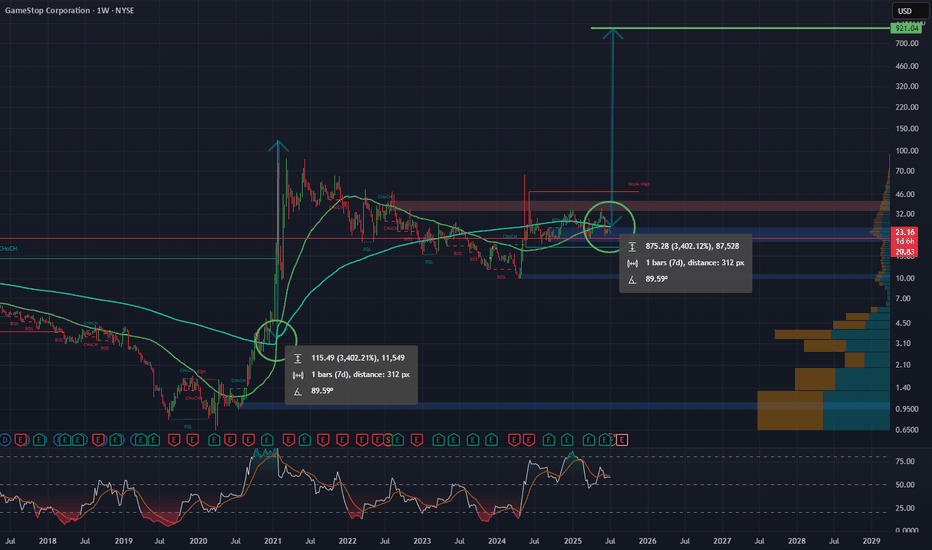
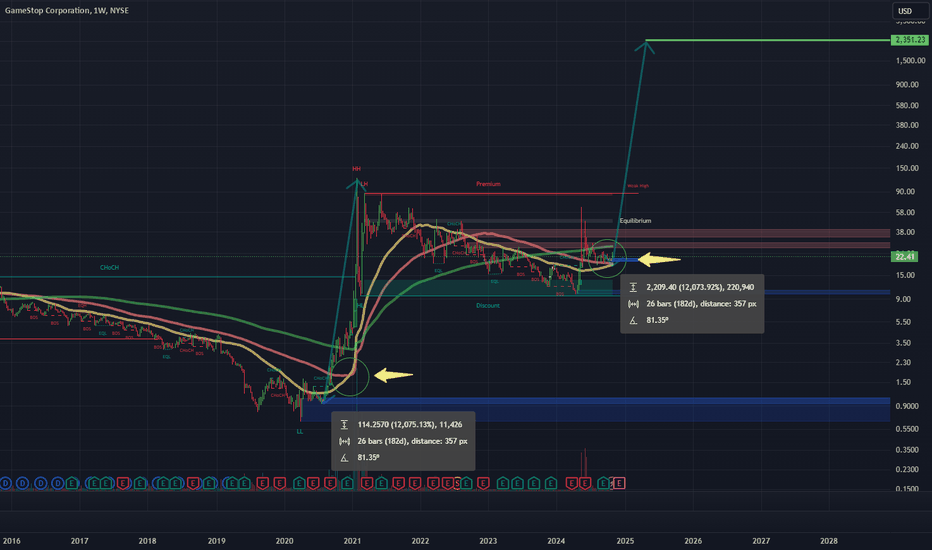
GME Chart Breakdown, Déjà Vu or Destiny? Something big just lit up the weekly chart, the 50 MA has pierced through the 200 MA, forming that golden cross traders dream about. On the weekly timeframe. Not a drill. Now, let’s rewind. The last time this pattern appeared? January 2021. The infamous squeeze. Back then, GME didn’t just nudge upward, it catapulted...
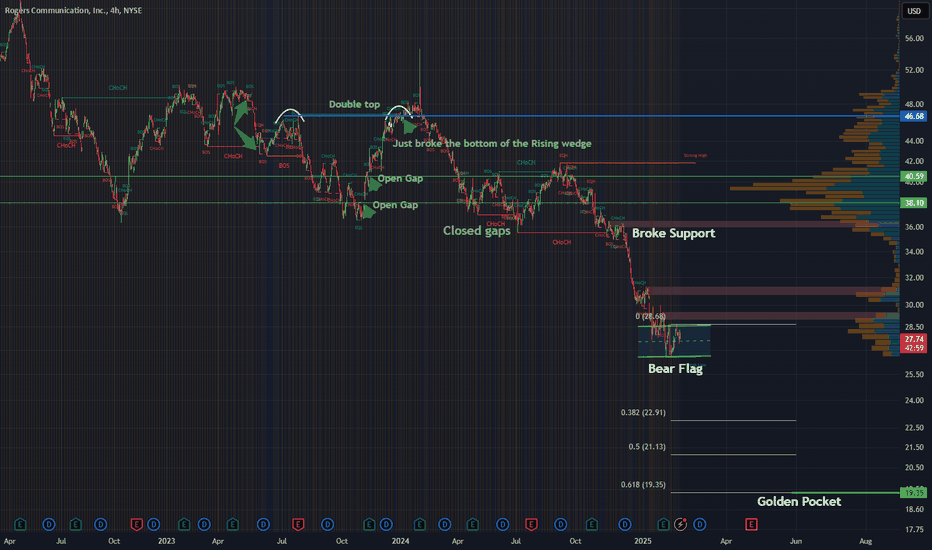
Analyzing both the daily and 4-hour charts reveals a very prominent bear flag, which has formed following a steep decline. This pattern is often indicative of further downward movement, and it's hard to ignore the implications. Word on the street is that they're currently in dire straits. Since the Shaw acquisition, they've hemorrhaged 11 billion in valuation....
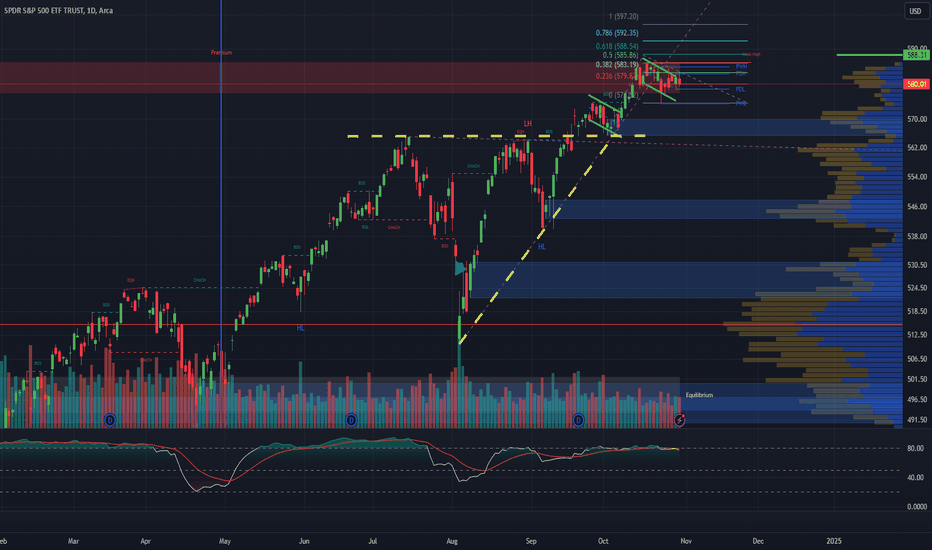
Daily, double Bull Flag, on top of an Ascending Triangle Breakout. Golden Pocket on the Fib Ext is $588 🥂
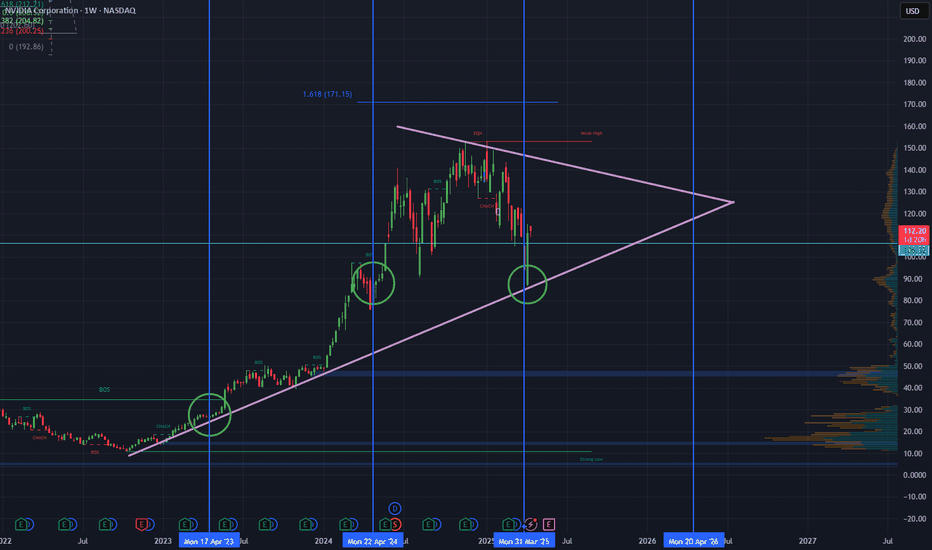
Looking at NVIDIA (NVDA) on the weekly chart over the past two years, a significant gap up becomes apparent around April, which persisted for much of the year. Considering the recent news and the stock's pullbacks lately, this may be the moment for NVDA to resume its upward grind. The coming weeks will reveal its direction. Additionally, it's worth noting the...
Bitcoin's recent price action has been nothing short of captivating for traders and analysts alike. On the daily chart, we've observed the formation of an Inverse Head & Shoulders and a Cup & Handle pattern, both of which have now transitioned into a Bull Flag. These bullish signals suggest a strong potential for upward movement. Zooming into the 4-hour and...
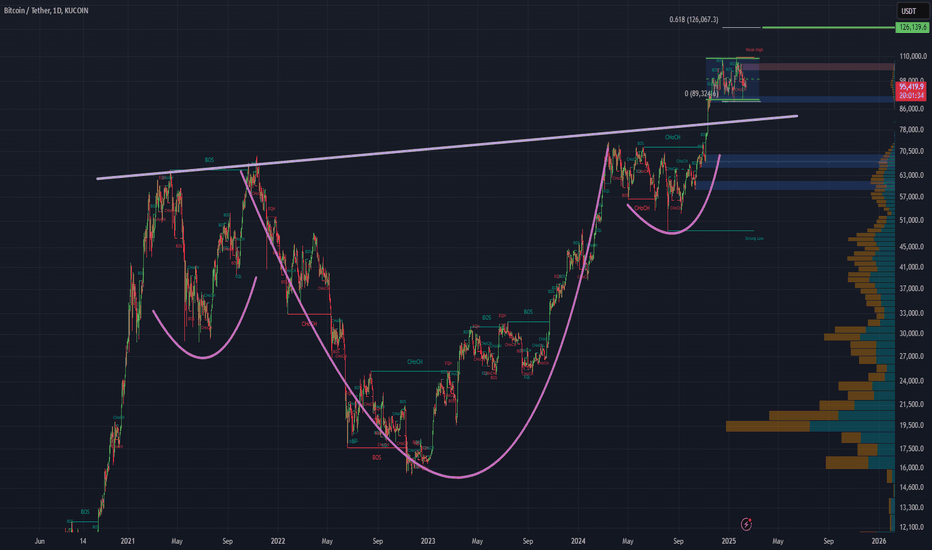
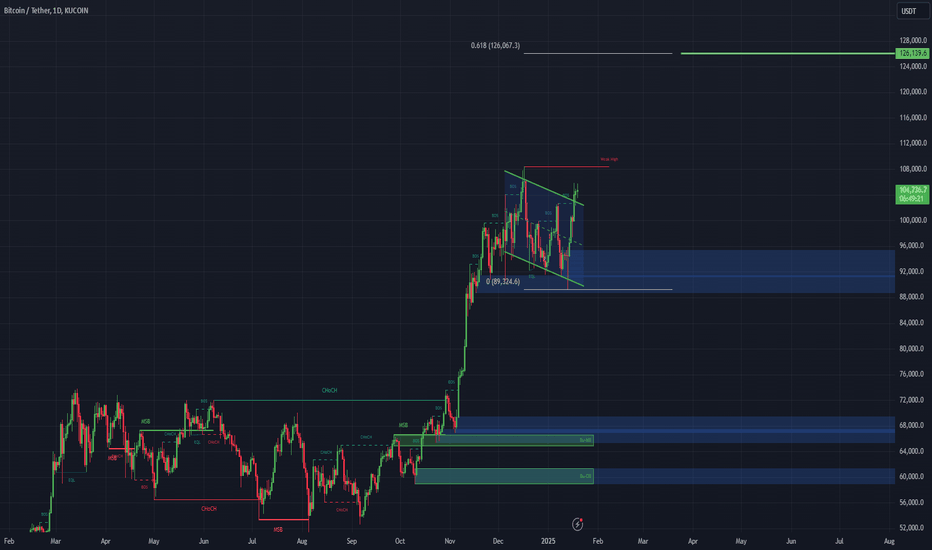
The cryptocurrency market is once again at the edge of a seismic shift. Following the recent uptrend, Bitcoin (BTC) has established a formidable Bull Flag on the daily chart. By utilizing a trend-based Fibonacci extension on top of the current Bull Flag, we can identify the coveted 'golden pocket' positioned at $126,000, with the subsequent target level at an...
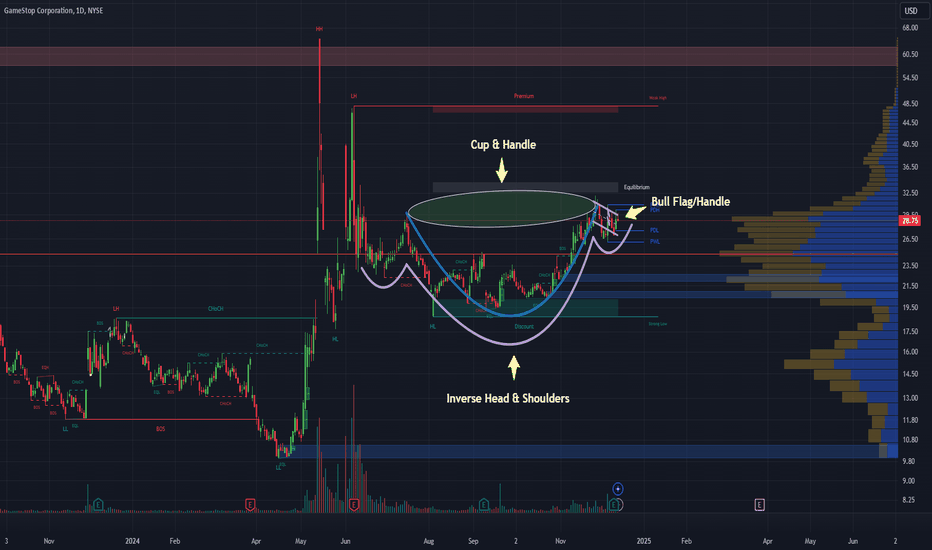
Alright folks, brace yourselves for another electrifying update on the saga of GME! Since our last rendezvous, we've witnessed the impressive cup and handle pattern and the striking inverse head and shoulders breakout. But that was just the beginning. After our latest dip, in tune with the broader market's downturn, we've now sculpted an absolute monster of an...
Hey, everyone. It's that time again for the latest market update on GME. The charts are buzzing with activity, and we have some exciting developments to share. Currently, we are trading within a substantial Bull Pennant on both the 15-minute and 1-hour charts. This indicates strong consolidation and potential for a significant move upwards. Additionally, we have...
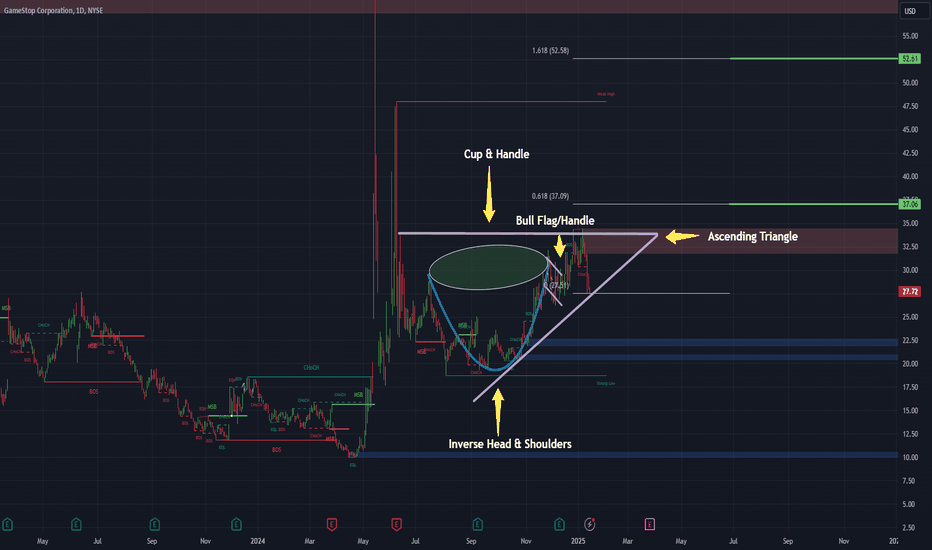
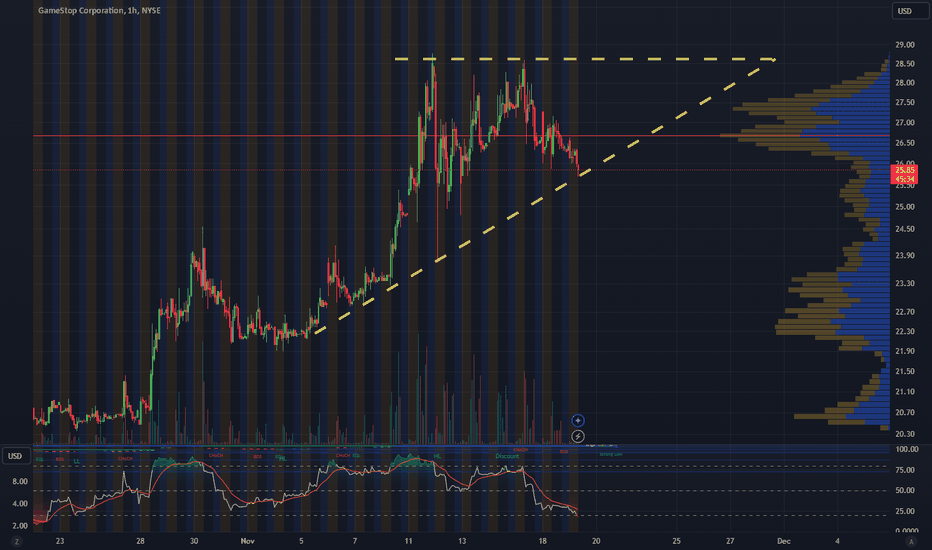
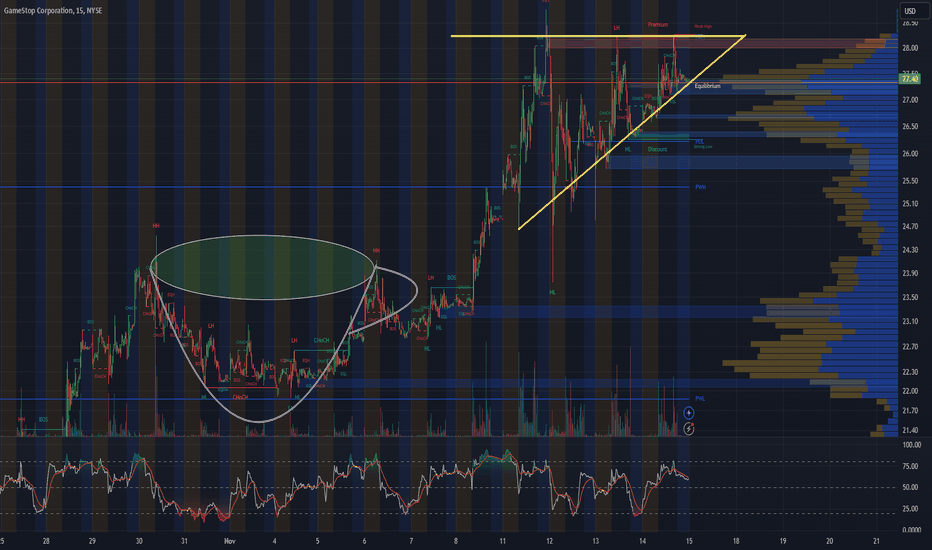
I wanted to update everyone following the TA on GME. It looks like yesterday's sideways movement has widened the Ascending Triangle on the 1-hour chart, which was expected due to the Cup & Handle formation on the daily chart. This sideways movement has now set up the handle on the daily chart and makes for a much larger breakout than anticipated. Here's the...
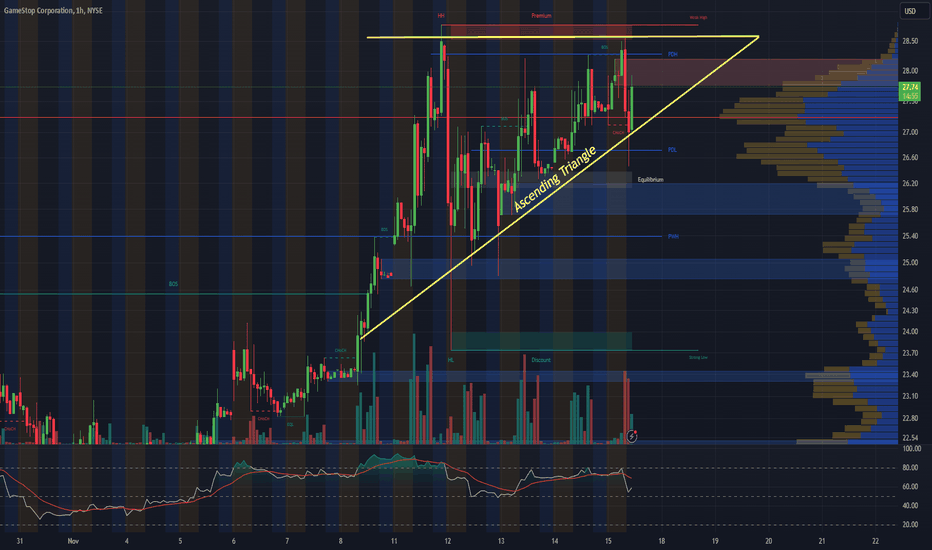
🚀 GME Market Update 🚀 We are excited to announce that GME has now formed a textbook Ascending Triangle on the 1-hour timeframe. We are officially locked and loaded. From the 15-minute chart up to the weekly chart, this setup is exceptionally rare. The anticipated breakout across all timeframes promises to be something remarkable. Here's a detailed...
Hey everyone! Just wanted to give you an exciting update for those tracking the Bull Pennant on the 15-minute chart. As of today, it looks like the Pennant has transitioned into an absolute textbook Ascending Triangle! Here's the breakdown of what we have across all timeframes as of today, 15-minute chart: Ascending Triangle, 4-hour chart: Bull Pennant, Daily...
Watching the 15 min on GME, and it seems that it has formed a pretty substantial Bull Pennant on the 15 min. This comes just after the Cup & Handle breakout earlier this week. We can also see that, the Ultimate RSI has Oversold, while setting a higher low withing the Pennant. I believe that once this Pennant starts to breakout, GME is going to stretch into the...
The last time GME had a Golden Cross like this, we shot up 12,000 % over the span of 6 months. If history repeats itself, we could be looking at around $2,350 per share. It's definitely a shot in the dark, but still worth taking a look at.
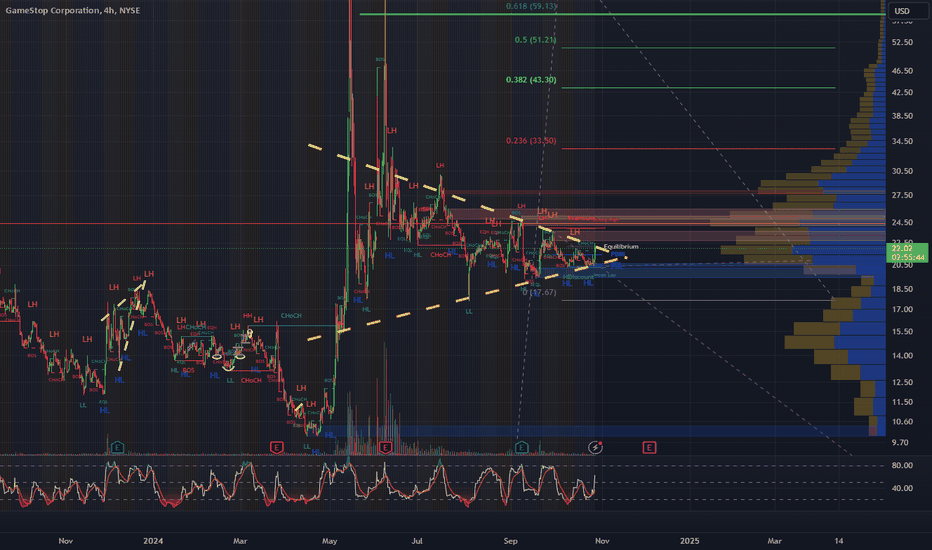
Tracking this monster Bull Pennant on the 4hr. Trend based Fib ext, is projecting a breakout to the $58-$60 range, with no current ceiling in place above the $28 mark on the 4hr. If GME breaks above $62 on the daily, the next stop will be $87... Stay tuned.
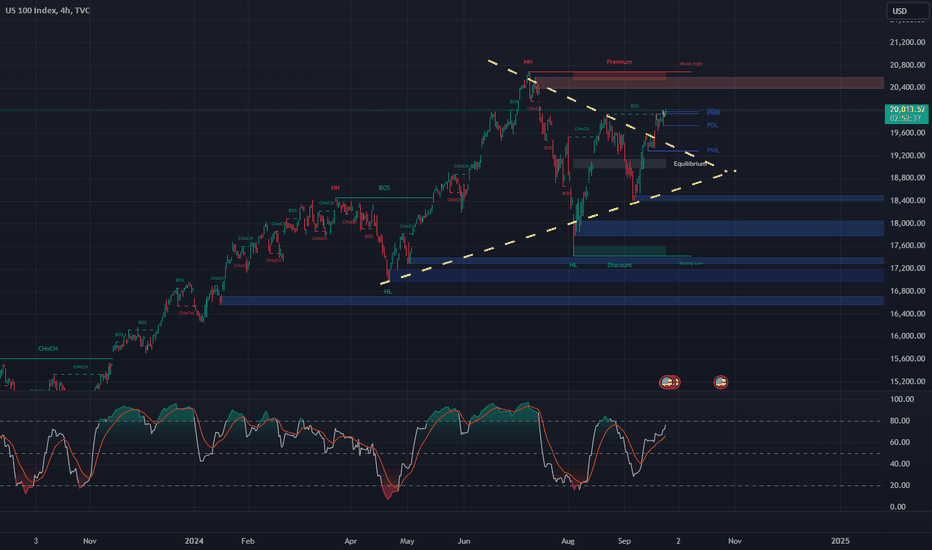
Looking at a beautiful Bull Pennant on NDQ 4 hr. Looks to be breaking out of the upper trend line now. Keeping a close eye on this one.
