justmaybejustmaybe
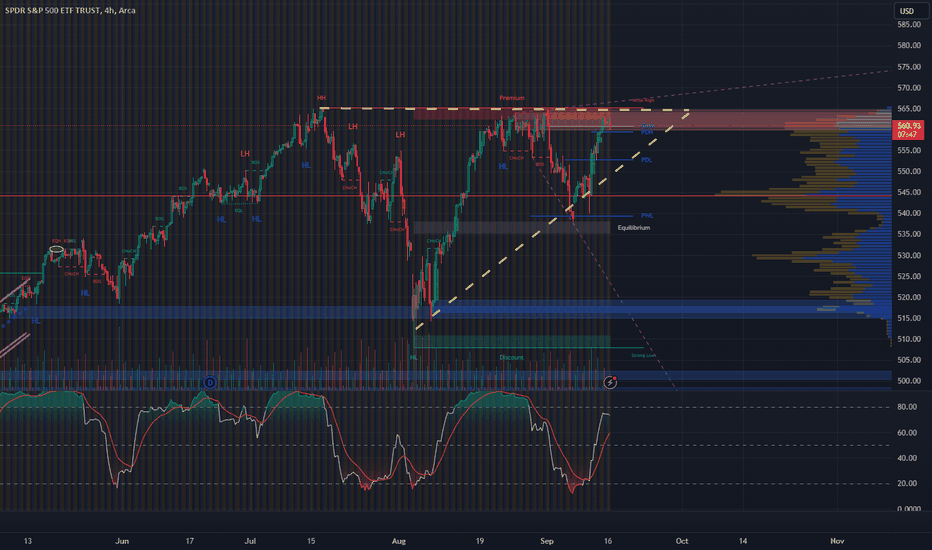
Bull Pennant on the 4HR.. With the Fed rate decision looming, good news could spark the fuse on this.
Just noticed this massive Ascending Triangle on SPY 4 HR. If this does decide to breakout, we will see SPY at new ATH within the next 6 weeks.
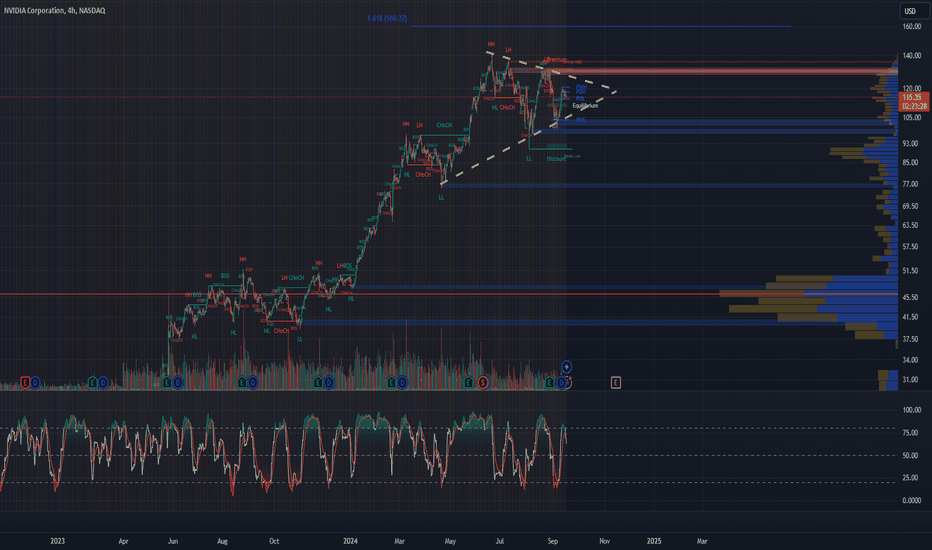
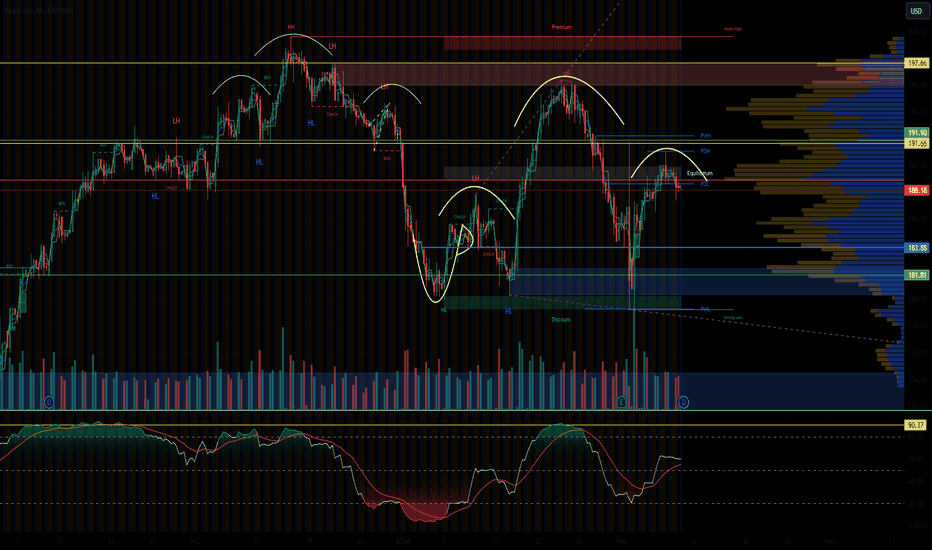
We can see a pretty prominent Head & Shoulders that has formed on the 1HR as well the 15MIN. A breakout of this and the Cup & and Handle could bring a really nice leg up to NVDA. Keep in mind these are hourly candles...
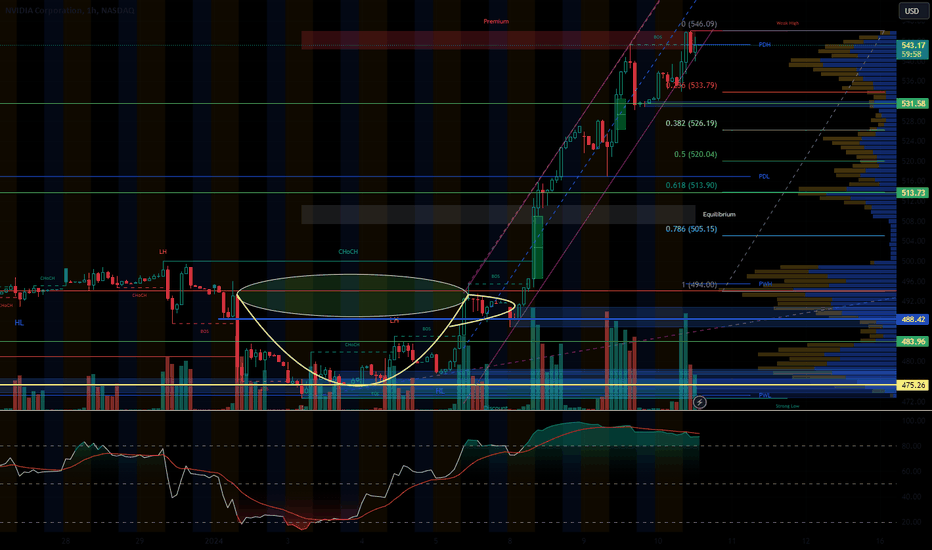
Tracking this beautiful Cup & Handle on NVDA 1 hr... This comes just after the massive breakout of the Descending Broadening Wedge. If this Bull trend continues, our next stop is going to be $130. Stay tuned!
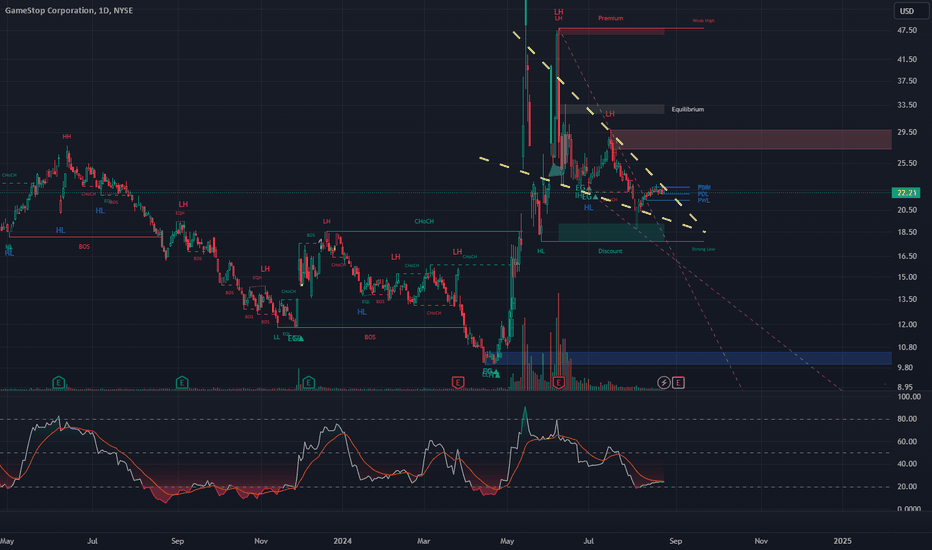
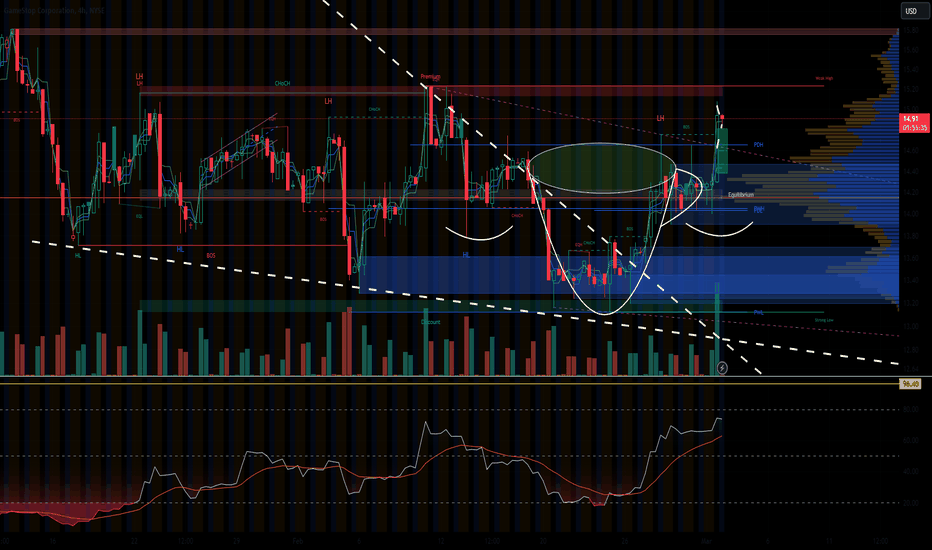
Well well well, this looks familiar. I wonder where I seen this before? Beautiful Bull Flag on GME daily. Once we fill the bottom of this wedge around the $20 mark, its go time back to $30. If we break $30, this could head straight back to $60... Once again, get your tickets, because this is a show you're not going to want to miss.
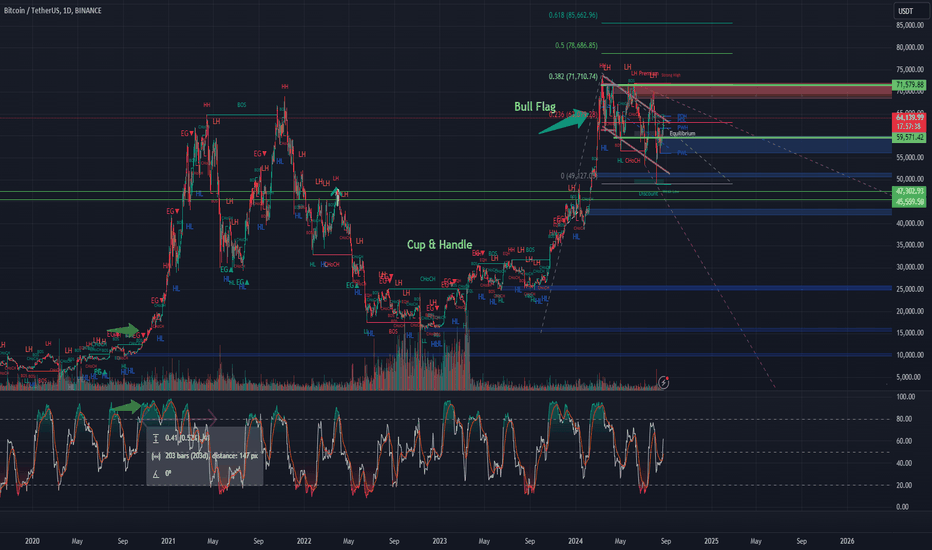
The breakout of this Bull Flag is going to bring BTC once again to heights we have yet to see. When we use a Trend Base Fib Ext, we can see the next Golden Pocket sitting up at $85.600. This is a continuation of the monster Cup & Handle we broke out from earlier this year.
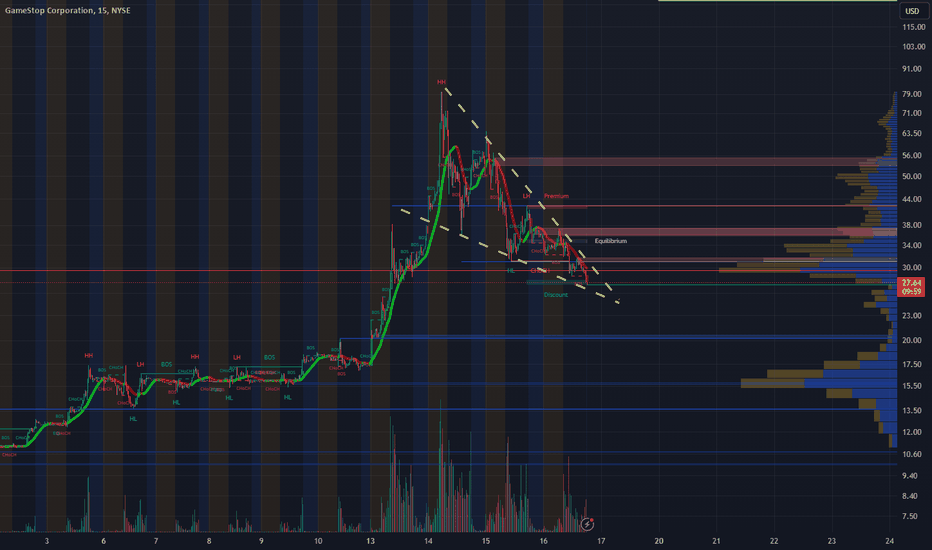
Yet again, we can see GME has formed another massive bullish falling wedge/flag on the 15. A breakout out of this flag should bring a $25 to $50 gap up within the next 10 to 14 days. Stay tuned.
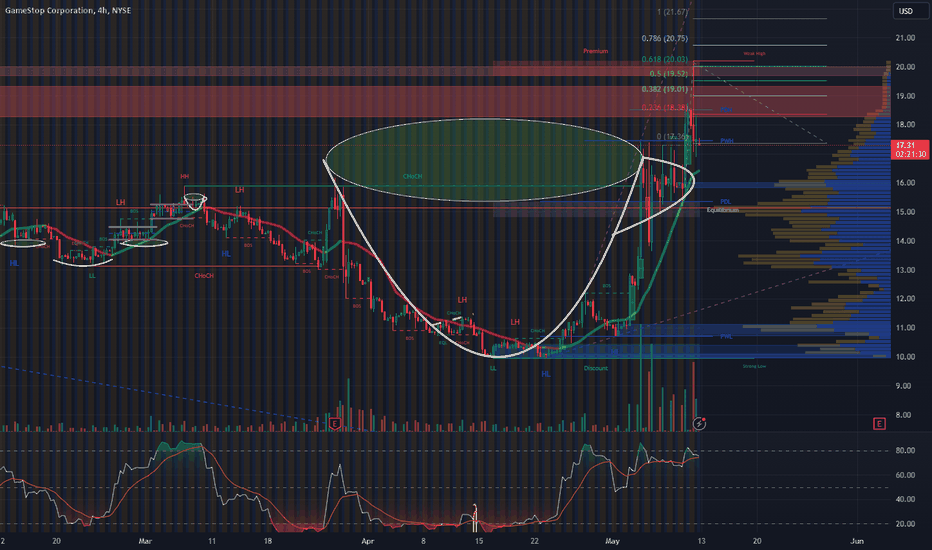
What an absolute monster Cup & Handle on the 4hr. GME has been on quite the run lately. If this continues we could see another $3 to $7 gap up over the next week or so according to the Fib Ext. And being DFV is now active again, this may be the catalyst needed to spark the fuse on this weekly Bull Flag that has begun to finally breakout.
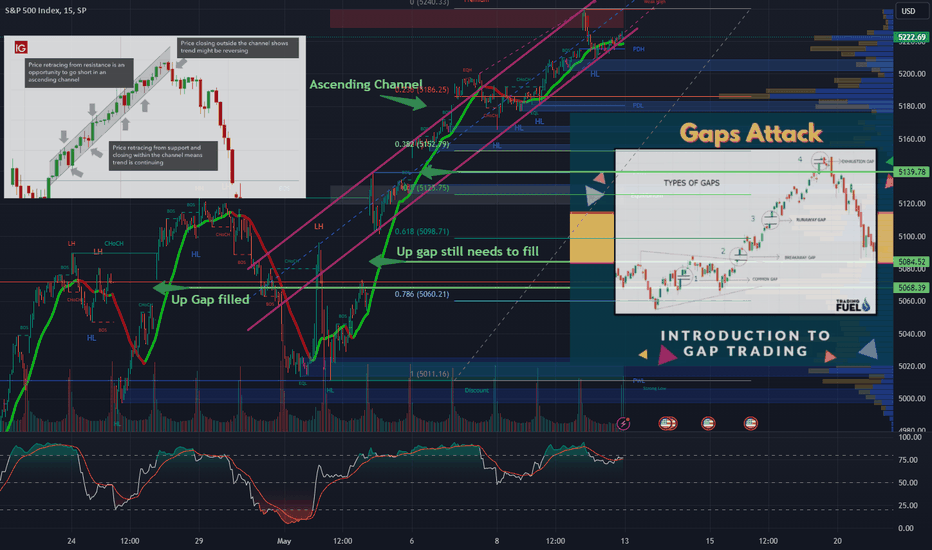
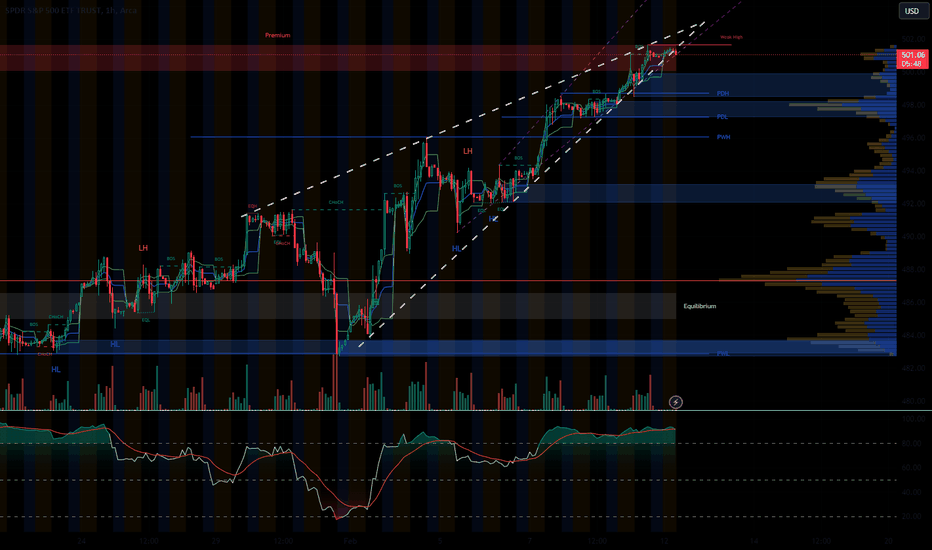
Taking a look at SPX on the 15, has 2 up gaps to fill and is nearing the top of this Ascending Channel. If it decides to break down, we could see a $100-120 gap down.
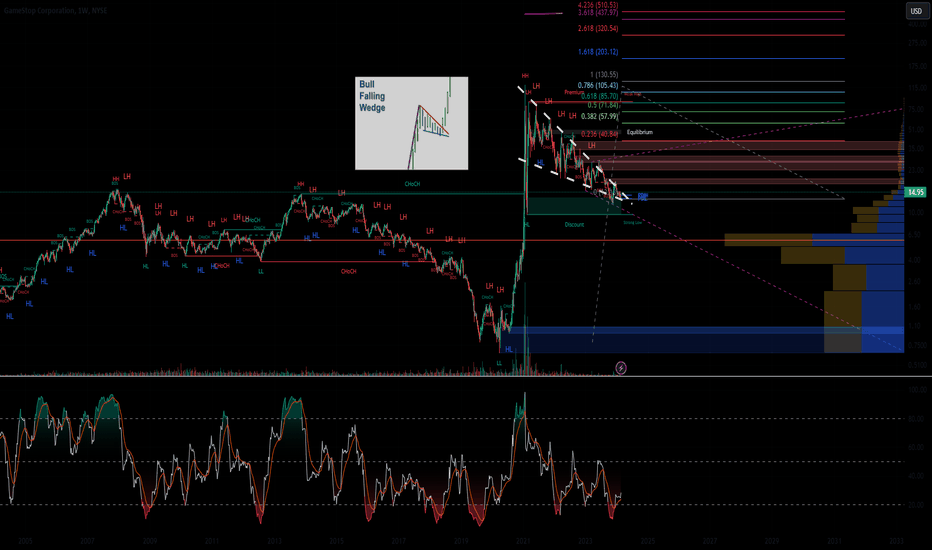
Still tracking this absolutely massive Bull Falling Wedge/Flag on the weekly chart. A breakout could bring the biggest move we have ever seen to GME. When we use a Fibonacci Extension on the last gap up in 2021, we can see the 1st Golden Pocket sitting up at $85, which would be $340 pre split. And the second, third, and fourth pockets sitting up at $203, $320,...
Looking at the 4Hr GME chart, we can see the GME has broken out of the wedge and has formed a Cup & Handle as well and an Inverse Head & Shoulders. Also, the 15 min is showing a Bull Flag breakout. Bulls are out in full force. Quad witching is in 3 weeks also...
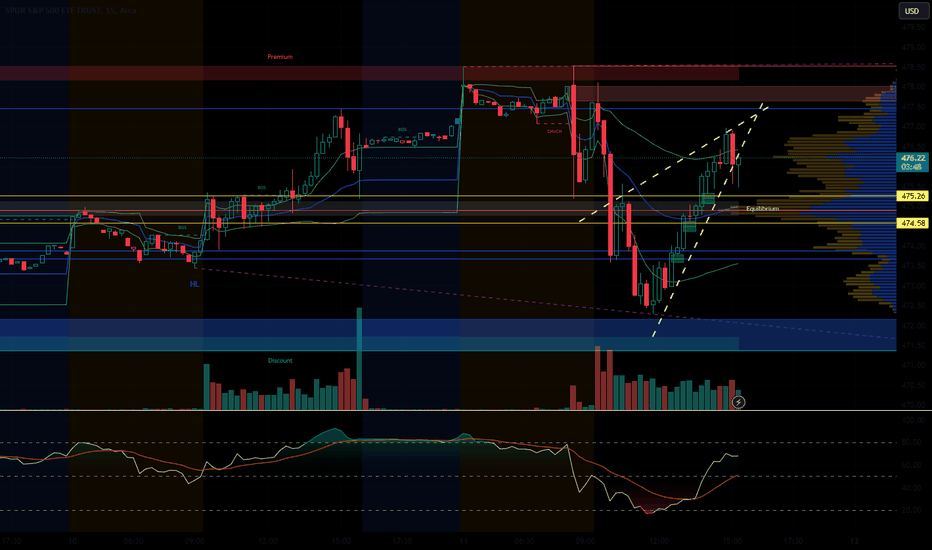
Tracking a pretty substantial Rising wedge on SPY 1 Hr. Could see a 10 point pullback if this does decide to breakdown. Looking closer at the 15 min, looks like we have just broke the bottom trend line of this wedge. Stay tuned.
4Hr head and shoulders on APPL. Could see a pretty substantial breakdown Once this right shoulder completes formation. Possible $10 point gap down.
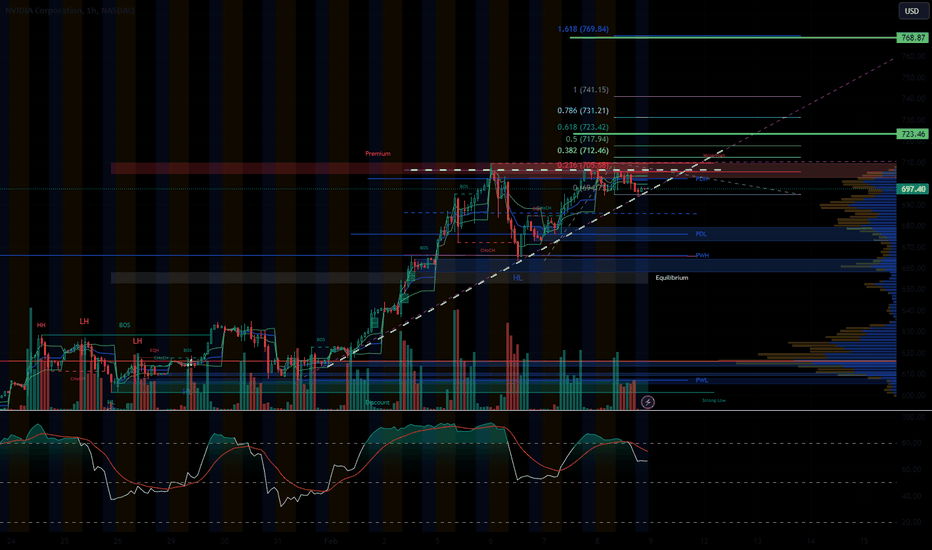
Looking at NVDA on the hourly. It seems to be flirting with the lower trend line of the ascending channel. Could see a 15 to 30 point pullback here in a few, if it decides to break down out of this channel.
Keeping an eye on this Ascending Triangle on the 4Hr. A breakout could bring a 30 Point gap up.
Looking at this Bear flag on SPY. If this breaks down, we could see a 5 point dip.
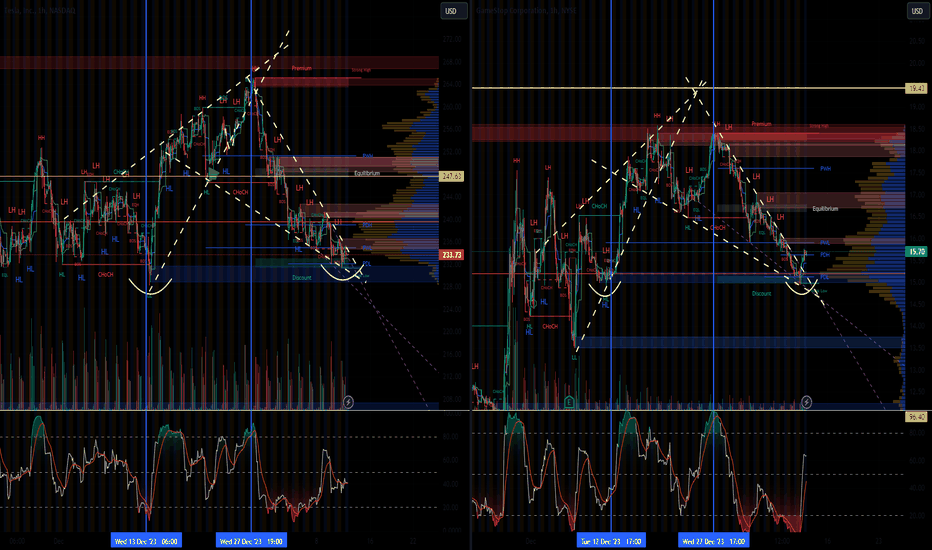
I was just looking at both TSLA and GME on the hourly and low and behold, these charts are almost identical. Both inside falling wedges, and both with double bottoms. I'm unsure of the exact fundamentals on this one, but the charts do show that they are moving in unison. Keeping close eye on this.
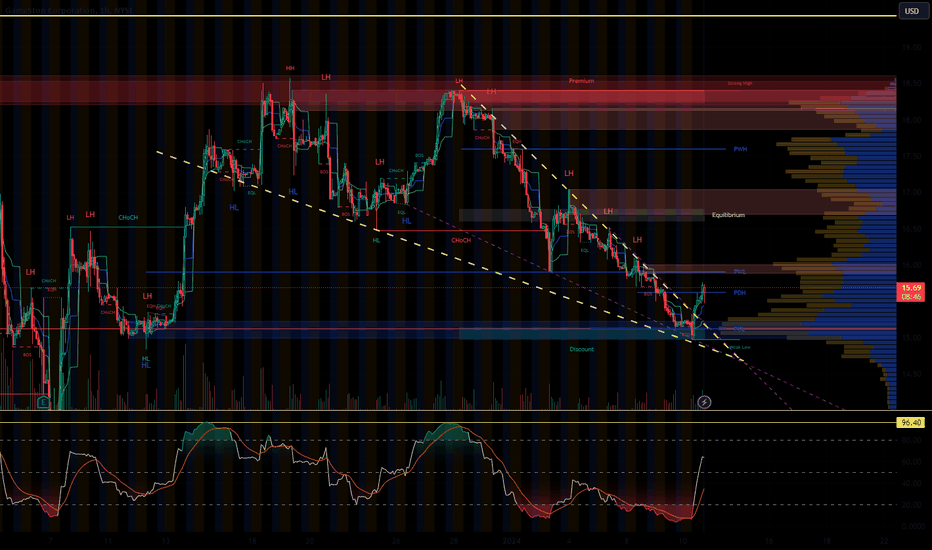
Looking at a small breakout of a pretty large falling wedge on GMEs hourly chart. If it can break these two supply zones at $16 and $17, It may re-test those $18.50 levels again. I would keep an eye on this one. Also if you zoom out a bit more you will notice a massive double bottom... On the flipside, we are also still inside the weekly wedge with a bit more...
