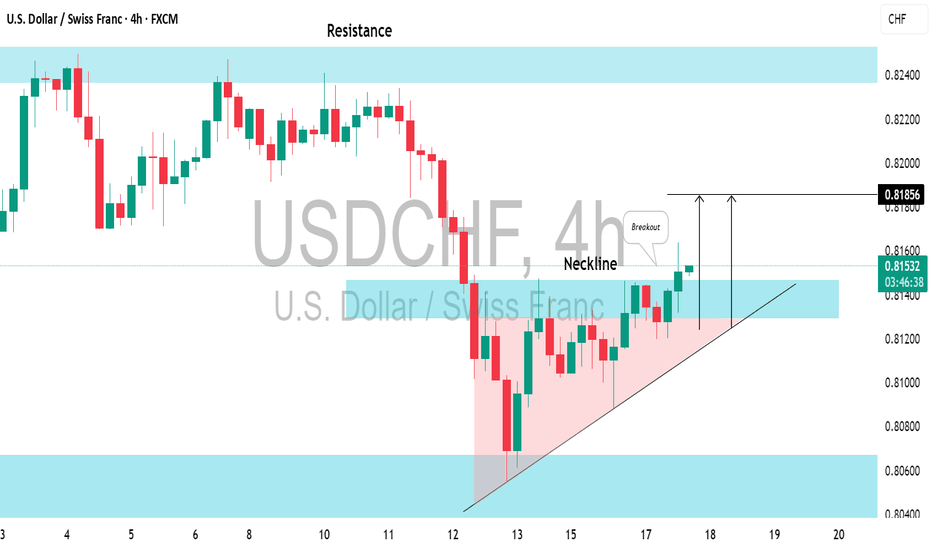
I see a solid bullish signal on 📈USDCHF following a test of significant support. The price formed an ascending triangle pattern on the 4-hour chart and has broken above its neckline. I anticipate that the price will soon reach the 0.8193 level.
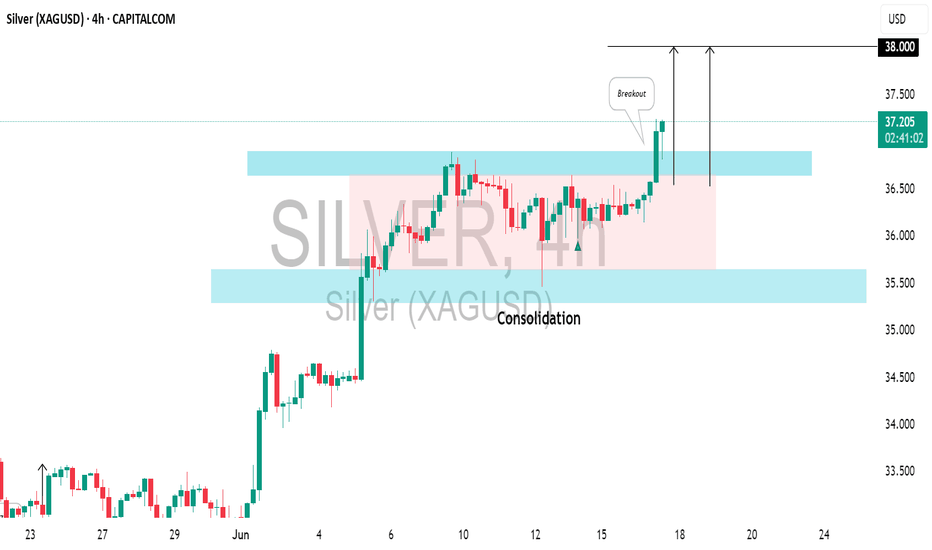
📈SILVER is currently experiencing a strong bullish trend on the daily chart. Since the end of last week, it has been consolidating within a horizontal range on a 4-hour time frame. Today's bullish movement has successfully broken above the resistance of this range, confirming buyer strength and suggesting a likely continuation of the upward trend. The next...
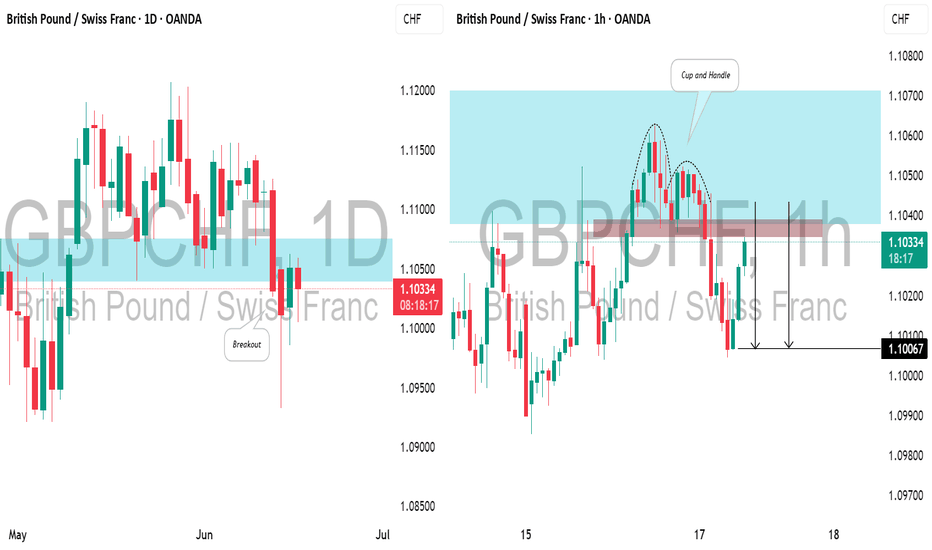
📉GBPCHF appears to be bearish following a breakout of a significant daily support level. After retesting this broken structure, the pair formed an inverted cup and handle pattern, and we are now seeing the test of the broken neckline. A downward movement towards 1.1006 is anticipated.
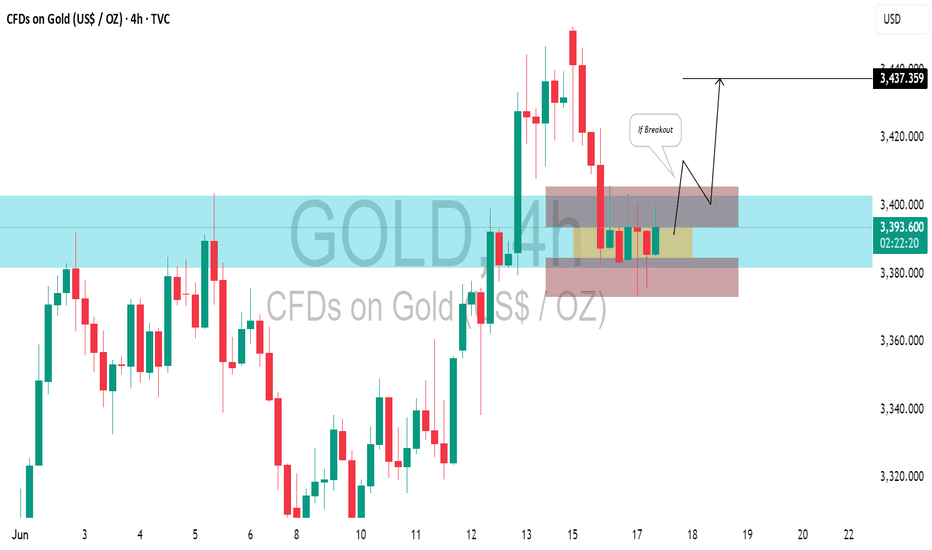
⚠️GOLD is currently at a crucial daily horizontal support level. It is consolidating within a horizontal range on the 4-hour chart, showing a positive bullish reaction and testing the range's resistance. A breakout above this resistance with a 4-hour candle close would signal strong bullish momentum, potentially leading to further gains, with the next target at...
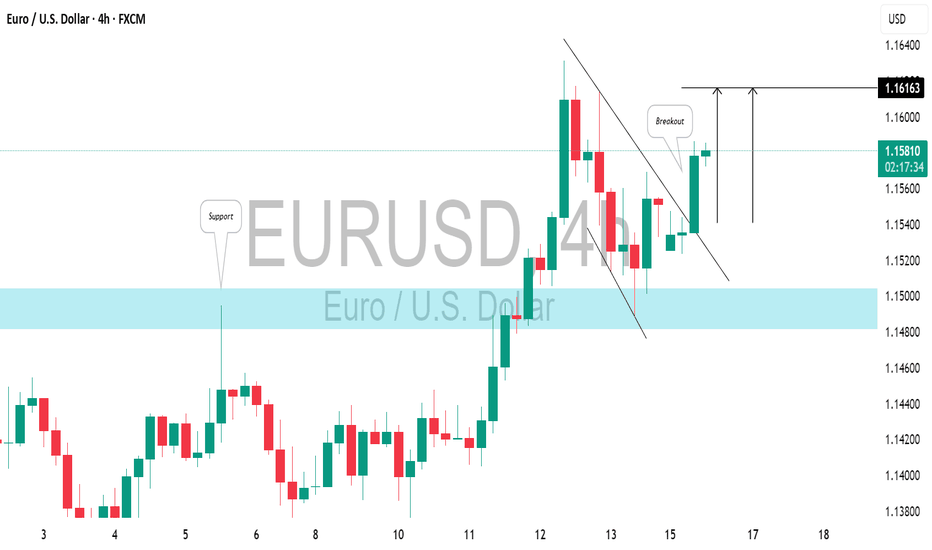
The price action on EURUSD shows that it broke through a horizontal resistance level on the 4-hour chart. Following the breakout, a local correction occurred, forming a bullish flag pattern. As the NY session opened, the market rose and surpassed its resistance line, indicating a strong likelihood of continued upward movement. The target is set at 1.1616.
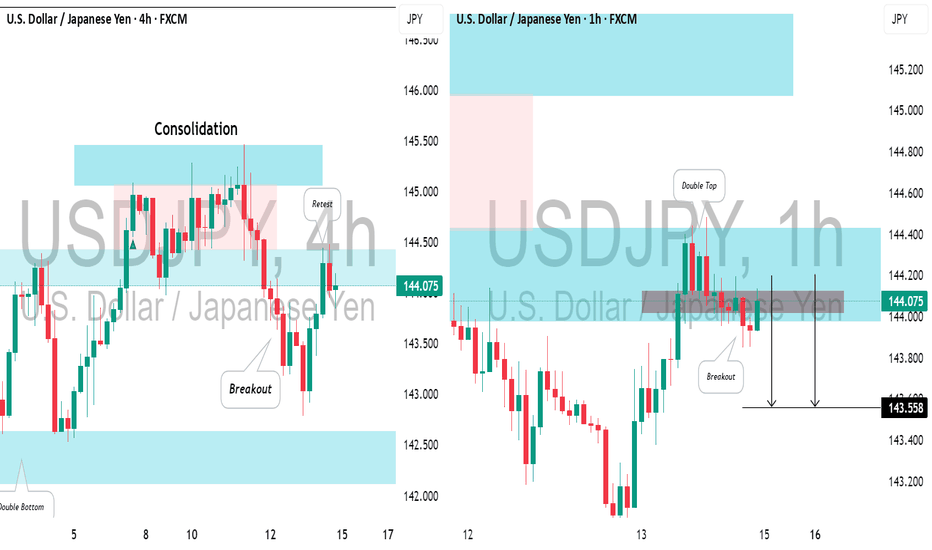
In the middle of last week, I spotted a valid confirmed structure breakout on 📉USDJPY on a 4-hour timeframe. Currently, the pair is retesting the broken structure, and the price has formed a strong bearish confirmation on the hourly chart. I see a double top pattern and a violation of its neckline. With high probability, the price will fall and reach the 144.02 level.
Given the recent news in the Middle East, I believe you'll agree with me that ⚠️Gold will likely to rise more. Your confirmation wound be a bullish breakout above the neckline of an ascending triangle pattern, along with an hourly candle closing above 3447. This would serve as a key indicator, potentially driving prices toward the current all-time high.
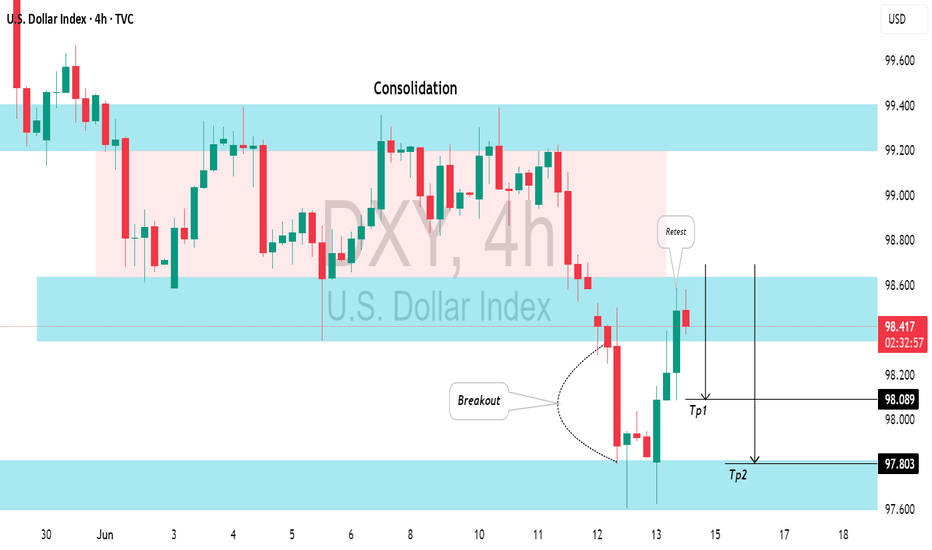
I believe that 📉DOLLAR INDEX has a potential to continue falling. The market has been consolidating in a wide intraday horizontal range, and the breakout below the range support is a significant bearish indicator. Target levels are 98.08 then 97.80 support.
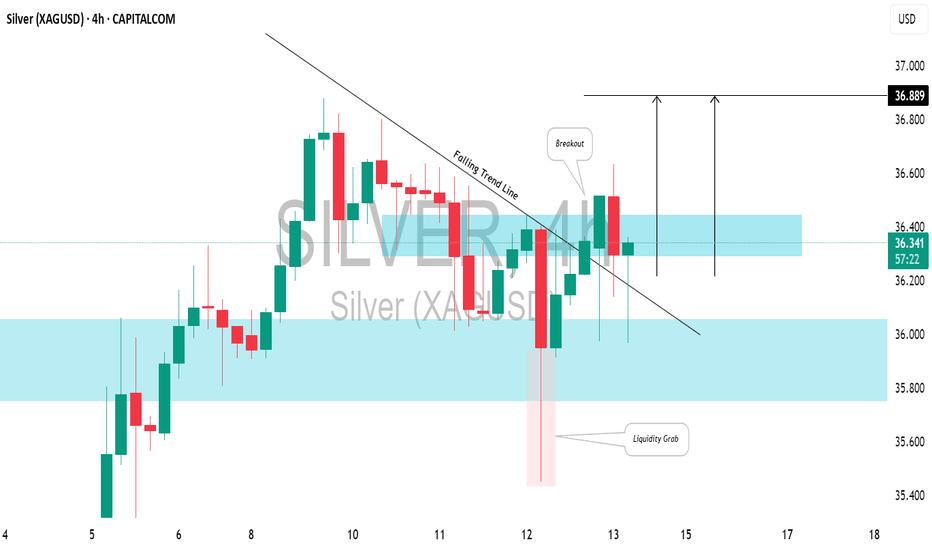
It appears we've seen a legitimate liquidity grab following a test of a crucial daily/intraday structure on 📈SILVER. After a false breakout of the highlighted area, the price rebounded and broke through a significant downward trend line and a minor horizontal resistance on the 4H chart. I believe the market could stay bullish and potentially reach at least the...
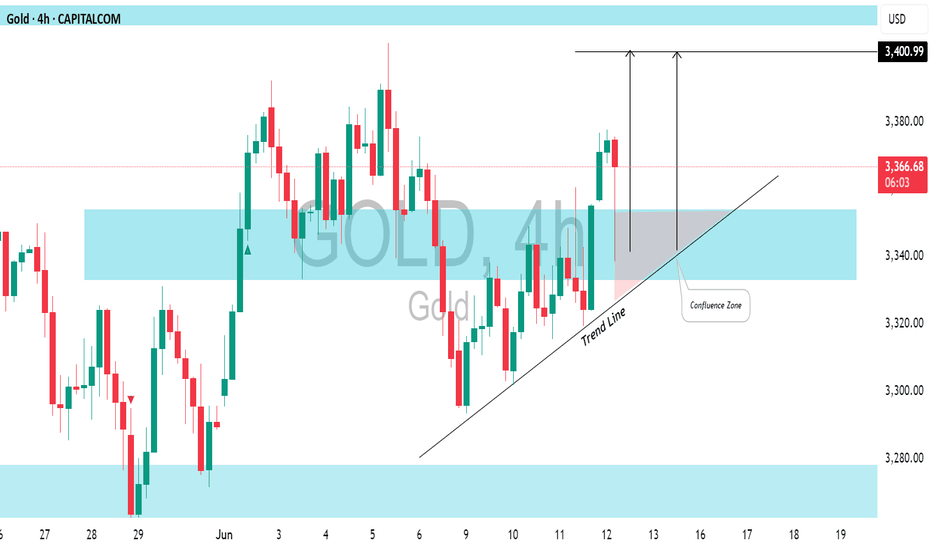
This week, strong fundamentals are backing 📈GOLD, which has successfully broken through a significant daily/intraday resistance level. Buyers are now likely targeting the psychological level of 3400. For long positions, consider a confluence zone that base on a rising trend line with the recently breached resistance.
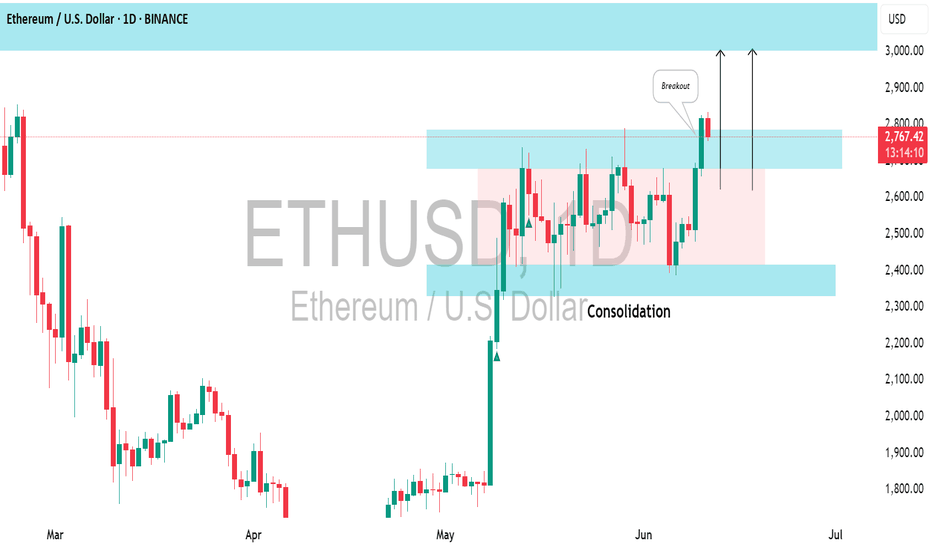
📈ETHEREUM is in a long-term bullish trend, but since late May, it has been consolidating within a horizontal range. However, the price bounced yesterday and closed above the range's resistance, which is likely to initiate a trend-following movement. The next resistance level is at 3000.
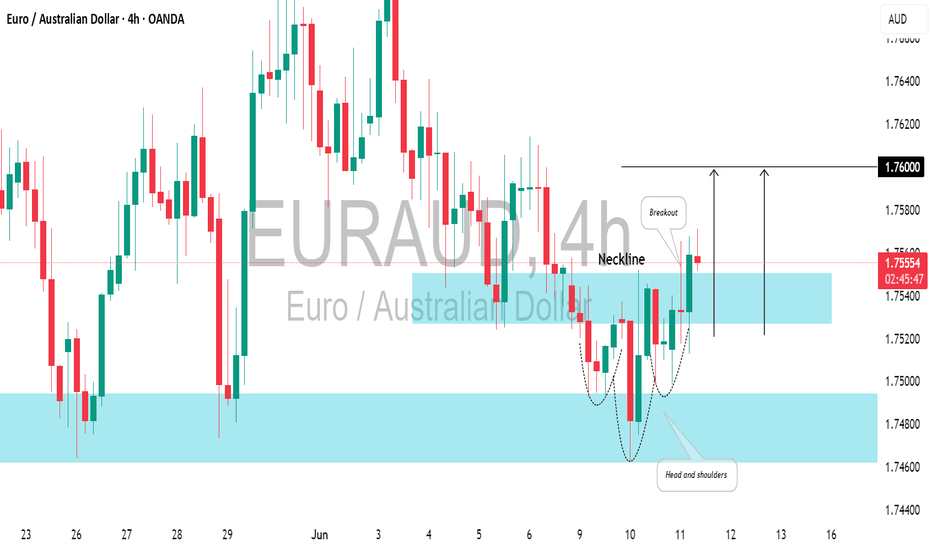
📉EURAUD appears to be bullish following a test of significant daily/intraday support. An inverted head and shoulders pattern has formed on the 4-hour chart, and strong bullish momentum observed this morning suggests positive movement. I believe the market may retrace to the 1.7600 resistance level.
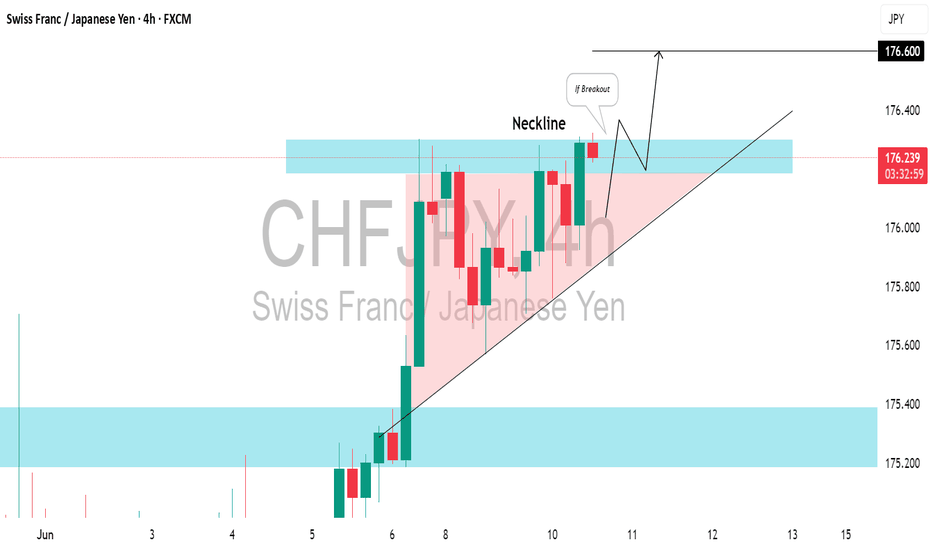
In line with the current trend, 📈CHFJPY is experiencing a robust bullish momentum. The next buy signal will come from a bullish breakout of the ascending triangle pattern's neckline on the 4H chart. A close of a 4H candle above 176.30 will confirm this breakout, with the next target set at 176.60.
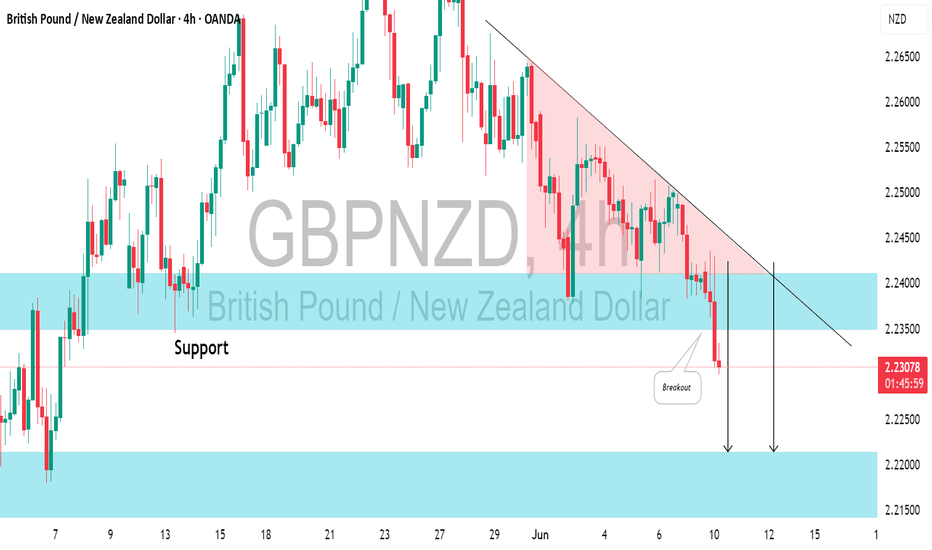
📉GBPNZD pair formed a distinct descending triangle pattern on the 4-hour time frame. Breaking below its neckline is a significant bearish indicator, suggesting a strong likelihood of a further decline. The next support level is at 2.2200.
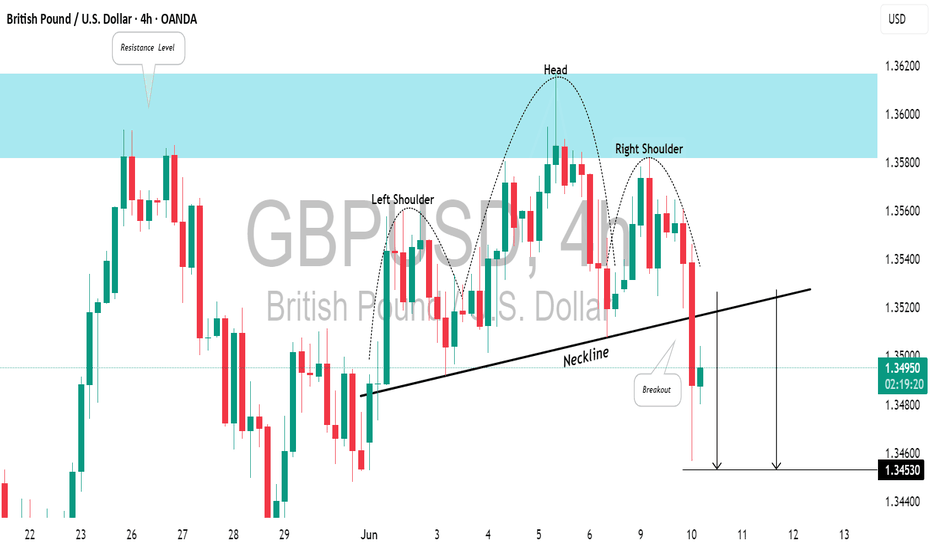
📉GBPUSD pair approached a significant horizontal resistance last week. The price formed a clear head and shoulders pattern, then rebounded and broke below a strong rising trend line. This indicates considerable selling strength, suggesting that the market may continue to decline. The next target is 1.3453.
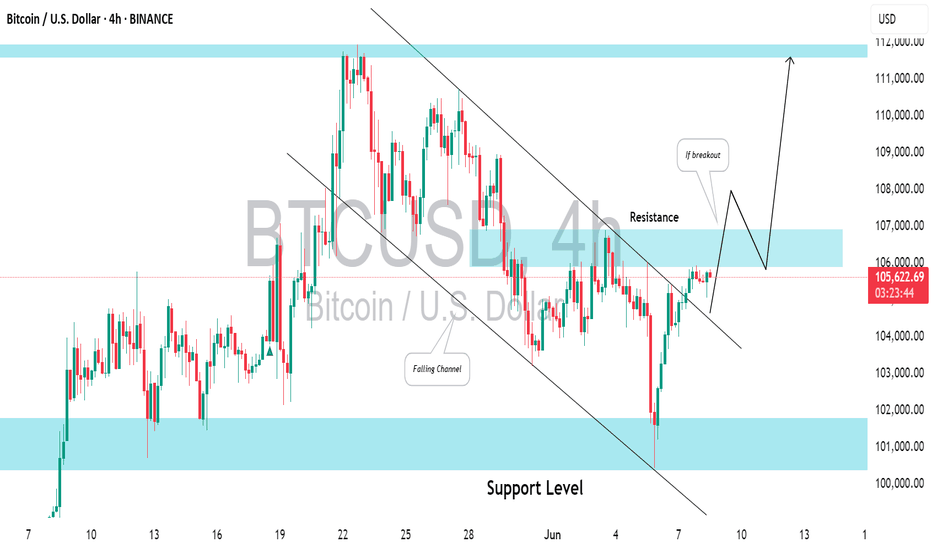
It appears that ⚠️Bitcoin is gearing up for a bullish trend. Analyzing the 4H time frame, I spotted a bullish flag pattern and a confrimed breakout of its upper boundary. The final hurdle for buyers is the resistance level between 105,880 and 106,934 on the 4-hour chart. A successful break and close above this range would signal a significant bullish...
📈USOIL is trading in a bullish trend on a 4H time frame. After a prolonged upward movement, it started to consolidated within a horizontal range for a while. Recently, the resistance of this range was breached, indicating strong buyer momentum. I believe the upward movement may persist, potentially leading the market to reach the 65.00 level soon.
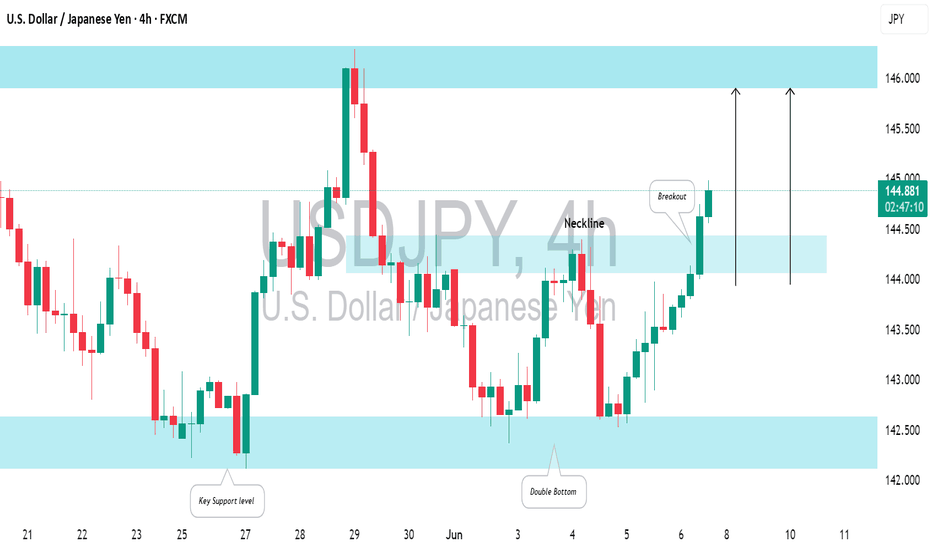
📈USDJPY responded well to the highlighted intraday support zone on a 4H timeframe. The price formed a double bottom pattern on that and violated its horizontal neckline. There's a strong likelihood that the price will continue to rise and hit the 146.00 resistance level.
