neilcassar1
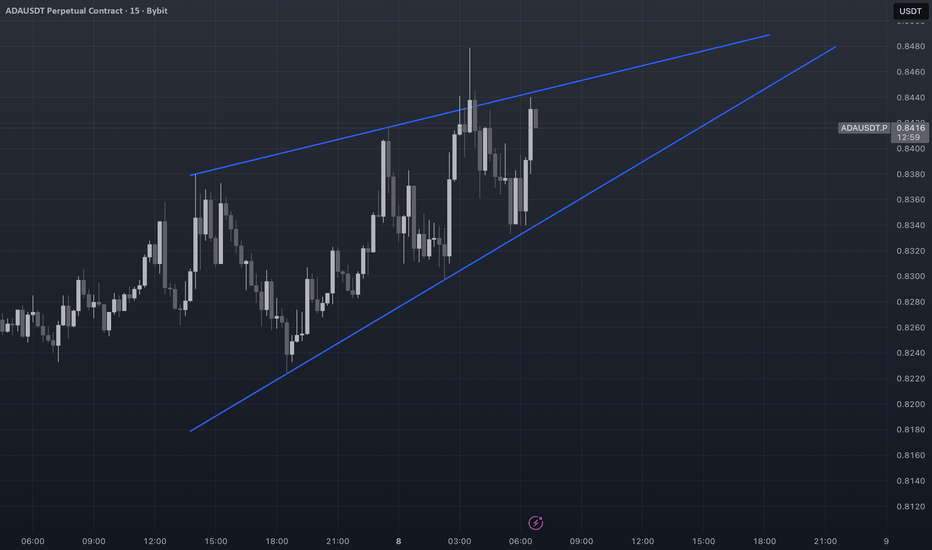
EssentialAnother bearish pattern forming on the 15 min chart can be a good daytrade/scalp if it close below the pattern .
Sui on the 4hr chart if candle close below the pattern its bearish and be a good opportunity to short keeping an eye on this one too
This chart is a rising wedge pattern if close below the pattern it have 70% good probability to dump hard keep an eye on this chart for the candle to close below the pattern.
Here in the 15 min chart u can see a good Area of support around the 109600 Area , this is a quick scalp of a day with a tight stop loss of 109200, we should have a good bounce reaction in this area if we go to this area.
Ena short signal now activated rr is good and as you can see this is the trade for today
Will keep updating it and trade the ranges this is the full chart atm trade zones
As you can see these are the trade zones we will keep updating
If its above the white line bullish if it goes under the white line short on the retest Targets would be first tp 1479-1458.5 and lower if it dont hold


