onlinenutrition
ExpertLast seen
Ideas
2Scripts
0Joined Apr 27, 2025
1929
1929crash
2008marketcrash
2020crash
2025forecast
chartpattern
covid-2019
dotcom
dotcombubble
dotcomcrash
harmonicpatterns
indicator
trendanalysis
Less Tags
Show All Tags
All Types
Type
All Types
Indicators
Strategies
Libraries
All Accesses
Script access
All Accesses
Open
Protected
Invite-only
Public & Private
Privacy
Public & Private
Public
Private
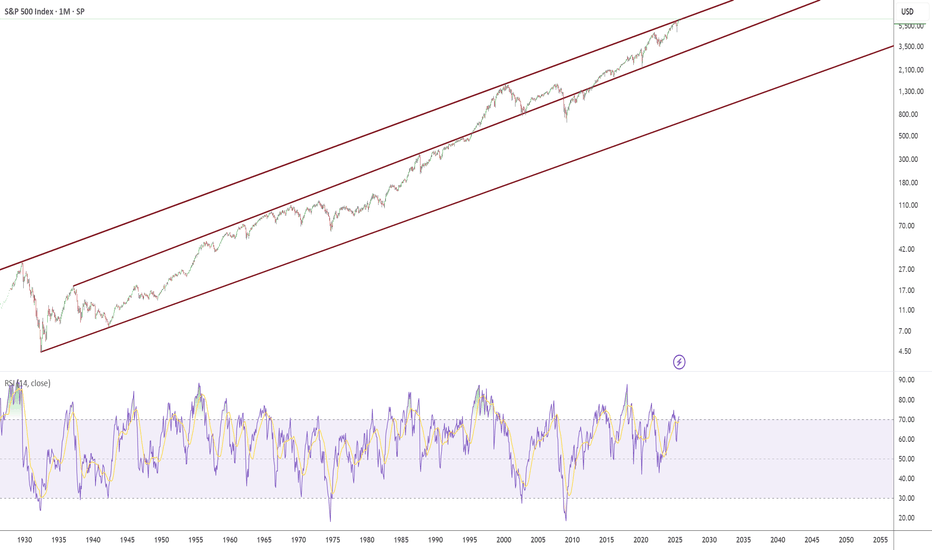
The chart represents some very meaningful and powerful trendlines. I have magnetised these trend lines to be exactly on the peak of September 1929 and exactly on the peak March 2000. I drew these lines to the high of day on the given peak days in Sep 1929 and March 2000, combined with a line extension. (Meaning its not a manual placement this is the exact...
8
Anytime the RSI hits 50% on the US30Y/US02Y ratio a crash soon proceeds when on a monthly timeframe. This only works on the monthly timeframe, it will not work on other timeframes.
22
1
0
0
Message
Follow
Following
Unfollow
6
0
0
Message
Follow
Following
Unfollow
6
0
0
Message
Follow
Following
Unfollow
0
0
1
Message
Follow
Following
Unfollow
0
0
0
Message
Follow
Following
Unfollow
0
0
0
Message
Follow
Following
Unfollow
0
0
0
Message
Follow
Following
Unfollow
4
0
0
Message
Follow
Following
Unfollow
2
0
0
Message
Follow
Following
Unfollow
1
0
0
Message
Follow
Following
Unfollow
0
0
0
Message
Follow
Following
Unfollow
0
0
0
Message
Follow
Following
Unfollow
2
0
0
Message
Follow
Following
Unfollow
User follows nobody
Type
Script access
Privacy


