pakoumal
ExpertGold ripping higher (+60% YoY) Investors are hedging inflation risk, currency debasement, or policy uncertainty Gold outperformance shows capital fleeing to “hard money” rather than growth assets CRBS/US10Y above 8% + US10Y trending down is a classic stagflation warning Economy faces cost pressures (gold pricing in inflation fears) Bond market is saying...
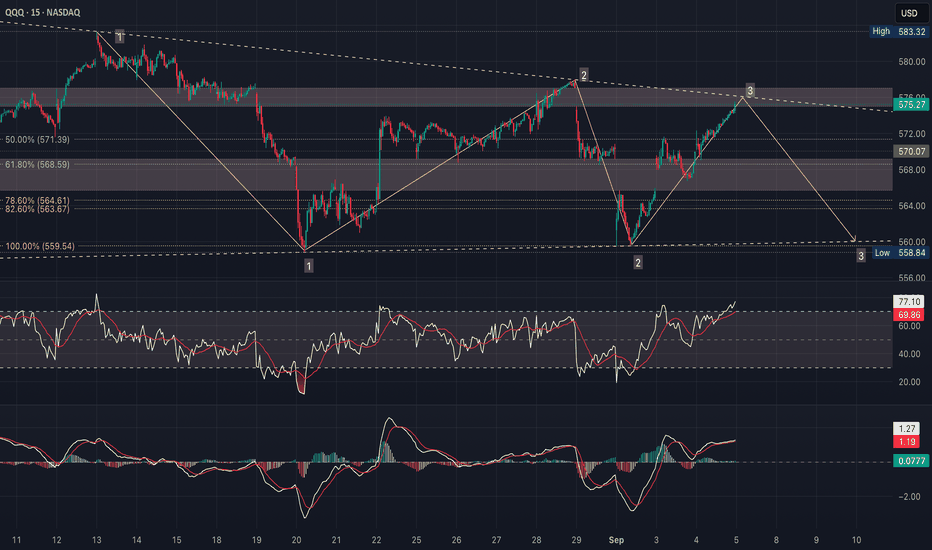
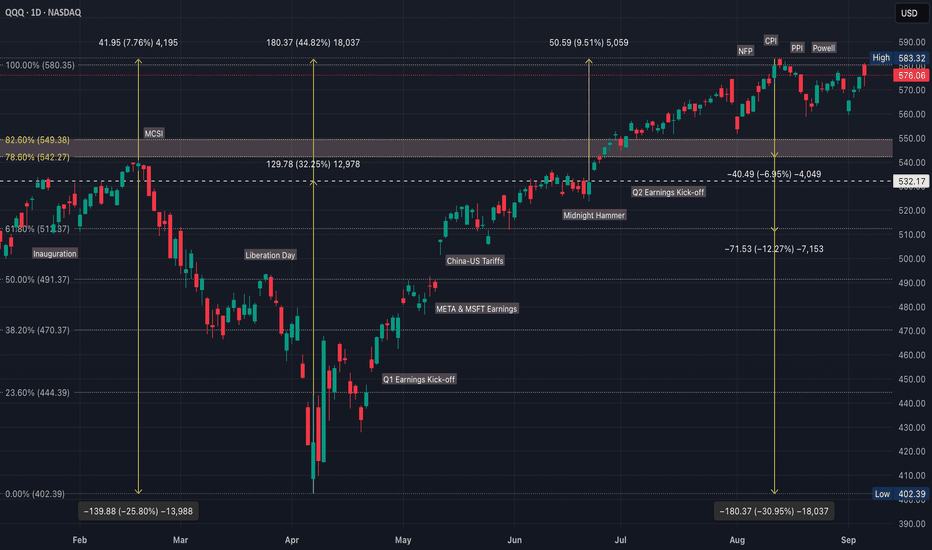
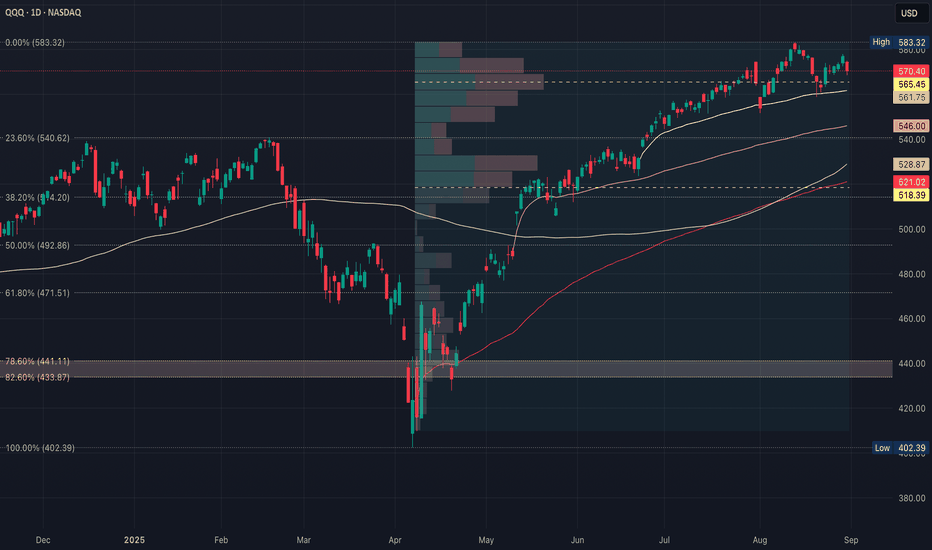
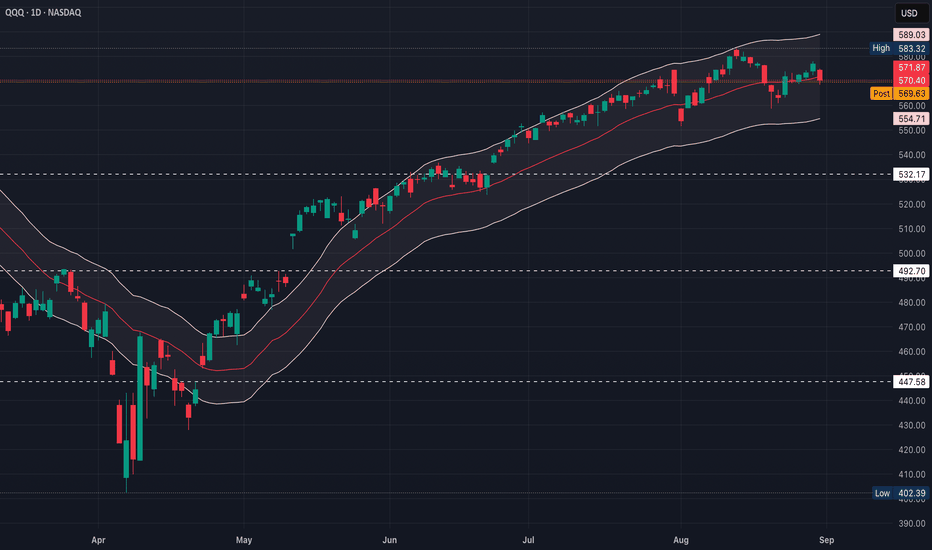
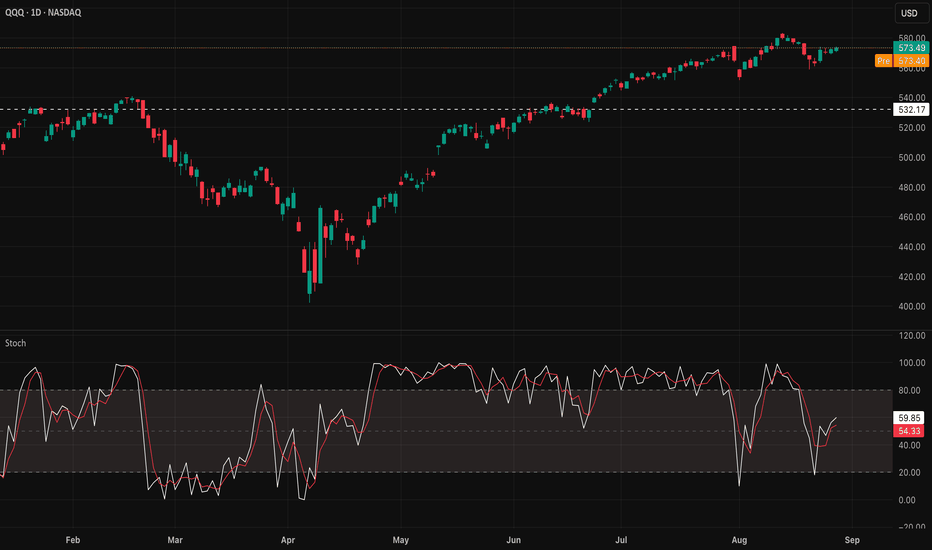
QQQ is coiling between $577–$583 $583.2 (Top 1/Fib 0%) is major resistance $581 (Top 1/recent high) is lower high rejection $578–$579 (current) sits just above Fib 23.6% (~$577) ~$571 (Fib 50%) is mid-support ~$568 (Fib 61.8%) is a critical downside pivot $564–$563 (Fib 78.6%–82.6%) is a possible deep retrace In short, Above $583 = breakout Below...
Today’s rally into resistance doesn’t cancel the bearish structure - it just tested the ceiling again, like the ball bouncing off the ceiling one more time Price bounced, yes, but it stopped right at the descending trendline and supply zone Until QQQ clears $577–$580 on volume, this is just another lower high RSI still under 60 on the daily MACD still...
QQQ Rising, Breadth Weakening NDX is near highs, but both NDFI (~60) and NDTH (~46) are well off their highs This confirms the mega-cap concentration ADL (Advance/Decline Line) Still in an uptrend, but flattening Shows breadth has not broken down completely, but is stalling while QQQ pushes higher QQQ has made new highs, but the breadth line has failed...
Since mid-2023, the gap has steadily widened - it doesn’t mean an immediate reversal, but it does mean QQQ is very top-heavy (the NDX/NDXE ratio tends to oscillate in bands; rather than, trend infinitely higher) Strong NDX vs weak NDXE suggests a fragile rally If mega-caps stumble, the whole index could pull back hard However, if breadth improves (NDXE starts...
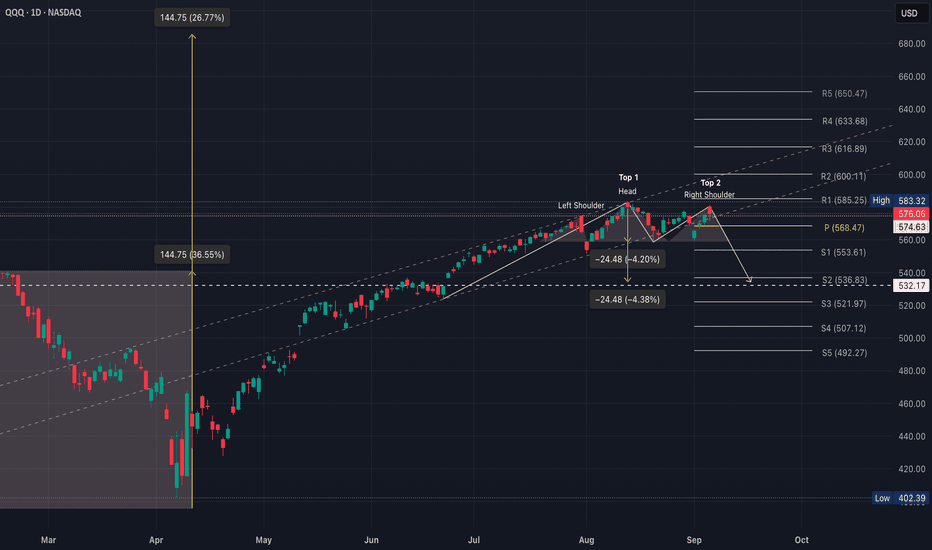
Macro supports the bullish continuation case ($600–$630), unless $568 breaks & macro data worsens Fed pivoting dovish, disinflation holding, AI-driven earnings resilience & strong liquidity High valuations, crowded positioning & possible macro shocks (yields spiking, geopolitics) The $568 neckline & $583 breakout line up with the macro inflection Fed...
QQQ broke out of a huge consolidation box (2024 into early 2025) That breakout projected a measured move of ~144 points (26%–36%), targeting $600–$630 Price indeed advanced strongly toward that zone before stalling 1. Bearish Case (head & shoulders or double top plays out) Breakdown below $568 with a target of $550, then maybe ~$537 (S2 pivot) if selling...
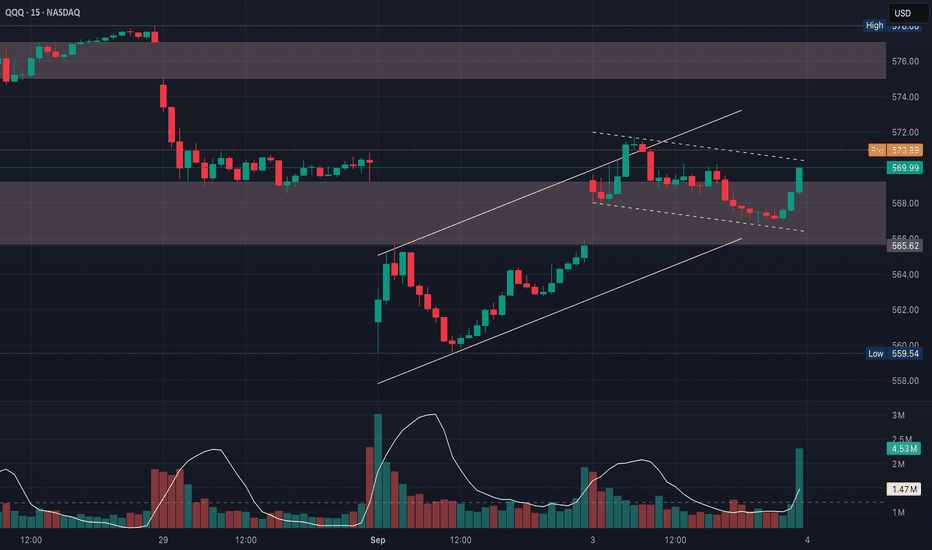
The slope of the lines matters for pattern bias Sloping slightly down from $583 to $580 Holding flat around $563–$565 That shape is actually closer to a descending triangle Bearish continuation if support breaks But here’s the nuance, Descending triangles typically form after a downtrend, as continuation QQQ is in a strong uptrend, so even if the...
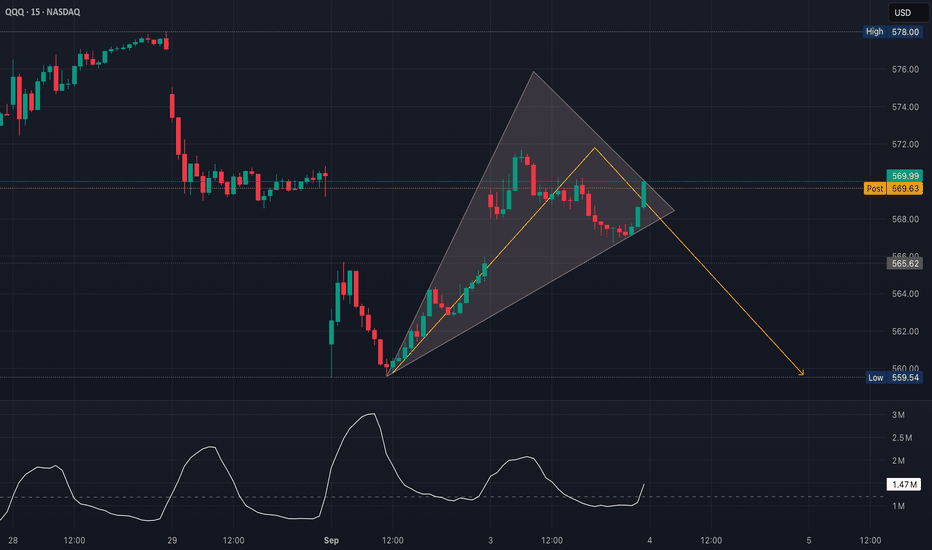
On the larger timeframe, the overall structure is a bear flag off the bigger down-move, much better than the earlier wedge attempt If QQQ were forming a wedge, price would be swinging wider with higher highs & lower lows, like a volatility burst after sideways action This leans bearish (because of the descending highs & flat-ish support), but the final signal...
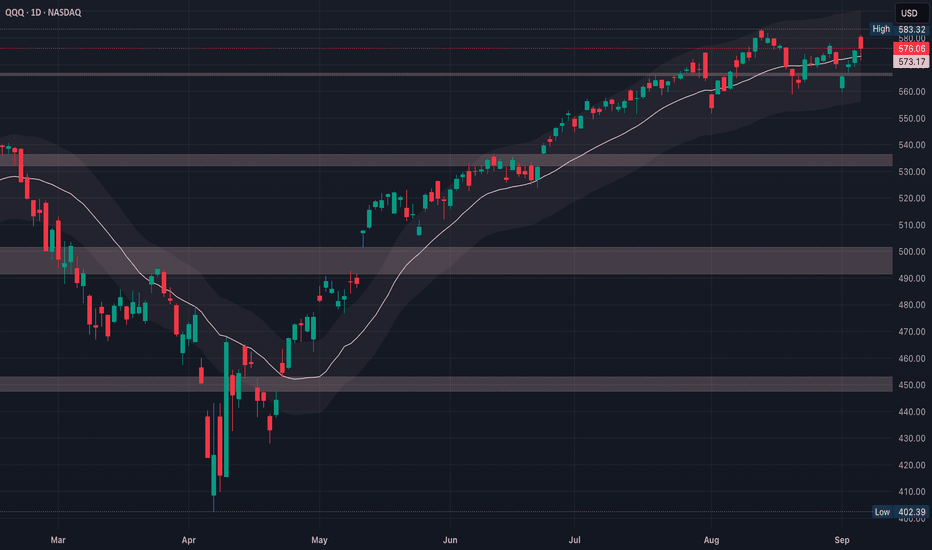
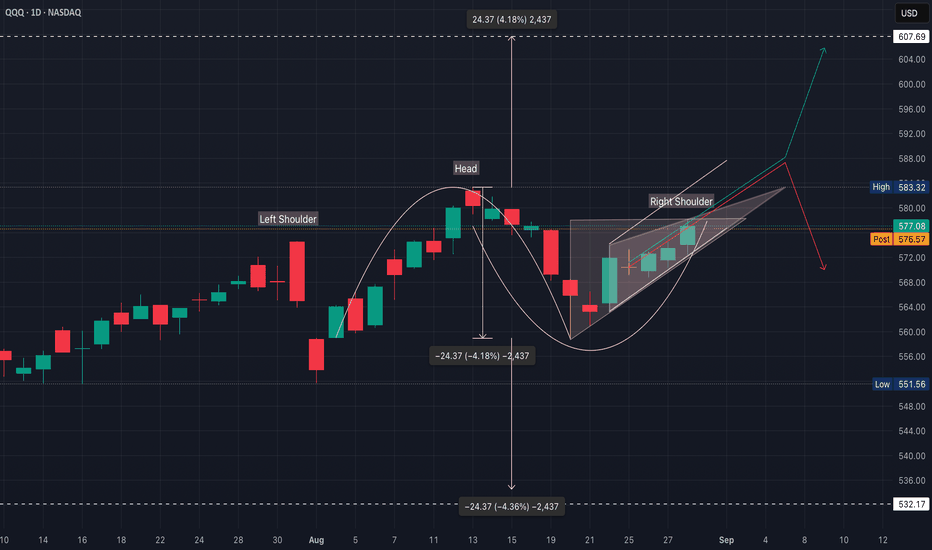
The white volume line has been fading during the climb inside the wedge That’s typical of an exhaustion rally inside an ascending broadening wedge where price pushes higher on weaker participation The last push up showed a small bounce in volume, but not a breakout-level surge For a wedge, this usually suggests the rally is running out of gas rather than...
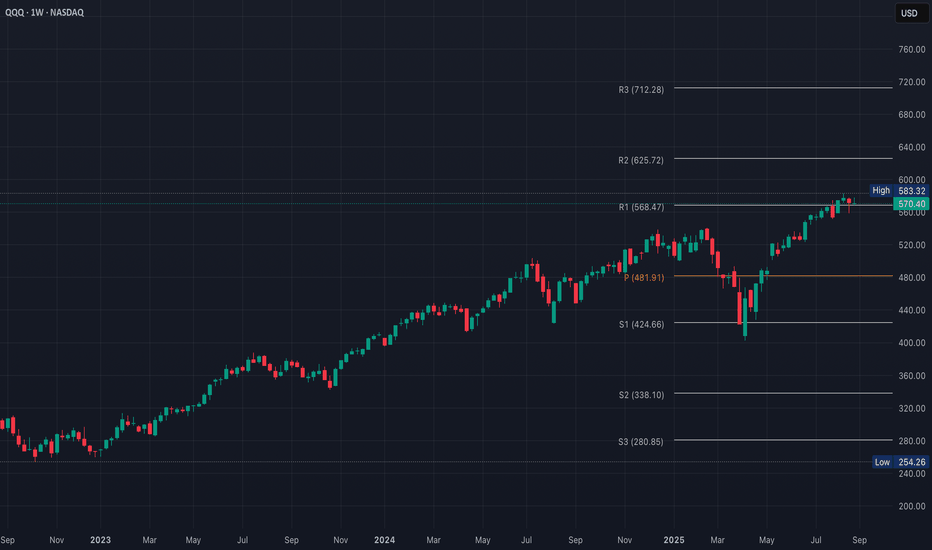
Support levels are far below current price, but they anchor downside risk if a true bear phase begins Clear $585 with an upside target $600–$625 (aligns with R2) Hold between $568–$585, market consolidates until macro data (jobs, CPI, Fed) Weekly close back below R1 ($568) opens a slide to $540 & maybe toward $482 if selling accelerates
1. Immediate Support Holds (~55%) QQQ consolidates above current levels A push above $583.32 (recent high) would confirm bullish continuation $589–$590 or retest of envelope top/channel resistance $600 is a round-number magnet & could trigger breakout momentum Extension to $607–$610, based on measured move from the last swing Biggest shelf (high-volume...
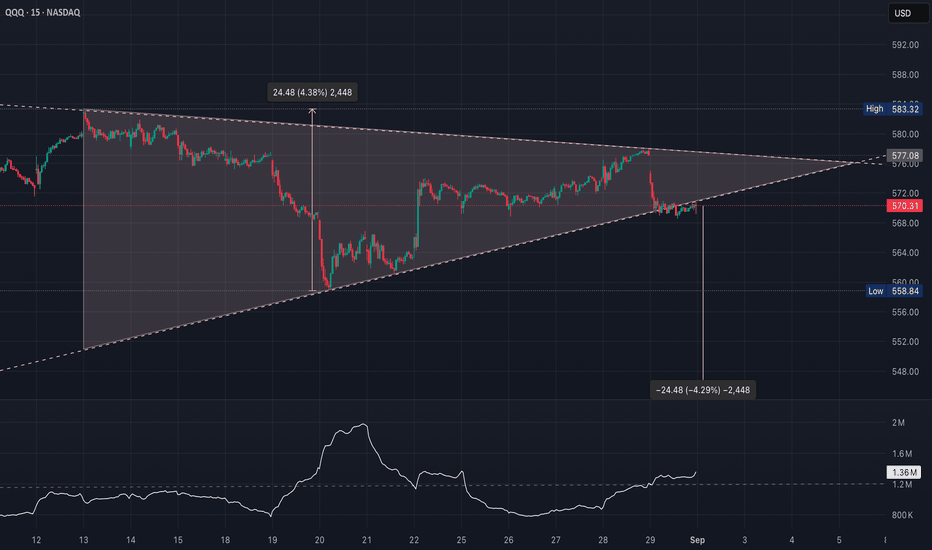
Symmetrical triangle = compression where buyers keep stepping in higher, but sellers cap at lower levels Often a continuation pattern, but it can break either way depending on volume + macro drivers MACD just had a bearish cross earlier, but it’s trying to curl back up which suggests indecision & matches the triangle RSI is holding mid-zone (~45) - not...
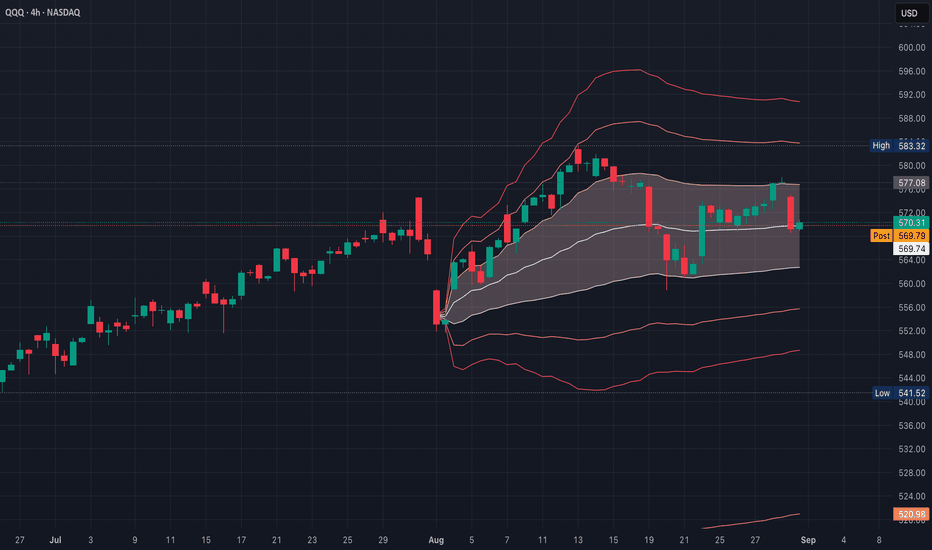
Today’s long red candle shows strong rejection, high conviction selling Today’s 4H bounce at the center band looks more like technical support hold, not yet bullish reversal So short-term the market is testing balance at $570 If it loses $570, downside continuation is favored If it recaptures $576 quickly, squeeze potential kicks in Trigger to watch is a...
A strong red bar, almost full body, closing near its low - that’s a bearish marubozu-type candle (pattern signals a powerful downward price movement & suggests the continuation of a downtrend or a strong potential reversal from an uptrend), which means sellers in control Prior small-bodied candles with upper wicks around $576–$578 look like stalling...
Momentum indicators (like stoch/RSI) are mid-range, so still room either way The dominant developing pattern is an ascending triangle under $580 That favors a bullish breakout if buyers hold $574–$575 If ~$580 fails again, it flips into a short-term pullback What we’ve seen since mid-August looks more like a round bottom recovery than an upside-down “U” ...
2020–2021 Steepening, positive curve Liquidity + stimulus = QQQ ripped higher 2022 Flattening, then inversion QQQ corrected hard which matched the Fed’s aggressive hiking cycle 2023–2024 Deep inversion, recovery in stocks Despite curve being negative, QQQ rallied That was “don’t fight the tape” (liquidity + AI boom decoupled equities from...
Bullish Breakout QQQ breaks and holds above $575 Calls with tight expiry (if momentum is strong) or slightly further out for safer time decay Needs broad tech confirmation (NVDA, AAPL, MSFT, META & etc) Bearish Rejection QQQ fails to push above $575 and stalls Puts with tight expiry for momentum, or stagger entries to scale in If NVDA’s earnings fade...


