saimandali
✅ Technical Summary: 🟢 Current Price: ₹233 (as per your update) 🔹 Resistance Breakout: strong resistance has been broken – this is very bullish. A retest phase usually confirms breakout strength. If it's holding the previous resistance as new support (like ₹220–₹230 zone), it gives high-probability entry opportunity. 🔹 Next Logical Target: ₹300 A move from ₹230...
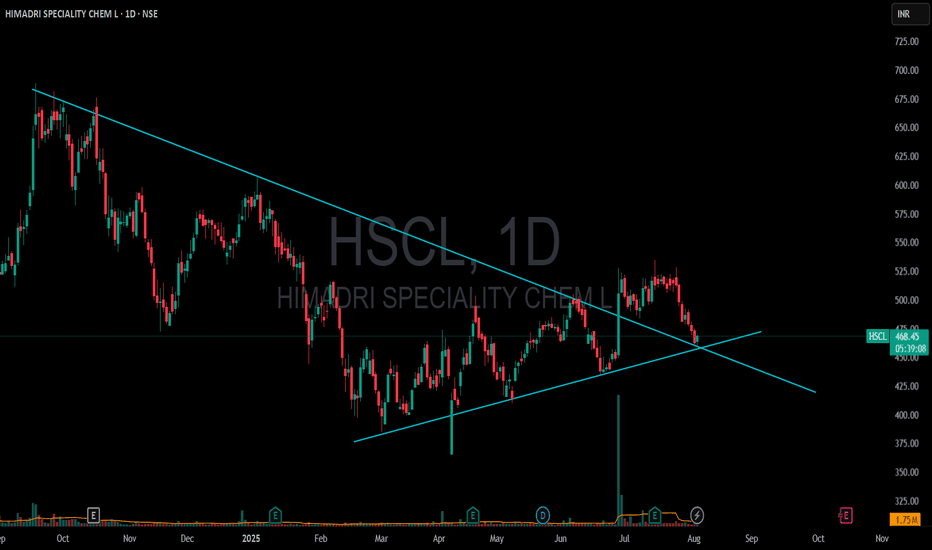
HSCL (Hindustan Steelworks Construction Ltd) is currently trading around ₹467 and you've identified a triangle pattern with a target of ₹900, here’s a brief technical analysis validation and strategy breakdown: 🔺 Triangle Pattern Overview A triangle pattern (ascending, descending, or symmetrical) typically signals a consolidation before a breakout. If you're...
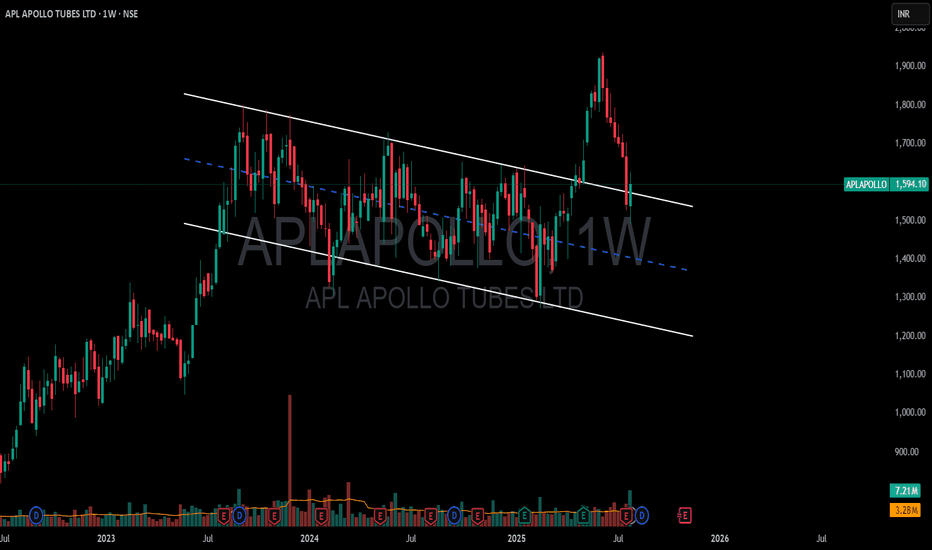
📈 APL Apollo Tubes Ltd. – Bullish Channel Breakout 🔍 Pattern Insight: Pattern: Bullish Channel (Falling or Rising?) Breakout (Most likely a falling channel, which is bullish when broken upward) Current Price: ~₹1594 Breakout Status: ✅ Breakout done Current Action: 🔁 Retest phase underway All-Time High (ATH): ₹1,685 (approx as per recent charts) 📊 Technical...
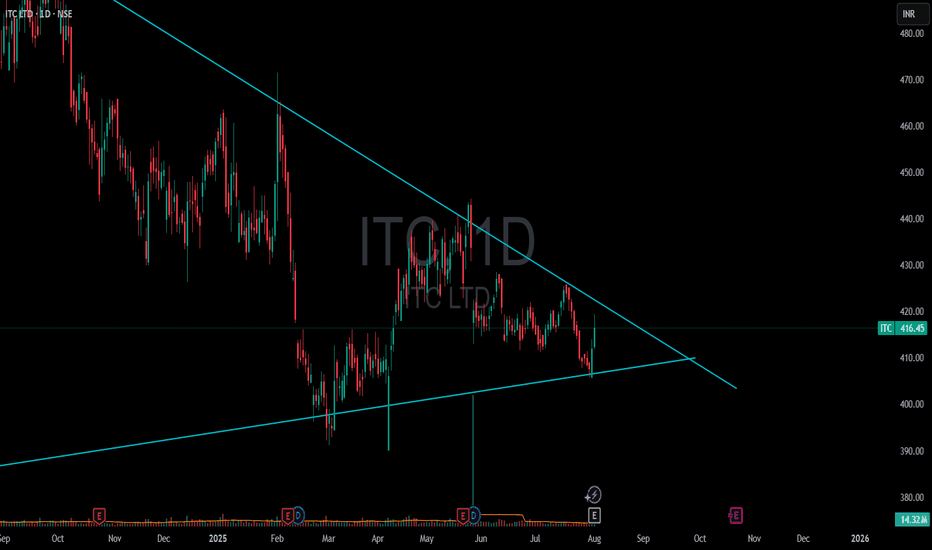
🔺 Triangle Pattern (likely Symmetrical/Ascending Triangle) Current Price Zone: ₹416 Pattern Type: Likely Ascending Triangle (if higher lows are forming against a horizontal resistance) Resistance Level: Around ₹416–420 Breakout Confirmation: Needs a strong bullish candle above resistance with significant volume. 📊 What to Watch: Volume: A genuine breakout...
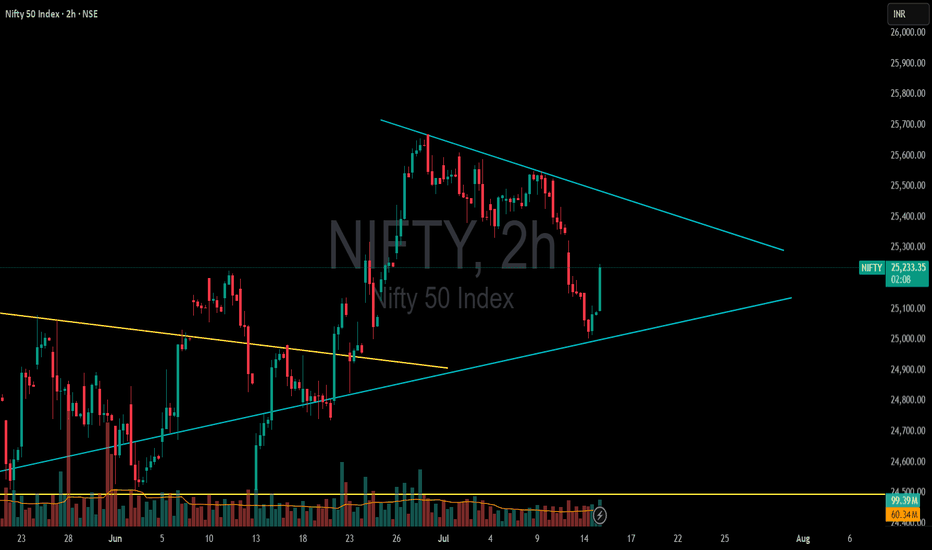
Nifty is currently trading around the 25,200 level and has formed a symmetrical triangle pattern on the chart, which typically indicates a period of consolidation before a major move. This pattern reflects a balance between buyers and sellers, with price making lower highs and higher lows, gradually converging towards the apex. A breakout from this triangle,...
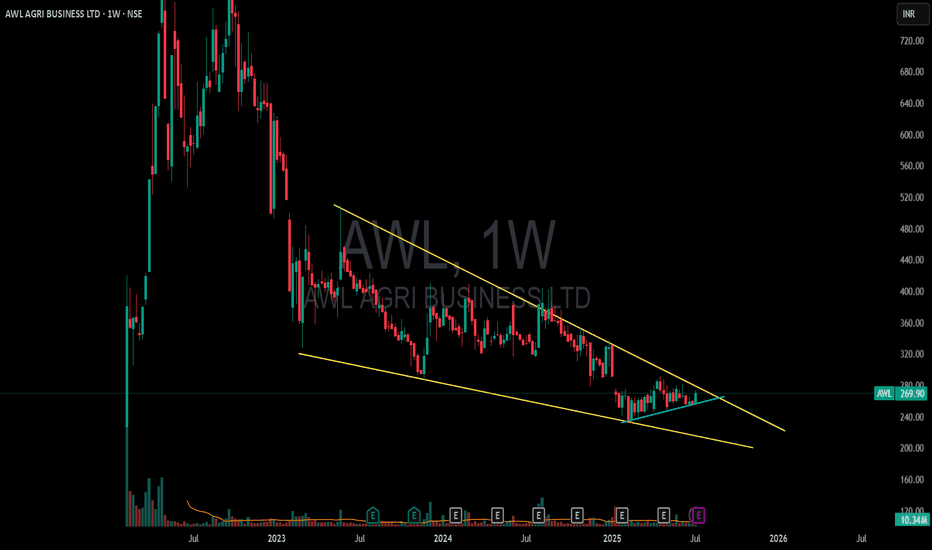
📊 Financial Performance Highlights Q2 FY25 (H1 2024–25) Revenue: ₹14,460 cr (+18% YoY) Net profit: ₹311 cr vs. prior-year loss of ₹131 cr H1 Operating EBITDA: ₹1,232 cr (+349% YoY); PAT ₹624 cr Concall Analysis - read conference calls +5 Angel One +5 ICICI Direct +5 Q3 FY25 (Quarter ended Dec 2024) Revenue: ₹16,859 cr (+31% YoY) PAT: ₹411 cr (+105% YoY);...
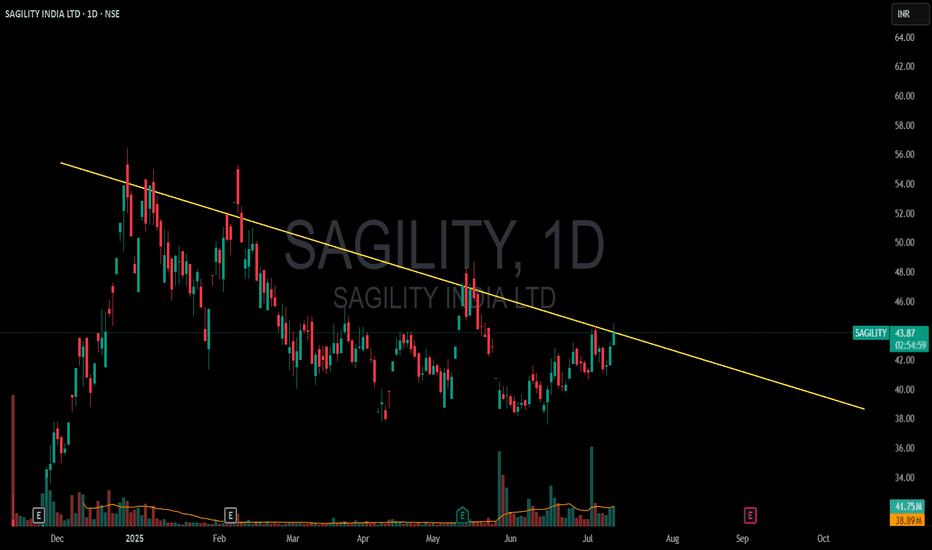
📈 Current Technical & Market Overview Stock price: ₹43.95 – ₹44 range, with significant trading volumes (~38 million shares) TradingView +15 Moneycontrol +15 The Economic Times +15 52‑week range: ₹27.02 (low) to ₹56.40 (high – all‑time high) Investing.com +2 Investing.com +2 ICICI Direct +2 The stock is trading above all its key moving averages...
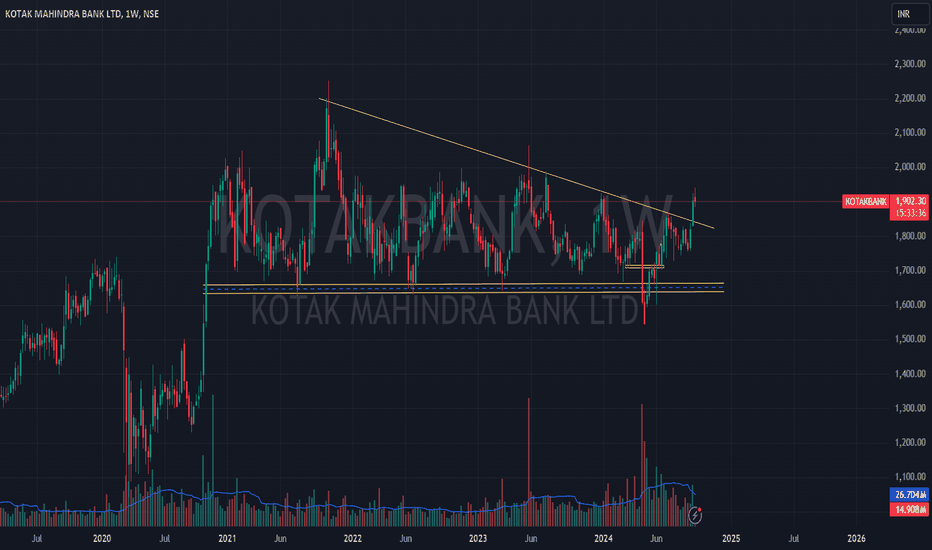
Kotak Mahindra Bank has recently experienced a bullish breakout, indicating a potential upward price movement. Based on technical analysis, the stock is projected to reach the 2400 price level in the near future I'm not a SEBI-registered analyst. All posts and levels shared are just for educational purposes. I'm not responsible for any losses or profits. No...
Capri Global Capital Limited is currently trading around ₹176. The stock has recently broken a key resistance level with significant volume, indicating strong upward momentum. This development suggests potential for further gains, with a possibility of testing or surpassing its all-time high. Disclaimer: The information provided is for educational and...
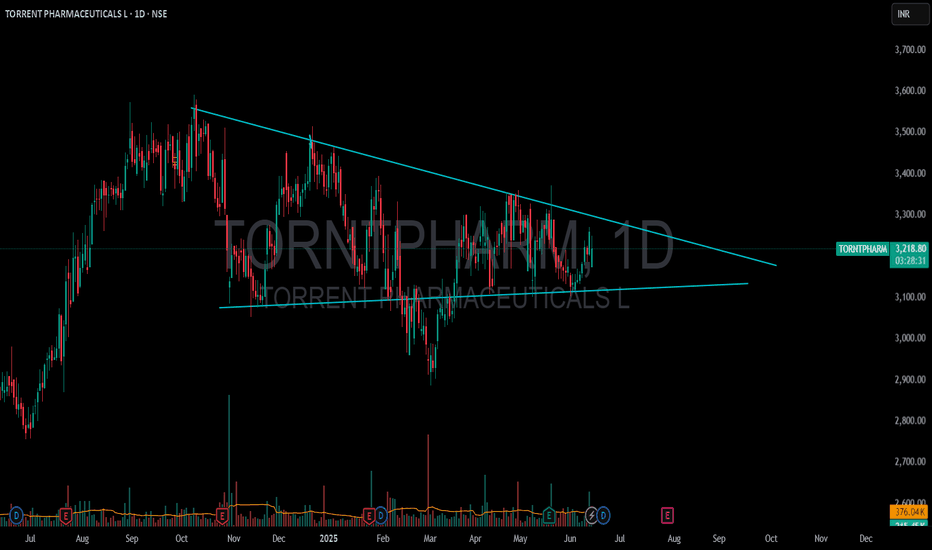
Torrent Pharmaceuticals, currently trading around ₹3,200, is poised to potentially break its all-time high. The stock has formed a bullish triangle pattern, indicating strong upward momentum Disclaimer: The information provided is for educational and informational purposes only and should not be considered as financial advice. Investing in the stock market...
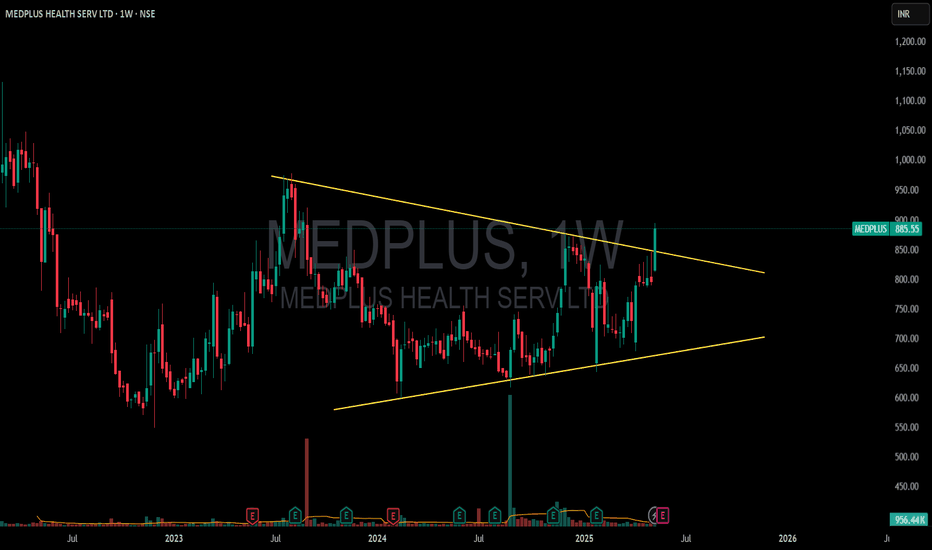
MedPlus is currently trading at ₹885 and forming a bullish triangle pattern. A healthy breakout has been observed, indicating strong momentum. With this trend, the stock appears poised to challenge its all-time high levels Disclaimer: The information provided is for educational and informational purposes only and should not be considered as financial advice....
HDFC Bank appears to be forming a double bottom pattern, indicating the potential for a breakout above the ₹2,200 level in the future. Disclaimer: The information provided is for educational and informational purposes only and should not be considered as financial advice. Investing in the stock market involves risk, and past performance is not indicative of...
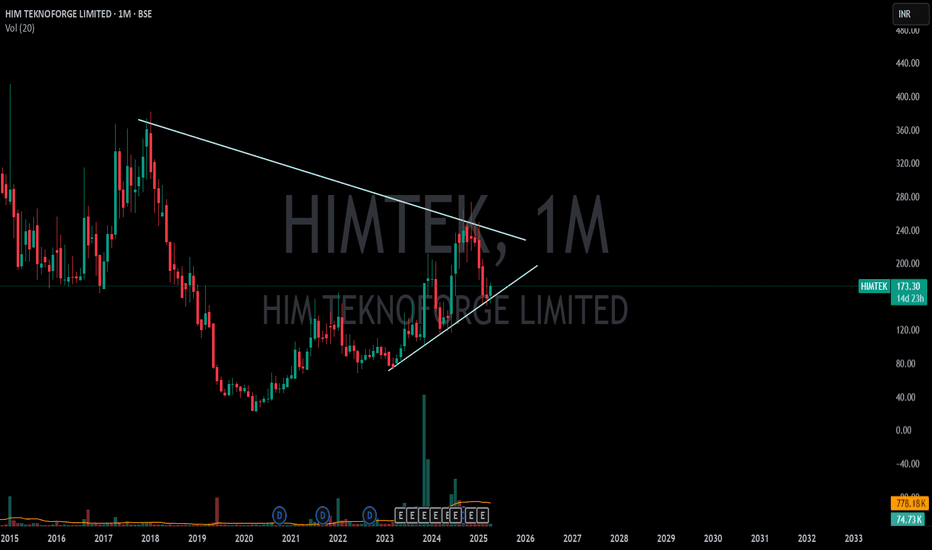
HIMTEK is forming a bullish triangle pattern on the 1-month time frame. The current price is ₹173, and there’s a high chance it could break its all-time high. Disclaimer: The information provided is for educational and informational purposes only and should not be considered as financial advice. Investing in the stock market involves risk, and past performance...
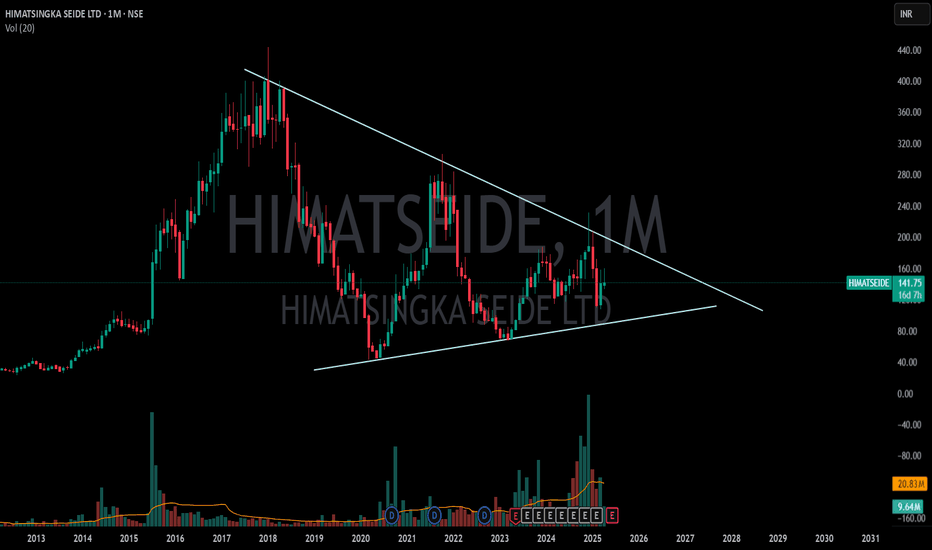
Himatsingka Seide is currently trading around ₹140. If the price breaks above the ₹187 level and sustains at that level, there is a strong likelihood of an all-time high breakout. Disclaimer: The information provided is for educational and informational purposes only and should not be considered as financial advice. Investing in the stock market involves...
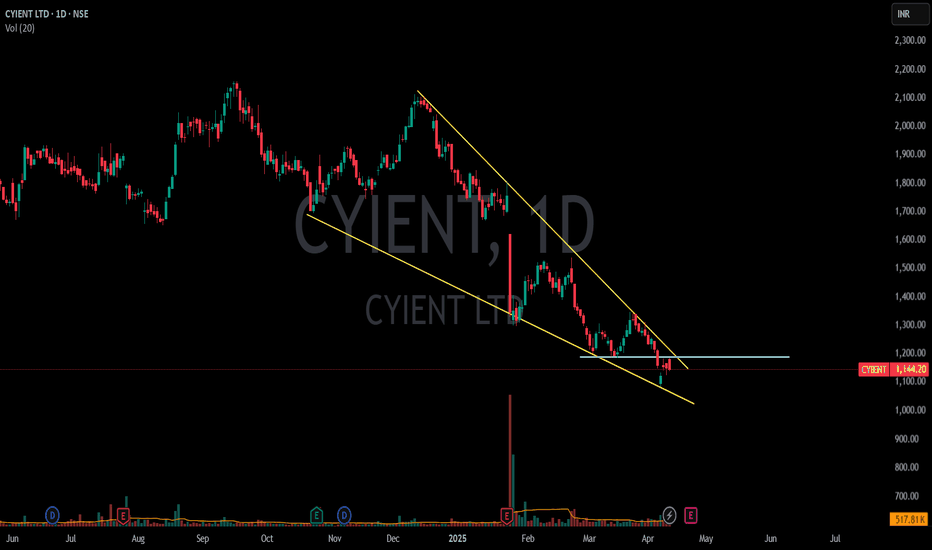
Cyient is currently trading at ₹1,144. If the price sustains above the ₹1,200 level, there is a strong potential for it to rally towards the ₹1,600 mark. Disclaimer: The information provided is for educational and informational purposes only and should not be considered as financial advice. Investing in the stock market involves risk, and past performance is...
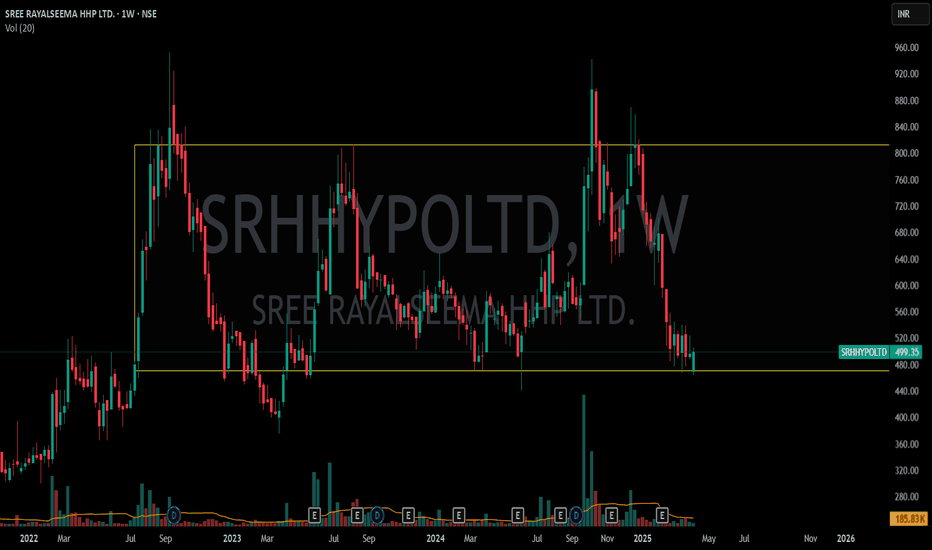
On the weekly time frame, Sree Rayalaseema's price is demonstrating strong respect for the support level. If this trend continues, there is a potential for a significant upward move, possibly leading to a breakout above its all-time high. Disclaimer: The information provided is for educational and informational purposes only and should not be considered as...
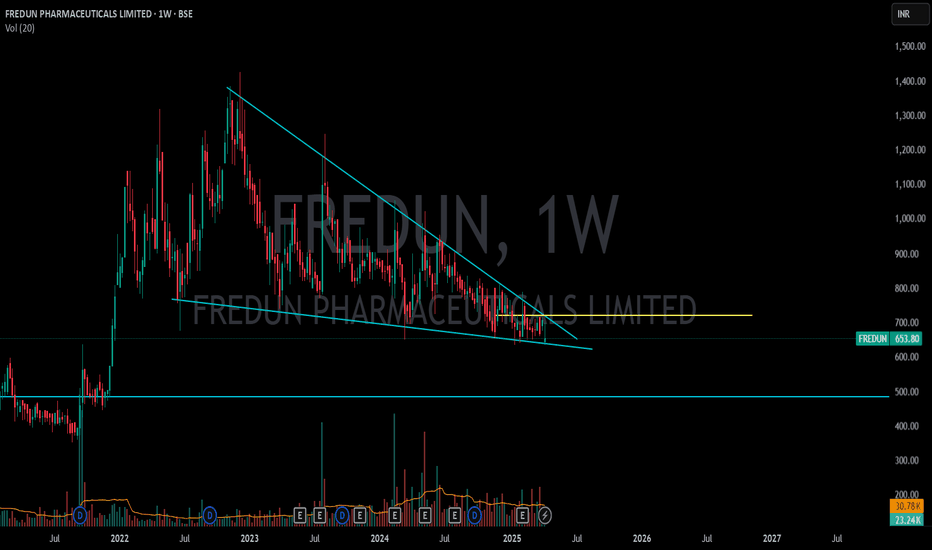
Fredun Pharma is currently trading at ₹653.80 and has formed a historical falling wedge pattern. If the price sustains above ₹724, there is a strong chance it could break its all-time high. Disclaimer: The information provided is for educational and informational purposes only and should not be considered as financial advice. Investing in the stock market...
A cup and handle pattern formation is observed the breakout has seen with a huge volumes I think there will be a good rally in future The information provided is for educational purposes only and not financial advice. Stock investments carry market risks, and past performance does not guarantee future results. Always conduct your own research and consult a...


