snour
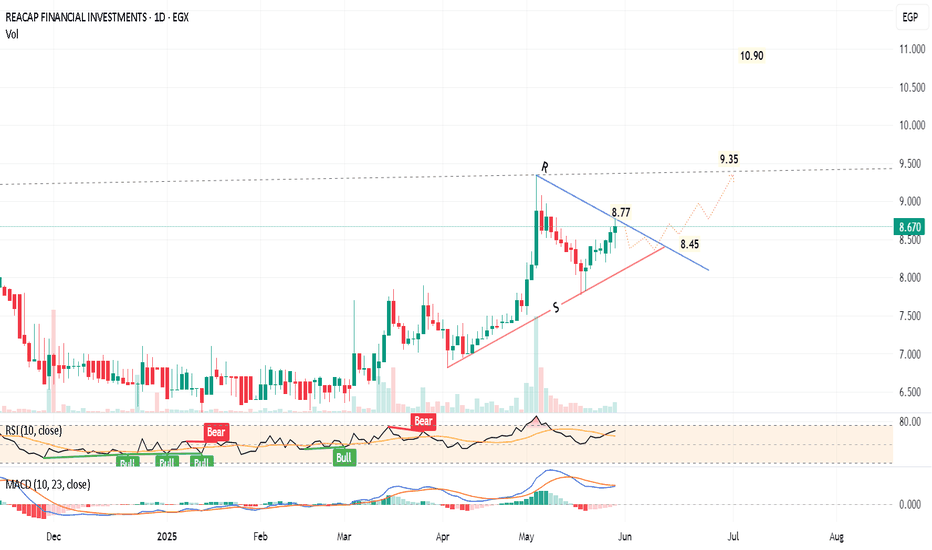
Daily chart, I expect the price EGX:REAC will continue to form a triangle chart pattern. Technical indicators RSI and MACD are positive, and showing a bullish movement - i.e. A soon breakout However, I think after a rally of 7 consecutive green candlesticks, a minor correction should happen to test the support line S. Then, a rebound to test the upper...
Daily chart, The stock EGX:KRDI is rebounding to enter the rising channel. Once above the rising trend line (around 0.607), the target will be 0.750 to 0.760 passing through resistance level at 0.658 Technical indicators: RSI: positive MACD: About to cross up the signal line Entry (buy) can be made now at 0.590 - 0.597, and consider a stop loss below...
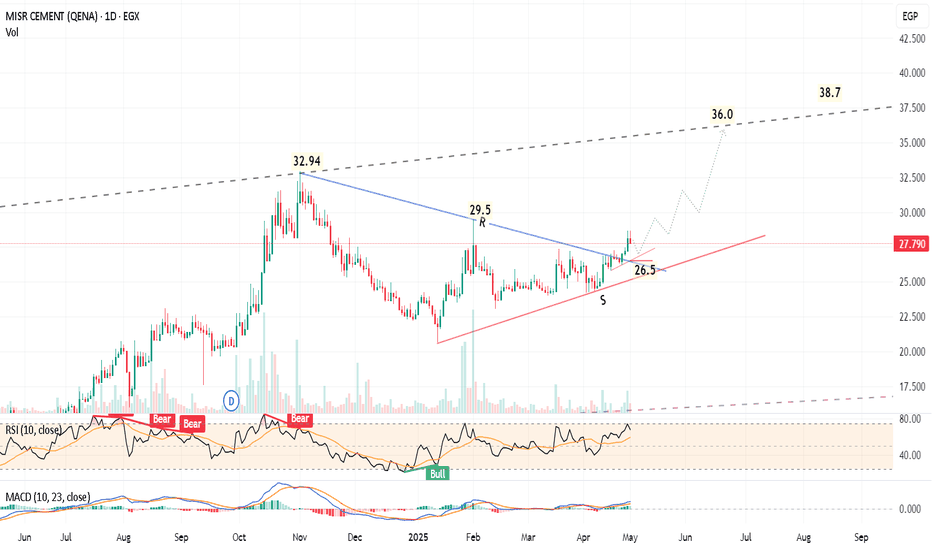
Daily chart, the stock EGX:MCQE has formed a triangle chart pattern, and the target is 36.0 then 38.0 29.5 and 32.9 are resistance levels. Technical indicator MACD is positive and crossed its signal line. RSI is showing a probability to have a minor correction before resuming the bullish movement. Closing below 26.5 - 26.0 for 2 days should be a stop loss...
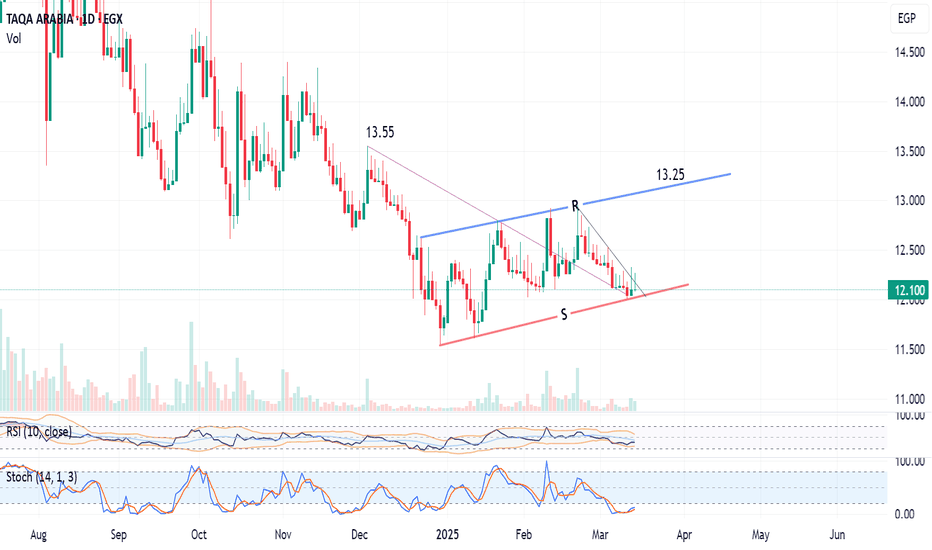
Daily chart, the stock EGX:TAQA is trading in a rising channel, the price reached the support and is supposed to rebound upwards to target the Resistance line R at around 13.25 Consider the new entry Buy above 12.25 (2 days close) for more safety, or buy in parts down to 12.0 Stop loss below 12.00 (for 2 days) should be considered. Note: Closing above the...
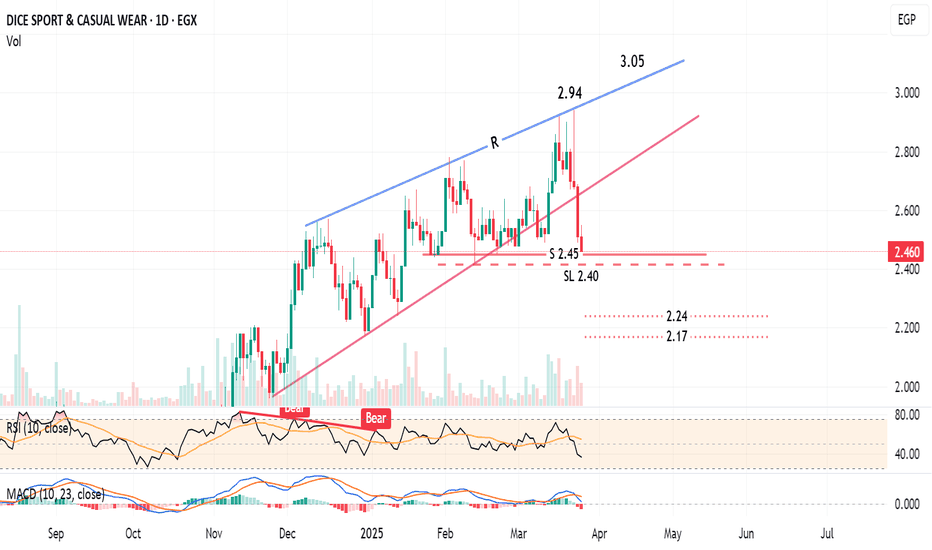
Daily chart, the stock EGX:DSCW broke the lower trend-line of the rising wedge pattern. So, technically this bearish movement should test the pattern target 2.15 However, there are near relatively strong support cushion at 2.45 - 2.42, then a support level at 2.24 A new entry (buy) can be made after 2 days close above 2.51 with high volume, to target 2.75 to...
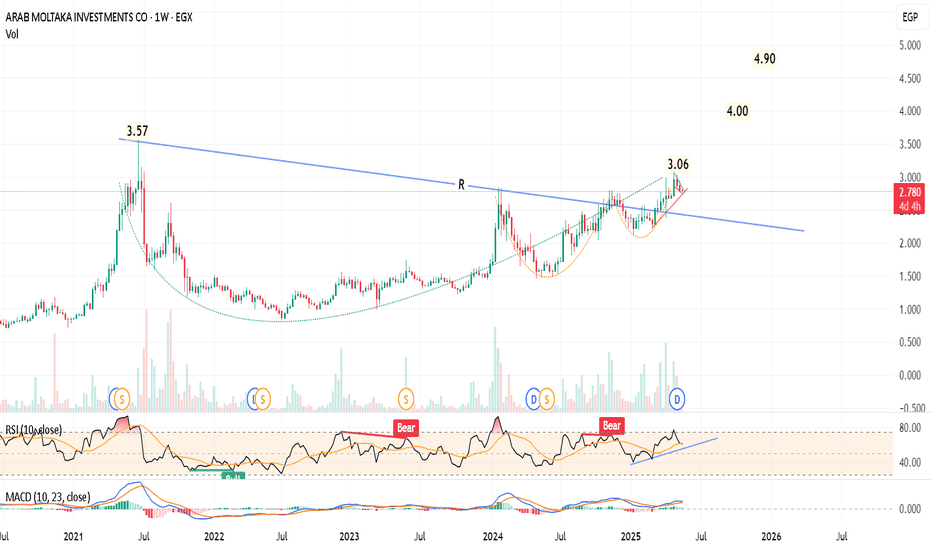
Weekly chart, EGX:AMIA The price crossed up a major resistance line R, and is testing it. In case of trading above 3.06 with high volume for 2 weeks, the target will be 4.90 passing through strong resistance 3.57 (last highest High), then a psychological barrier 4.00 Stop loss below 2.65 Technical indicators: RSI is on a bullish trend, at 62 MACD is positive
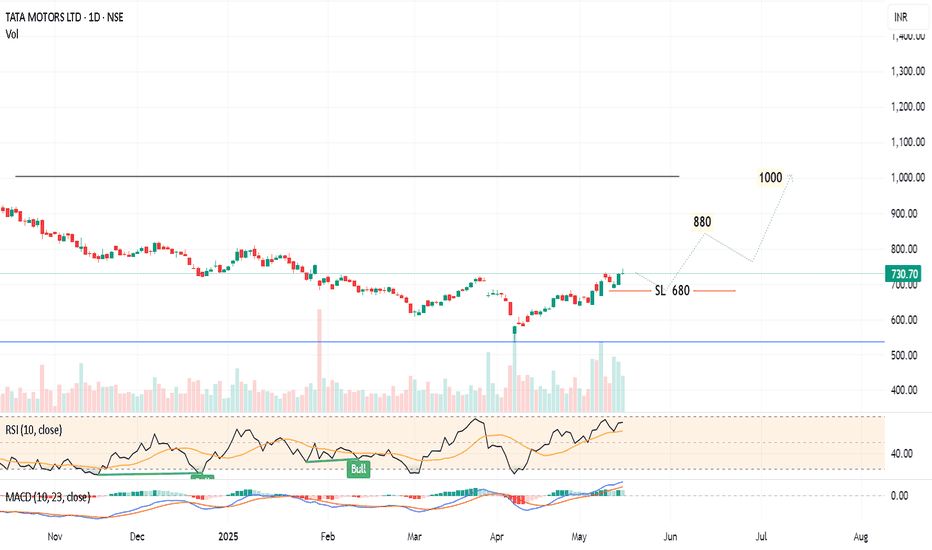
Daily chart, The stock NSE:TATAMOTORS rallied from 535 to 742 since 7 April 2025, and I think a cooling down (minor correction) should take place before resuming the bullish trend. Expected to test the nearest support around 680 Technical indicator RSI is near the overbought zone. A signal that a correction (downwards or sideways) can be soon. So, a new...
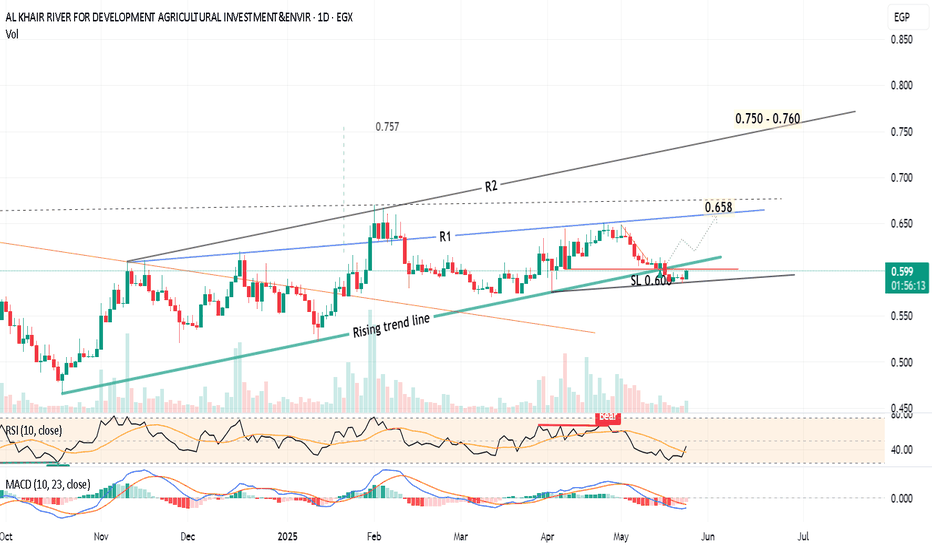
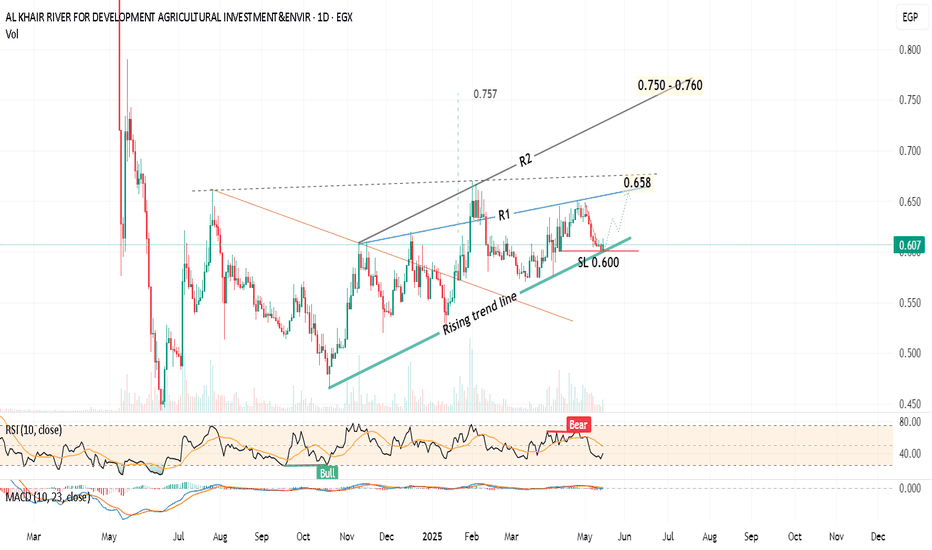
Daily chart, the stock EGX:KRDI has been trading above a rising trend line since Oct 2024. I see the price will rebounce from the current level 0.600 to test the resistance line R1. After crossing R1 line at around 0.650 - 0.658, the next target will be R2 (around 0.750 - 0.760). Technical indicators: RSI and MACD still need confirmation for a new entry...
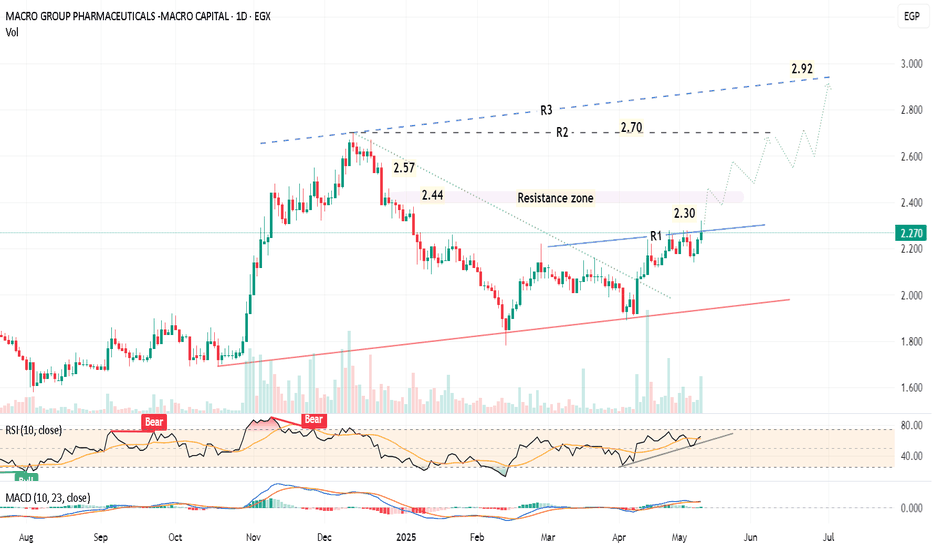
Daily chart, the stock EGX:MCRO price is drawing a rising channel pattern. I expect the price will break out the resistance line R1; to target the line R2, then the line R3 at around 2.92 Some intermediate resistance levels are shown on the chart. A new entry (buy) should be made after closing above 2.30 Stop loss below 2.20 Technical indicators: RSI has a...
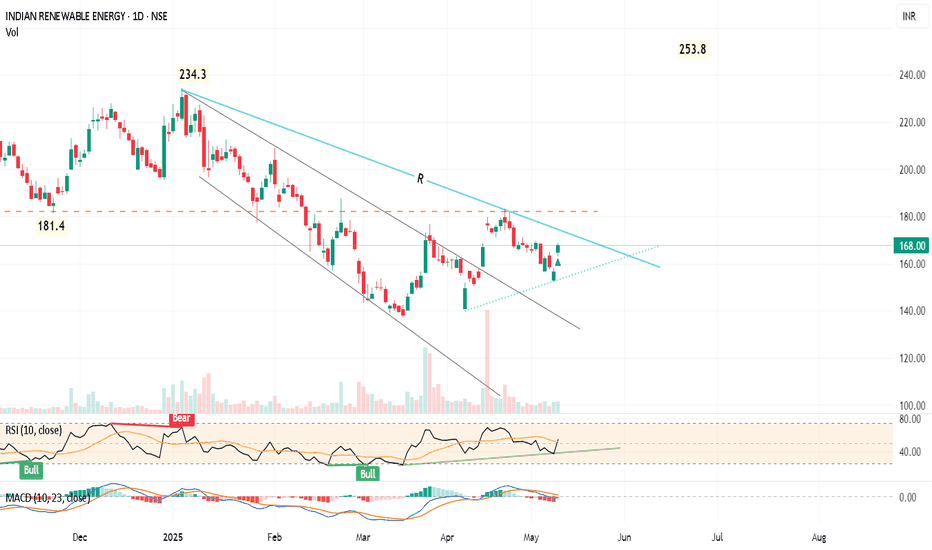
Daily chart, The stock NSE:IREDA has crossed a falling expanding wedge, and the target is 253.8, passing through a strong resistance level at 234.3 However, there is a strong Resistance line R, currently around 172.7 So, after stabilizing above 172.7 for 2 days, the target should be confirmed for a new entry (buy) Consider a stop loss below 154, and raise the...
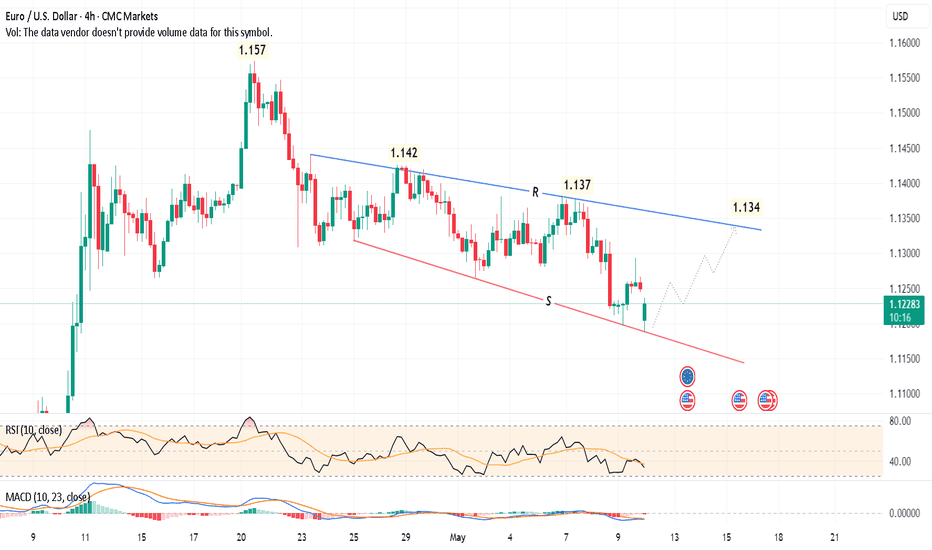
4-hour chart, The EUR/USD CMCMARKETS:EURUSD is trading in a falling expanding (broadening) wedge pattern. The price rebounded from the support level S, and is expected to test the upper resistance line R - at around 1.134 After crossing the line R, and stabilizing for 12 hours above this level, the target will be 1.157 to 1.159 - passing through the shown...
Daily chart, The stock NSE:IREDA has crossed a falling expanding wedge, and the target is 253.8, passing through a strong resistance level at 234.3 However, there is a strong Resistance line R, currently around 172.7 So, after stabilizing above 172.7 for 2 days, the target should be confirmed for a new entry (buy) Consider a stop loss below 154, and raise...
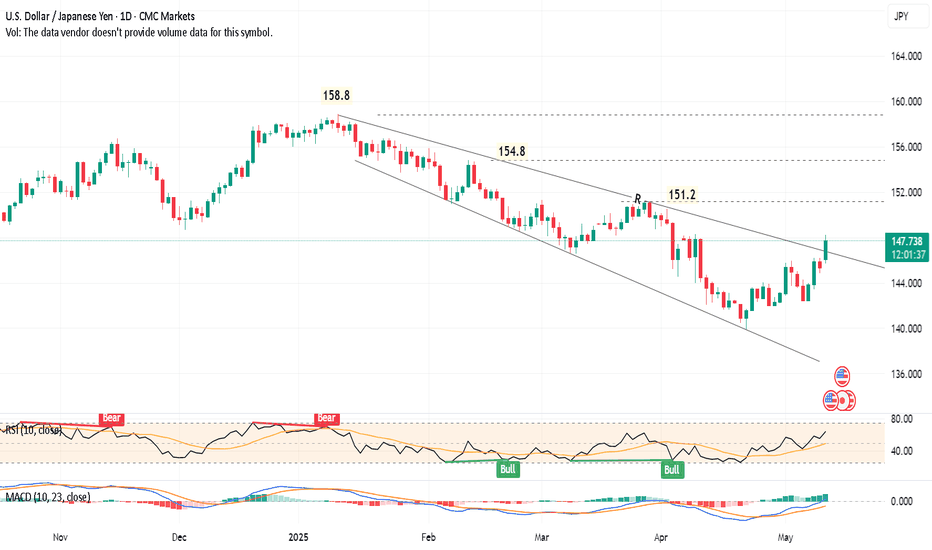
Daily chart, USDJPY CMCMARKETS:USDJPY price is forming a falling expanding wedge pattern. After clear crossing of the line R, and stabilizing above it for 2 days, the target will be 165.5 Note that there are resistance levels on the way, especially the strong historical High (at 161.95)! Stop loss below 145 - Consider a rising stop loss level as the price...
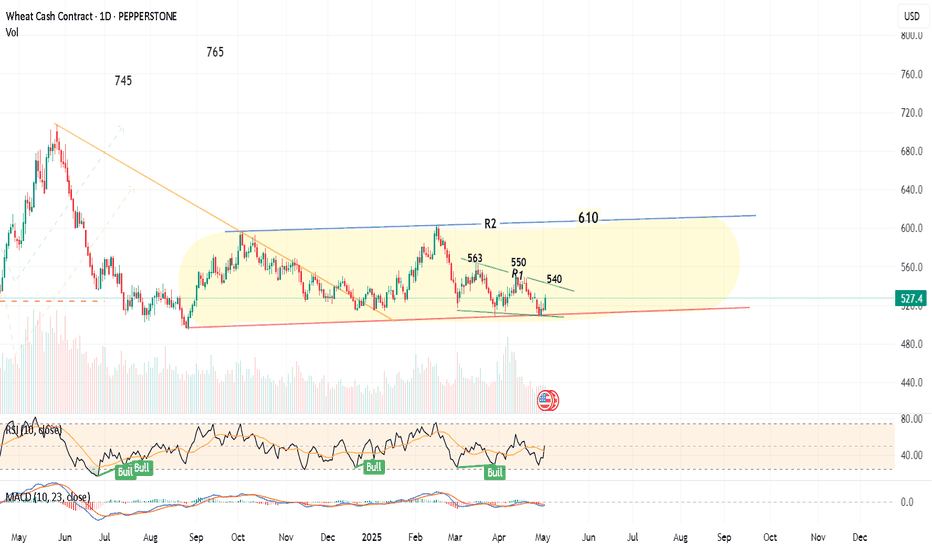
Daily chart, The commodity WHEAT - cash contract - PEPPERSTONE:WHEAT is trading in a soft rising channel (yellow), and the price should test the line R1 at around 540 - After crossing, the target will be towards the channel upper line R2, around 610 , passing through the resistance levels 550 and 563 Stop loss below 505 to be considered. Technical...
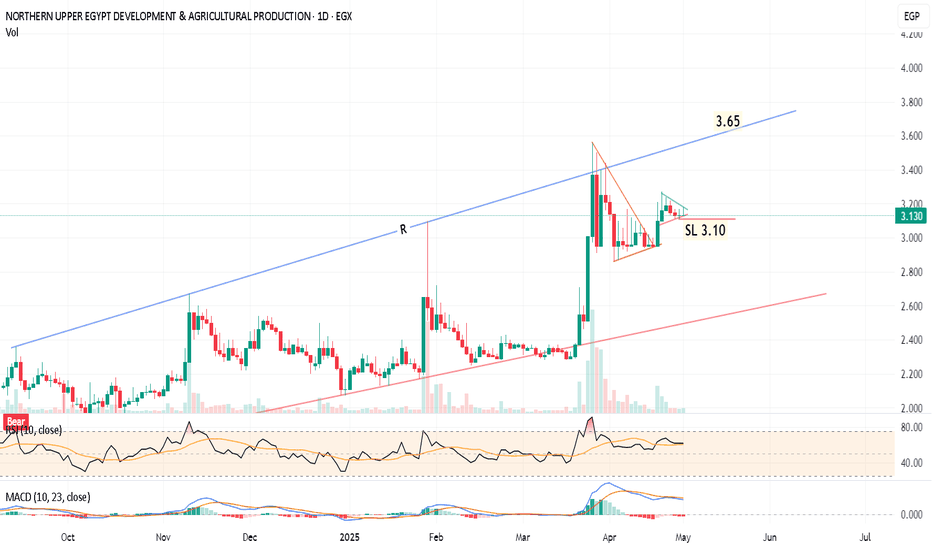
Daily chart, the stock EGX:NEDA formed a pennant chart pattern and is forming another smaller pattern. I am expecting some minor correction and consolidation around 3.10 Then, a bullish movement towards the resistance line R, at around 3.64 - 3.67 Stabilizing for 2 days above 3.70, will push the price to the next target 4.25 Note the resistance levels at...
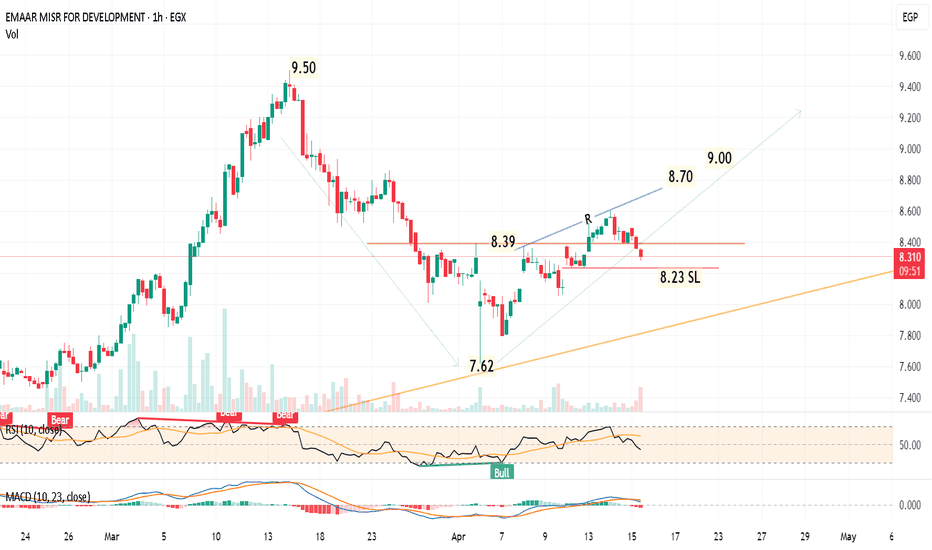
1-hour chart The stock, fell from 9.50 to 7.62, and rebounded to 8.60, then it is under minor correction in the bullish direction. A new entry Buy will be after closing above 8.40 for 2 hours, the target will be 8.70 then 9.00 Also, buying in parts from 8.30 to 8.24 is OK with a higher risk and higher profit. Consider a stop loss level below 8.23
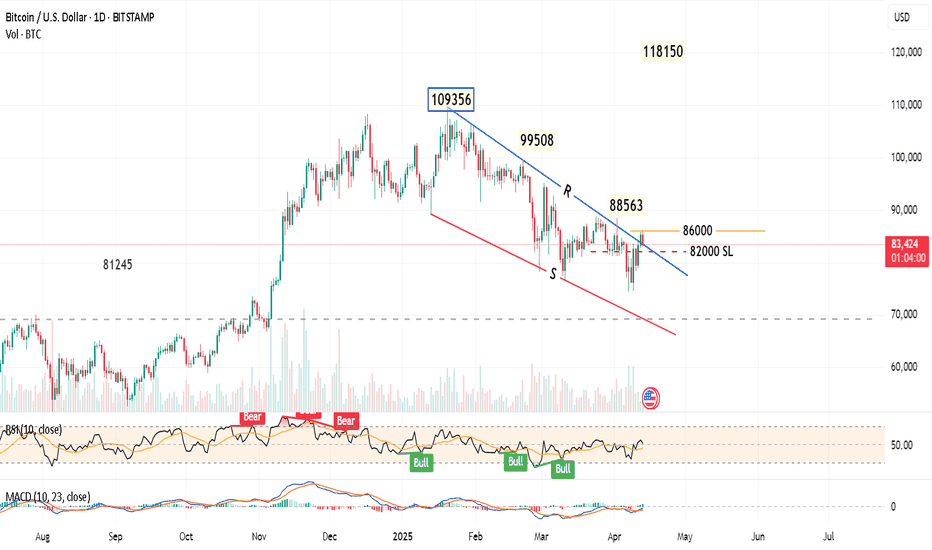
Daily chart, The Bitcoin BITSTAMP:BTCUSD has just formed a falling wedge pattern, down from the highest High 109356. Some consolidation may happen in the range 86000 to 82000. Closing above 86000 for 2 days will give a strong buy signal for a bullish movement, and the target will be 118150 passing through the shown resistance levels. Consider the Stop Loss...
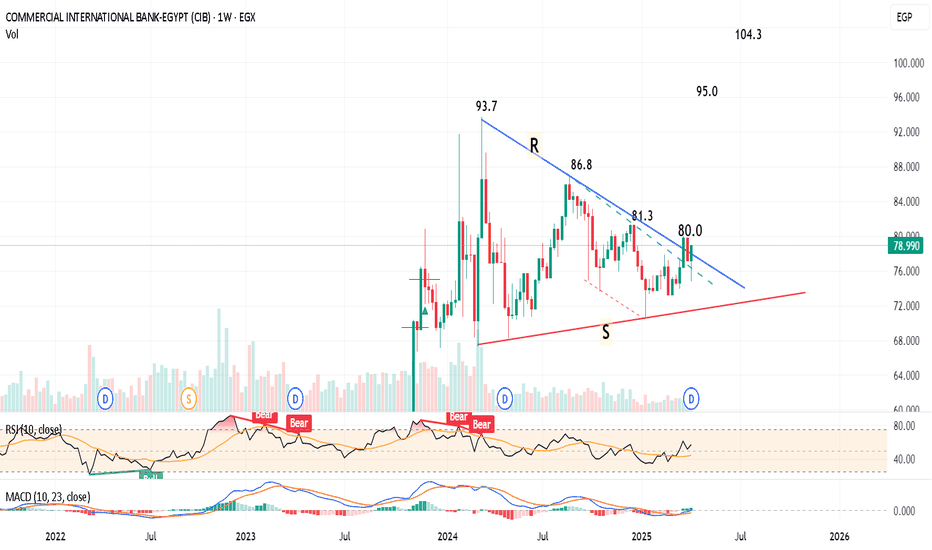
Weekly chart, The stock EGX:COMI has formed a symmetrical triangle chart pattern, and crossed the Resistance line R. One more week above R, to confirm, the target will be 104.3 - passing through several resistance levels as shown on the chart. A new entry (buy) can be made immediately before confirmation with higher risk, and consider a stop loss below...
