tradeflowadvisors
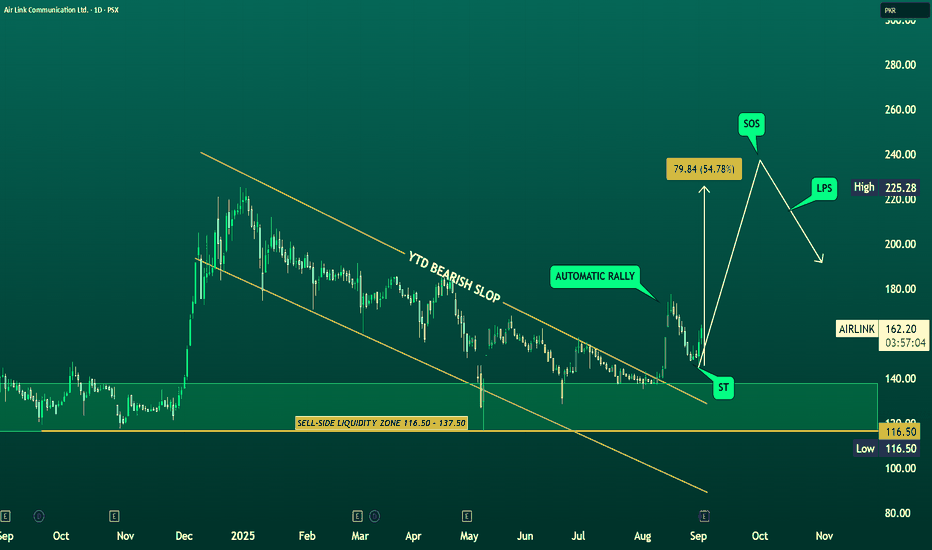
Plus#Airlink has started to show the classic signs of a Wyckoff Automatic Rally (AR) after months of persistent decline. The stock found strong demand inside the sell-side liquidity zone of 116.5–137.5, which acted as a potential Selling Climax (SC) where weak hands exited and stronger players absorbed supply. From there, the sharp bounce towards 161+ marked the...
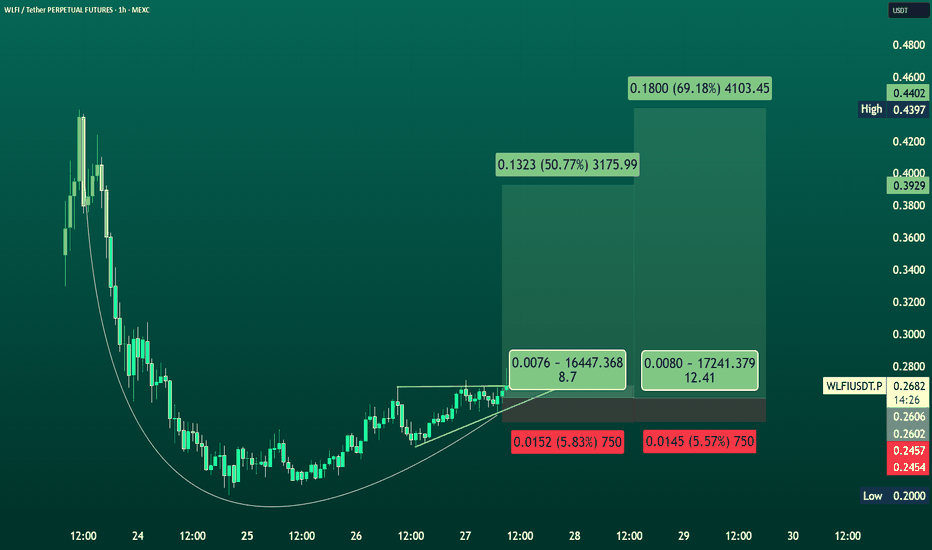
Current Price: $0.2690 WLFI/USDT is showing a bullish recovery pattern on the 1H chart after bottoming near $0.245. Price has reclaimed short-term support and is pushing toward Fibonacci extension levels. A trade setup here offers a favorable risk/reward ratio (2:1 to 3:1+), with defined stop-loss support and upside targets aligning with $0.317, $0.344, and...
WLFI/USDT is showing bullish recovery around 0.32 USDT after consolidation. If momentum sustains, upside targets are 0.38–0.42 short-term, 0.49–0.55 mid-term, and possibly 0.70+. Key support is 0.246–0.28; losing this may retest 0.20. WLFI/USDT trading at 0.32 USDT, showing bullish recovery after consolidation. 🎯 Targets Near-term: 0.38 – 0.42 Mid-term: 0.49...
PINL closed strong at 9.31 (+10.18%) on heavy volume, signaling momentum after a long consolidation. The stock has built a solid base between 8.00 – 9.50, with 8.20 acting as key support. As long as this level holds, the structure remains bullish. A breakout above 9.50 – 10.00 can trigger the next leg higher toward 11.50 – 12.50, while downside risk stays limited...
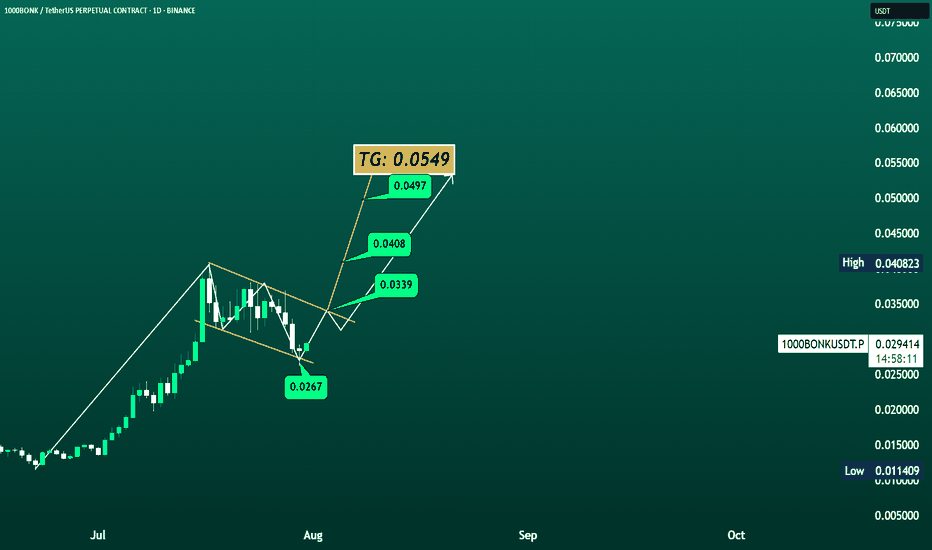
1000BONK/USDT Overview (1D Chart) 1000BONK has completed a falling wedge breakout from the 0.0267 low and is showing bullish momentum. Key resistance levels to watch are: 📌 0.0339 📌 0.0408 📌 0.0497 🎯 Target: 0.054
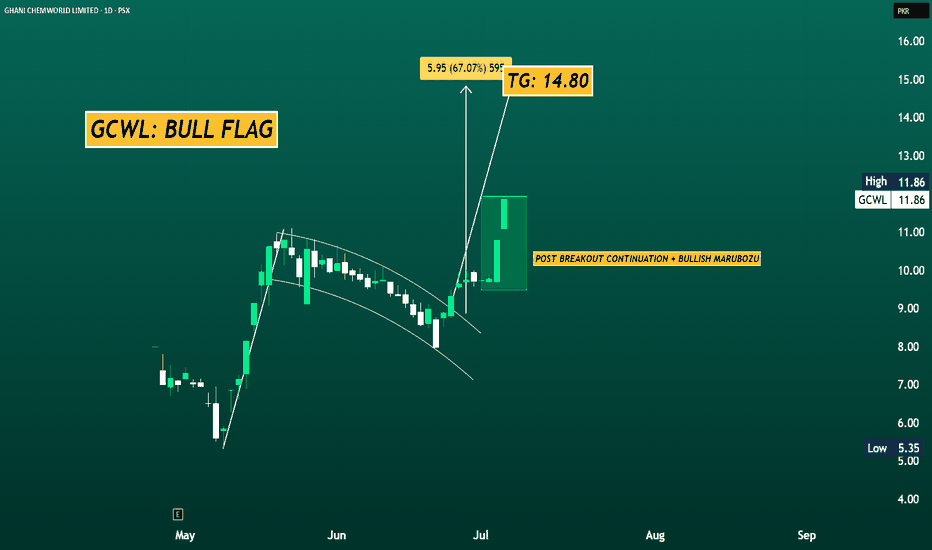
GCWL has broken out of a bull flag with a bullish marubozu now targeting 14.80, offering a ~25% upside from current levels. Holding above 11 supports the continuation.
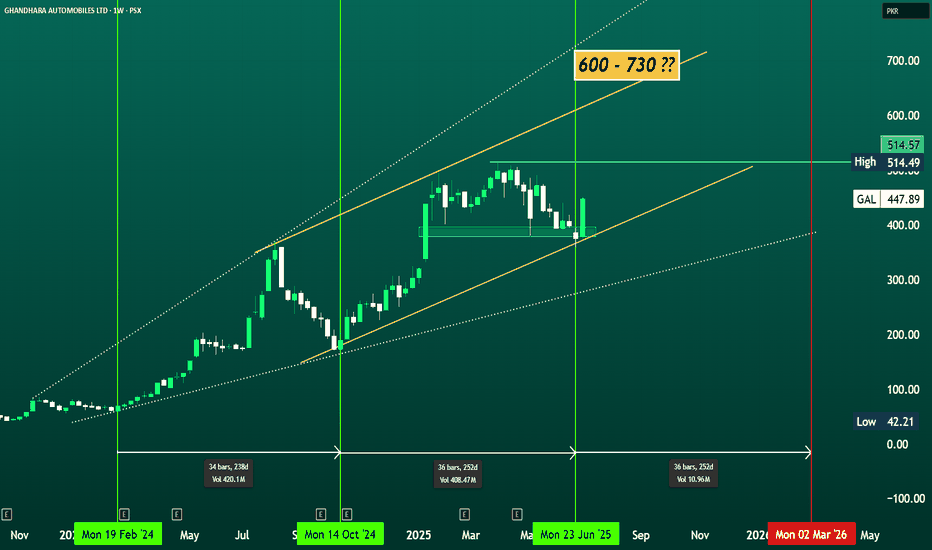
#GAL (WEEKLY): Targeting 600 – 730 by Q1 2026 CMP: 447.89 #GAL seems to follow a cyclical rhythm of ~34–36 weeks (approx. 8–9 months) between impulsive rallies. After strong rallies from Feb 2024 to Oct 2024, and again Oct 2024 to Jun 2025, a similar cycle is now in motion. The most recent bounce near trendline support aligns with the next cycle start (June...
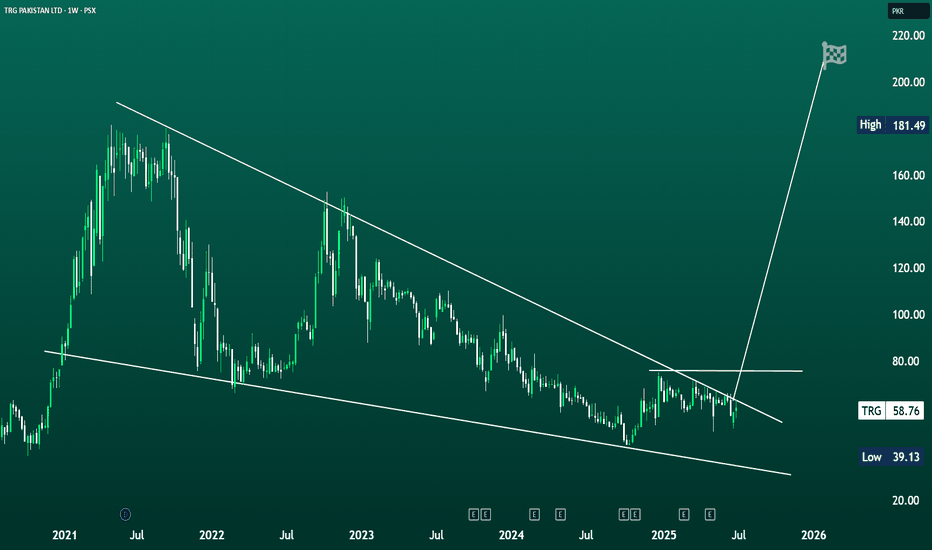
TRG ELITE KATCHRA💎 CMP: 58.76 From forgotten junk to potential multi-bagger 2x... 3X...4X...? will see what unfolds... TRG is showing signs of a potential long-term reversal after a multi-year downtrend. Price action is compressing within a large falling wedge pattern, typically a bullish formation. A breakout above the upper trendline (~60–62) with volume...
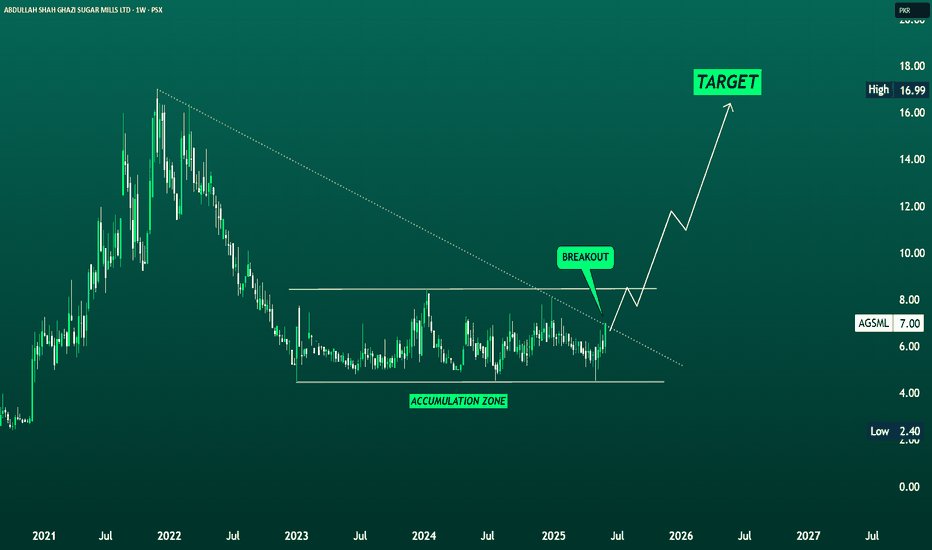
📈 AGSML (Abdullah Shah Ghazi Sugar Mills Ltd) – Technical Analysis AGSML has confirmed a breakout from its long-term downtrend line after a prolonged accumulation phase around the PKR 4.5–6.5 range. The stock closed at PKR 7.00, gaining +18.64%, and is now positioned above key Fibonacci retracement levels — signaling a potential trend reversal. With this...
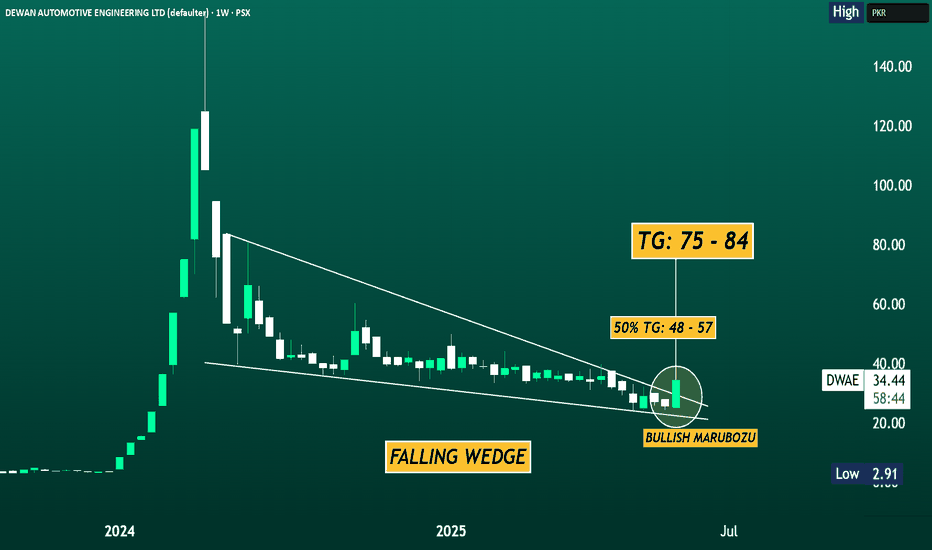
📈 DWAE (Dewan Automotive Engineering Ltd) - TECHNICAL VIEW Dewan Automotive Engineering Ltd (PSX: DWAE) has delivered a decisive breakout from a long-standing falling wedge pattern, accompanied by a powerful bullish marubozu candle on the weekly chart. The stock surged by +34.01%, closing at PKR 34.44, signaling the potential start of a new uptrend after an...
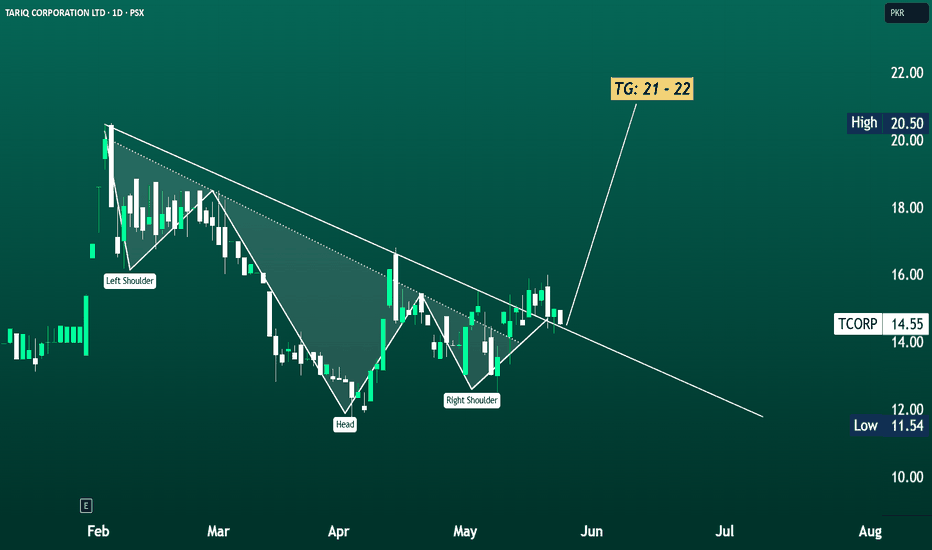
📈 TCORP (Tariq Corporation Ltd – Hussein Sugar) TCORP has triggered a classic bullish reversal pattern with a clear breakout from an Inverse Head & Shoulders formation on the daily chart. After forming a solid base with the Left Shoulder, Head, and Right Shoulder, the price has now convincingly broken above the neckline near PKR 14.80–15.00, confirming the...
HALEON Pakistan Ltd (PSX: HALEON) is currently undergoing a correction phase after a strong bullish rally. On the weekly chart, the stock is consolidating within a descending wedge pattern, typically a bullish reversal setup if broken to the upside. The price is hovering around 727, near a critical support zone (700–715), which has held well so far. If this zone...
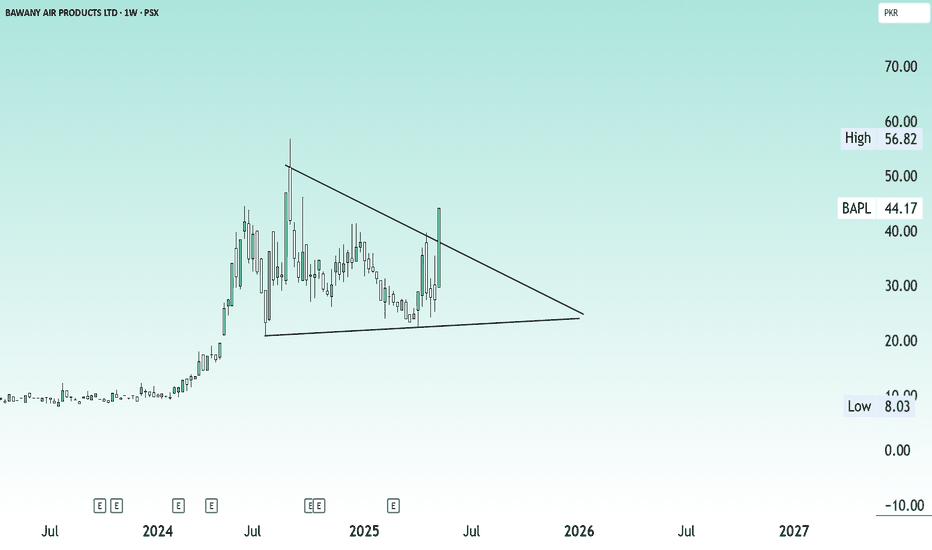
Bawany Air Products Ltd (BAPL) has delivered a powerful breakout on the weekly chart, surging by an impressive 61.09% to close at 44.17 as of May 18, 2025. This move marks a clear breakout from a long-standing descending triangle pattern, signaling a shift from a consolidation phase to a fresh bullish trend. The breakout is technically significant and suggests...
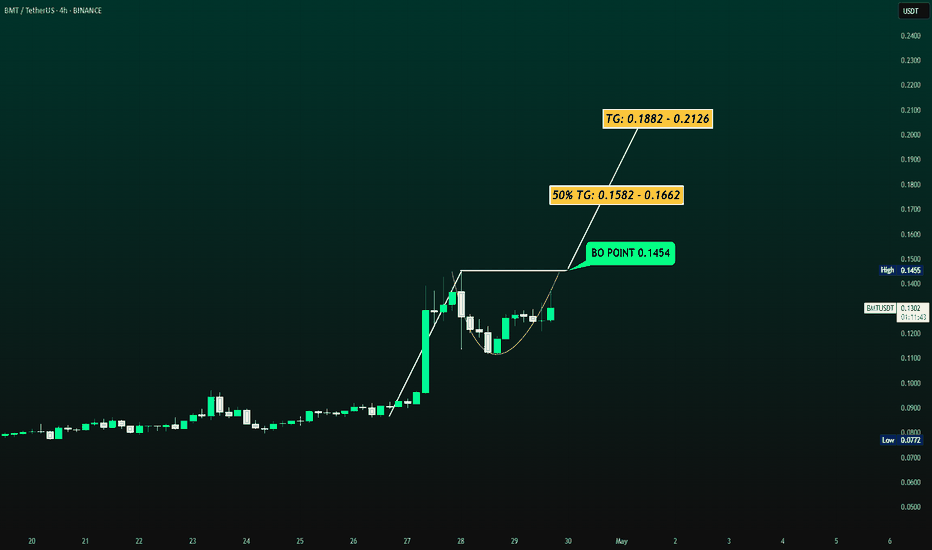
BMT/USDT – Bullish Cup & Handle Breakout Setup on 4H Chart ☕🚀 BMT/USDT has formed a classic Cup & Handle pattern on the 4H timeframe and is gearing up for a breakout above the neckline zone (0.1454). The price is currently hovering around 0.1321 with increasing volume, suggesting bullish momentum is building. Fibonacci extensions project key upside targets...
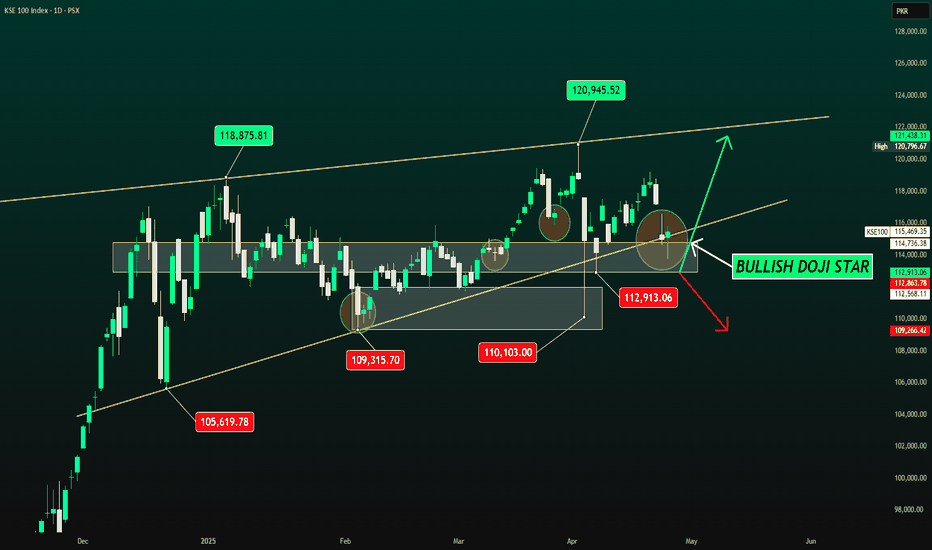
PSX - Bulls Regain Control: Rebound Sets Stage for 120K (IA)🚀✌ KSE-100 Review: Last week, I highlighted exhaustion signs after a strong bearish divergence on the KSE-100. As expected, the market showed stabilization and validated the previous technical outlook. On Friday, the index dipped to a low of 113,716, but strong buying emerged from critical support...
On a technical side, we had a strong bearish divergence as i said yst now exhaustion seems to be completed, hopefully will have a reversal tomorrow KSE-100 Index – Bullish Doji Star Near Channel Support The KSE-100 has pulled back to a critical confluence zone near 114,500–115,000, where the lower channel trendline, horizontal support, and previous demand zones...
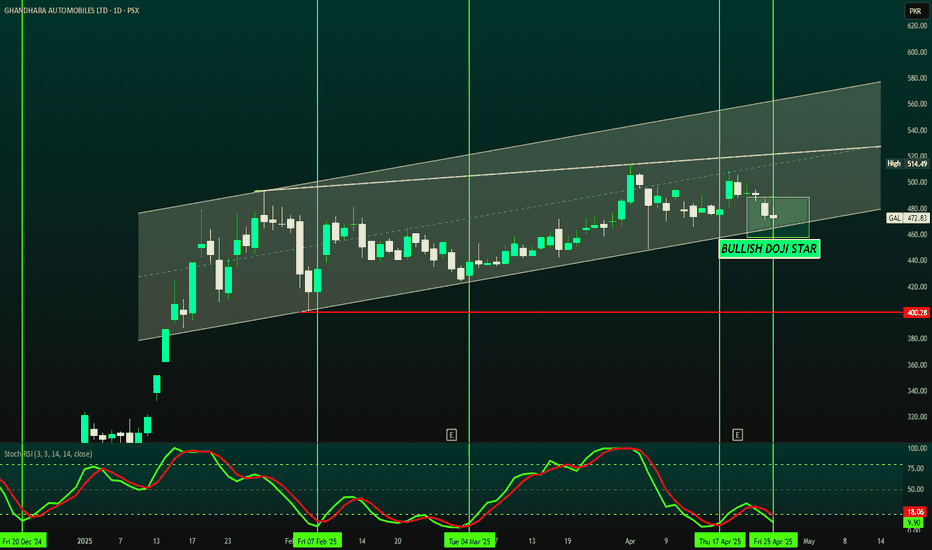
GAL (Ghandhara Automobiles) – Bullish Setup Emerging; LDCP: 472.83 Ghandhara Automobiles (GAL) is respecting its rising channel beautifully. A Bullish Doji Star has appeared near the lower boundary of the channel, signaling a potential reversal. The Stochastic RSI is extremely oversold (below 10), strengthening the case for a rebound. As long as GAL holds...
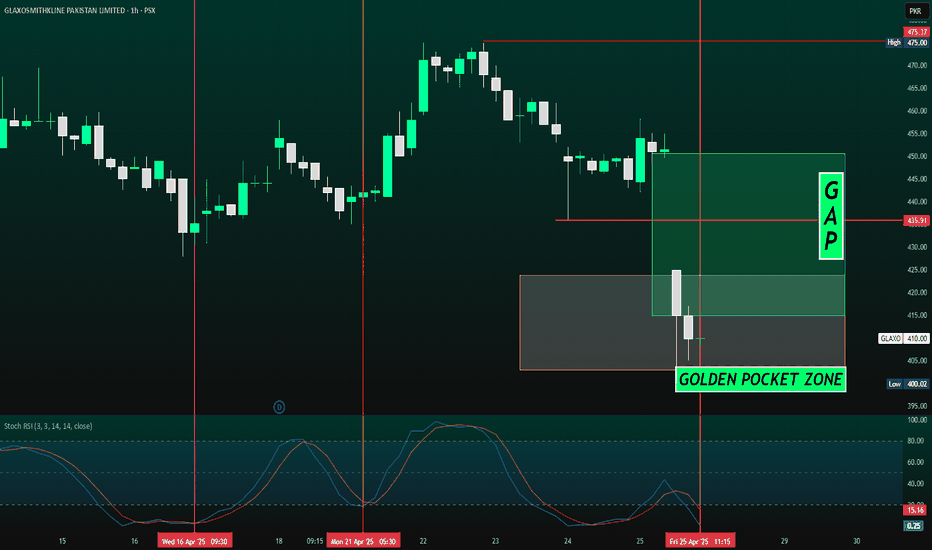
📊 GLAXO-1H (PSX) – Short-Term Analysis; Targeting: 435 - 475 CMP: 410 GlaxoSmithKline Pakistan Limited (GLAXO) is currently trading within a critical Golden Pocket Zone, between the 50% and 61.8% Fibonacci retracement levels, around 423.69 to 411.50. This zone often acts as a strong support area where price reversals are highly probable. The Stochastic RSI is...
