tstrazza38
Last seen
Followers
0
Following
1
Ideas
2
Scripts
0
Joined Mar 7, 2019
chartpattern
Less Tags
Show All Tags
All Types
Type
All Types
Indicators
Strategies
Libraries
All Accesses
Script access
All Accesses
Open
Protected
Invite-only
Public & Private
Privacy
Public & Private
Public
Private
Quick look at the ascending triangle breakout seen in MSFT this past year. Discusses peaks creating resistance/support lines, and some candlestick/pattern analysis.
0
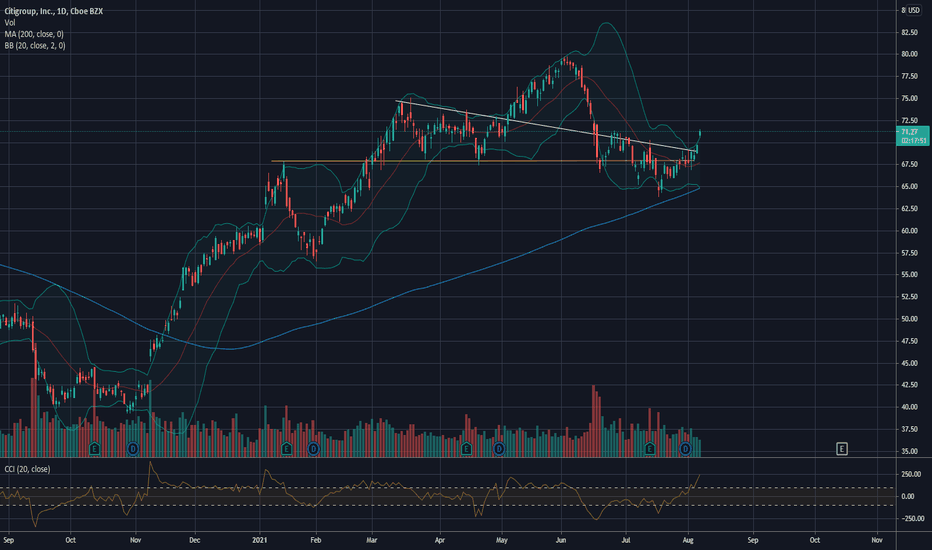
Citigroup (C) looks like its getting ready for another move up. After falling all of June and July, its appears to have bounced off the positive 200 day MA. Although volume isn't as high as you'd like for a breakout, the CCI looks very strong. All that combined with the descending triangle breakout, the 20 day MA cross, and the upper bollinger band being hit -...
3
User has no followers
1728
1317
8875
Message
Follow
Following
Unfollow
Type
Script access
Privacy


