tushargupta1991
Uber seems to be starting a wave C of a flat correction. Hence a short term sell can be explored for this ticker.
LULU seems to giving a bearish correction and is in its C wave down. It's giving a small flag right now which upon break should continue the down move.
Boeing appears to be in ABC correction with a good move down.
We have 1 = 3 and alternation in 2 and 4. 5th wave could have started or we might have one more low following which the final move up starts.
Gold is in a triangular correction. Breaking the high would imply an impulse up.
OIL is forming a nice flag in 4h chart. A break of this gives a sell for a new low in its neighborhood. But on monthly chart it has completed a 61% retracement so it's poised for a long term move up.
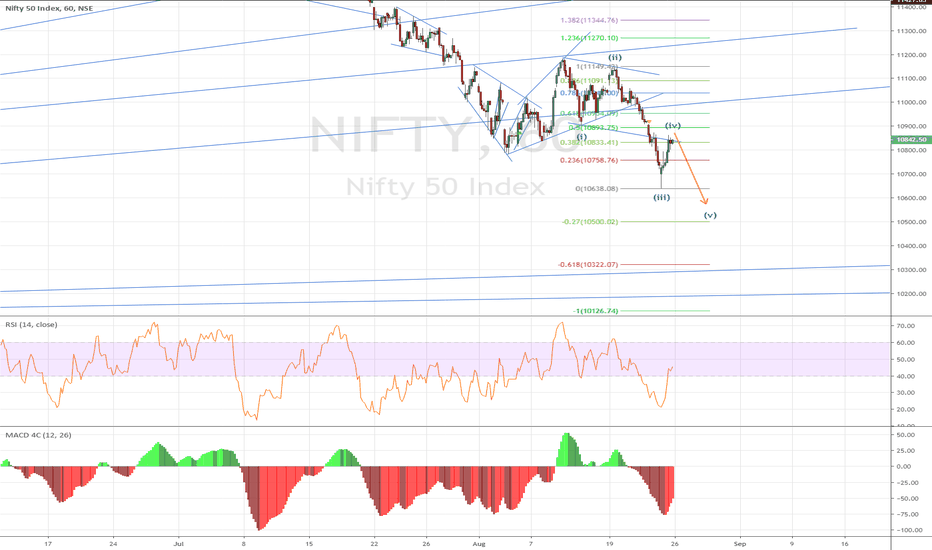
Nifty seems to be completing a 5 wave count with 1 = 3.
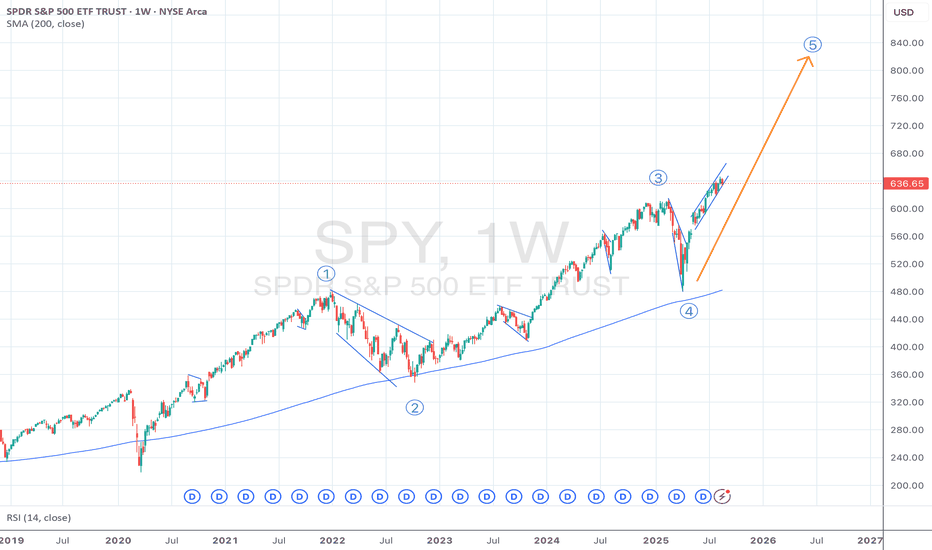
SPX seems to be in a 5 wave upward trend. We see alternation in waves 2 (subdividing) and 4 (sharp move down). We also see that 1 = 3 and 5 so far is 5 = 0.618*1 hence the pullback. Both 2 and 4 have retraced 1 and 3 exactly 50%. The target for wave 5 should either be 0.618*1 or 1.618*1 giving us a pretty bullish move ahead. Will publish short term view in a separate post.
A good place for SPX short from an important resistance. 2 fib resistance coming up from 2 different time frame waves.
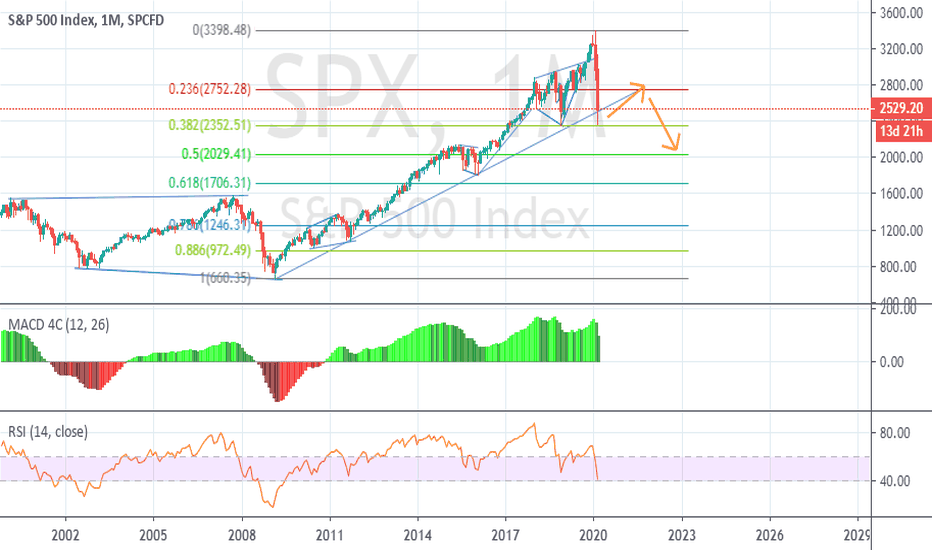
As per the previous update, like Nifty, SPX just completed it's 38.3% retracement and both the indices can move up in sync for a B wave or for an impulse up (if the fall is over).
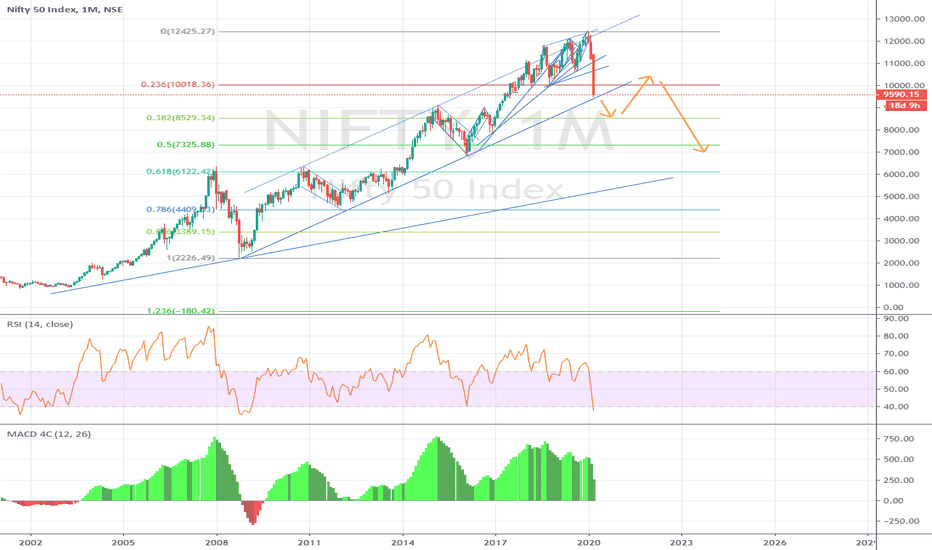
Nifty started falling after breaking the lower trendline in the daily chart. Considering the sharp fall, it seems Nifty should fall at least till the 38% retracement level in the first move down (wave A).
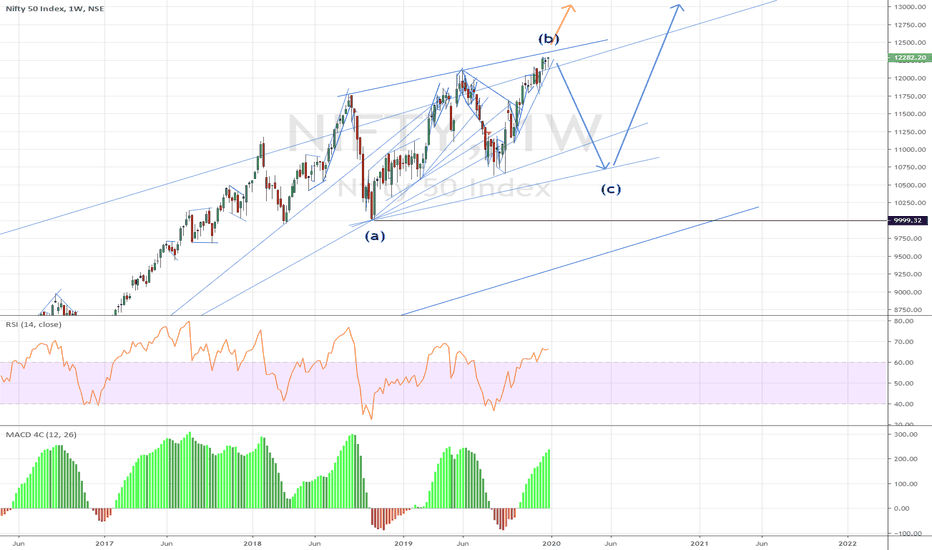
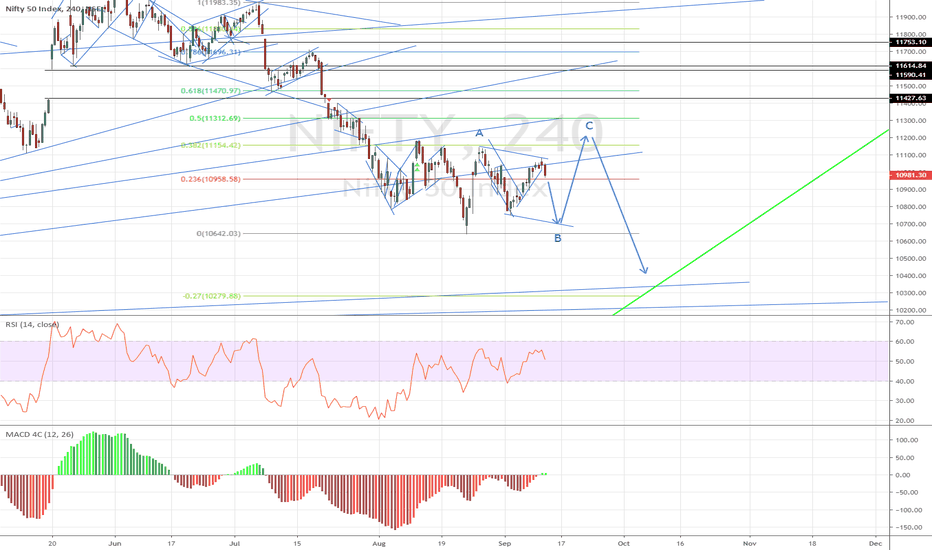
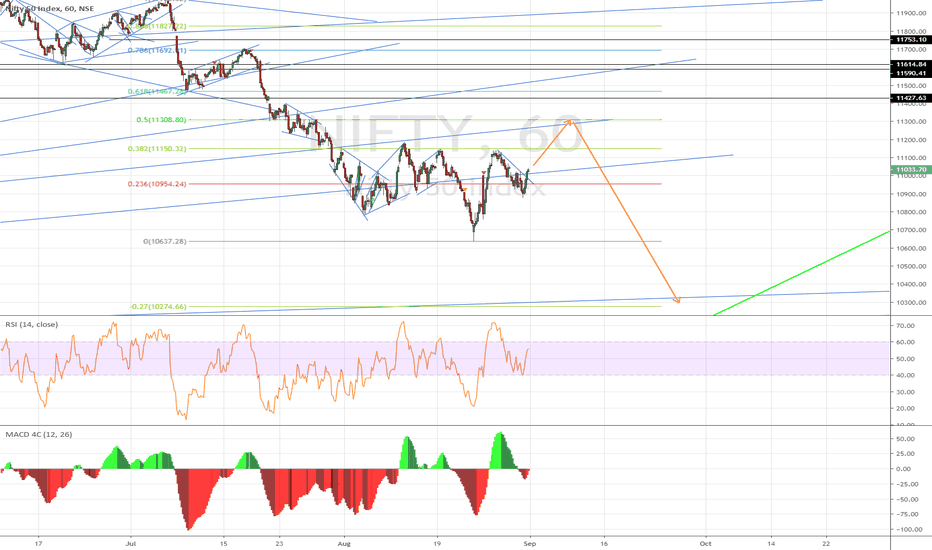
Nifty could be forming a flat pattern. If Nifty breaches the (b) wave lower trendline, then it could follow the path shown by the blue arrows. (A break out from the upper trendline could you create other possibilities, one being as shown by the orange arrow).
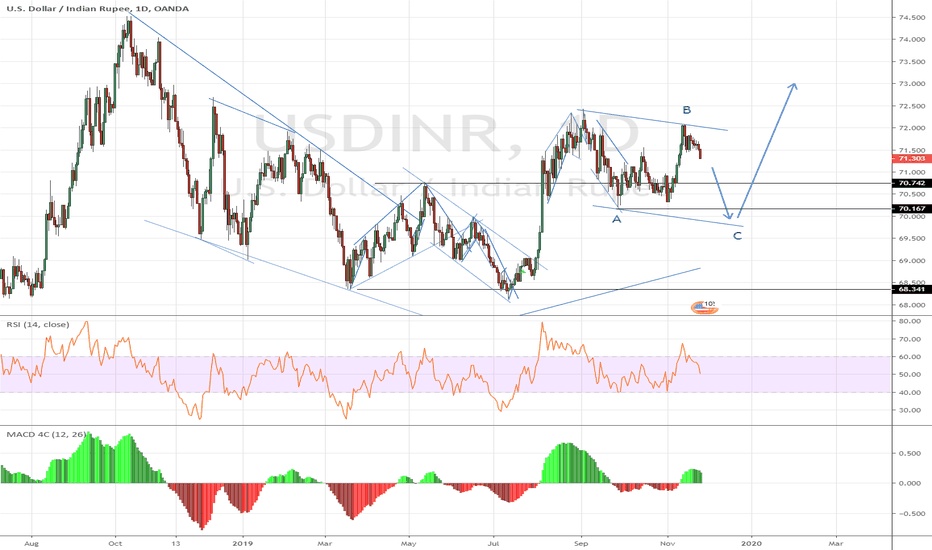
USDINR is looking to complete a flat pattern. The forecast has been shown.
Nifty seems to be in a corrective pattern. So there are many possibilities for its movements. It broke the LTL of the upmove today, so the corrective pattern shown by the arrows might be a possibility..
Nifty has started its up move and could possibly move up to the 50% retracement level before falling.
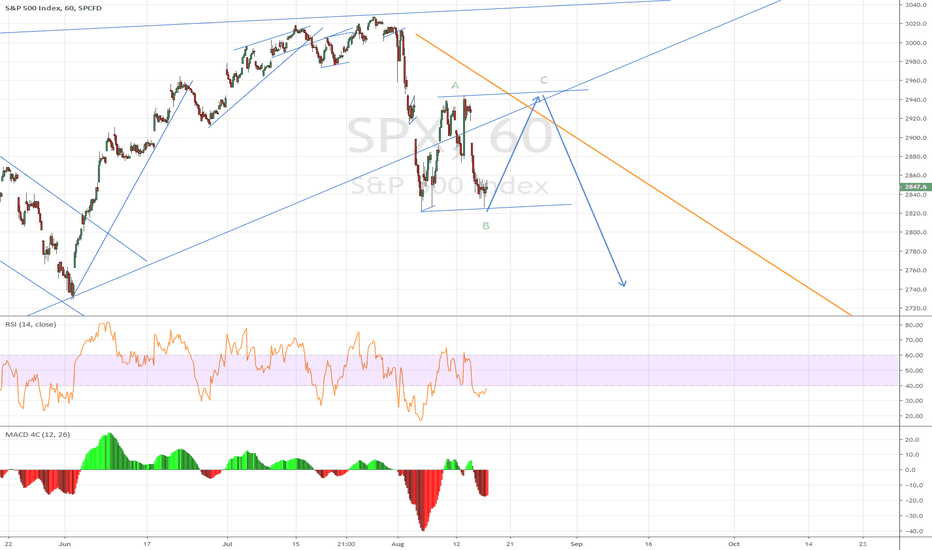
The SPX could be forming a flat or expanded flat pattern (as shown). Hence, it might go up for a few days before continuing its fall. This is just a short-term forecast. The long term forecast remains the same as in the previous update (link attached).
Nifty broke out out of the consolidation and has chosen to follow the orange path as shown in the previous update. This is also in line with the Nifty wave count posted earlier (links attached). The wave (v) down now seems to be subdividing. We have the following wave relations: (ii) > 0.618*(i) and (iii) = 1.618*(i). Thus, 0.38*(iii) <= wave (iv) <= 0.5*(iii)...
As mentioned in the previous update, Nifty's rise would be slow and not worth trading in options. Now, Nifty can either follow the blue path or the orange path. It's hard to say if the correction is over. Any move below the low (of the past few weeks) would be bearish.


