youowemeson
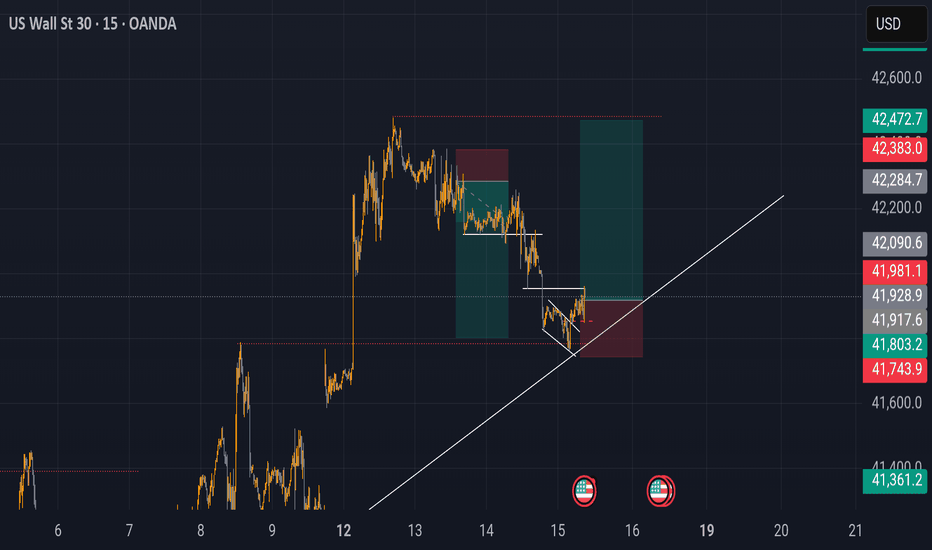
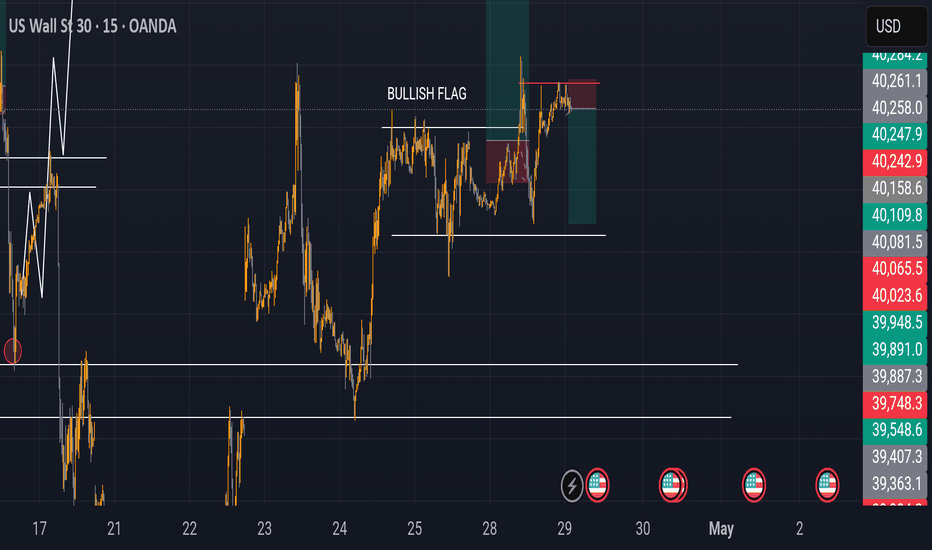
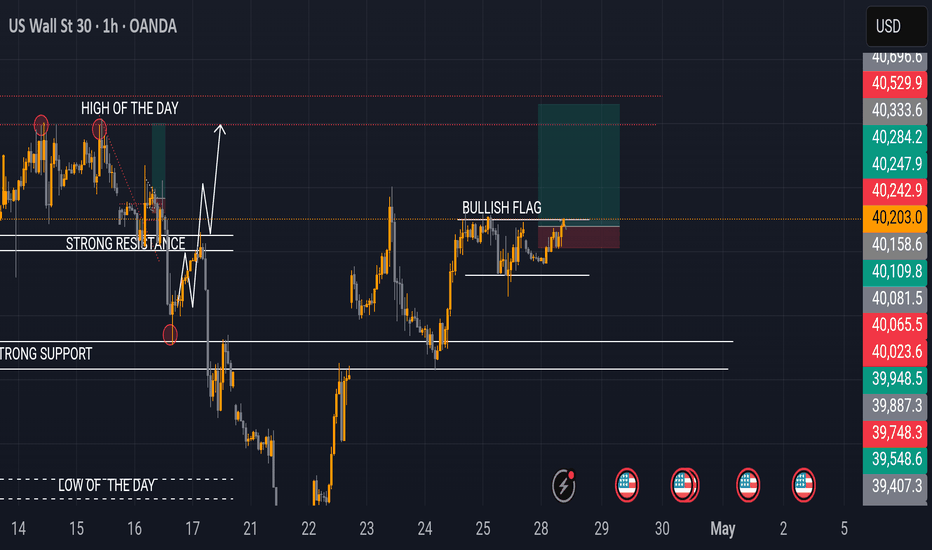
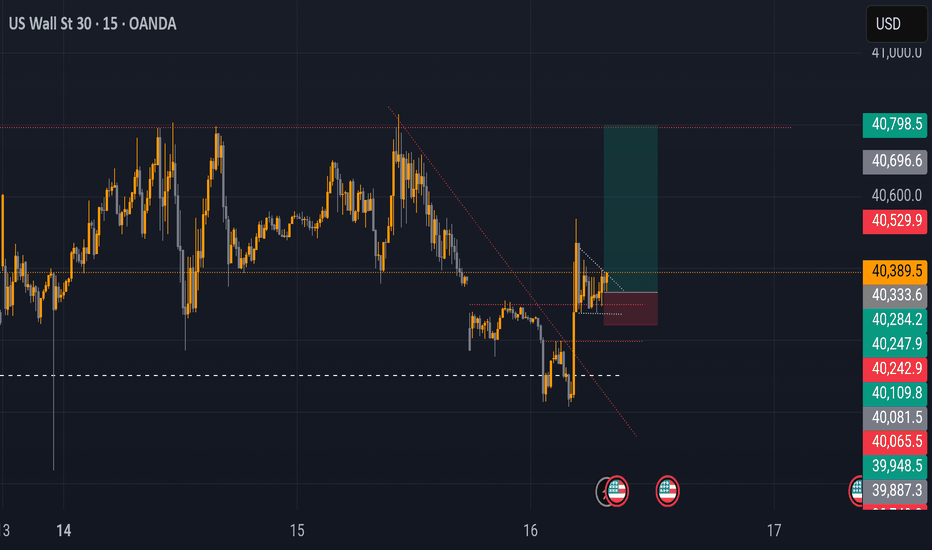
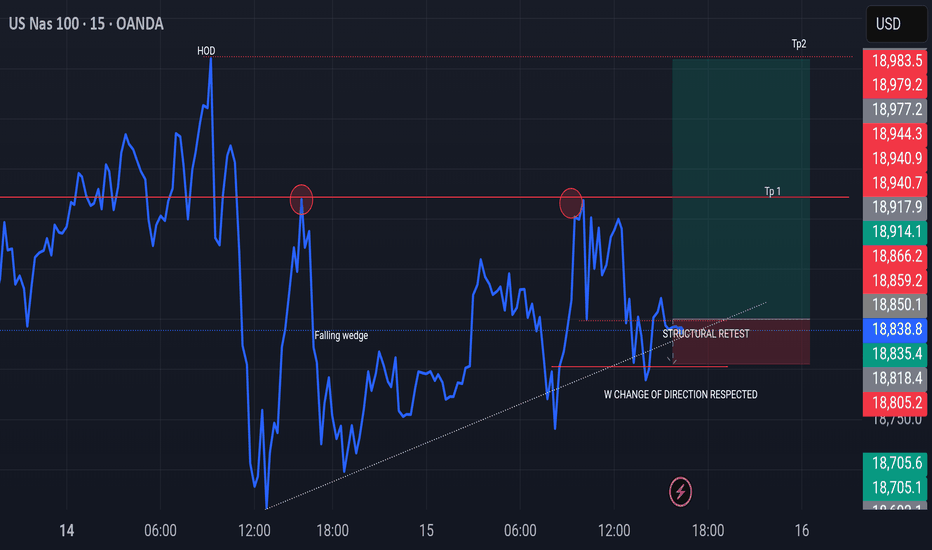
We have a strong bullish move and again we are moving on a bullish flag,price had just retested previous resistance turned into support so now I'm expecting buys till previous HOD
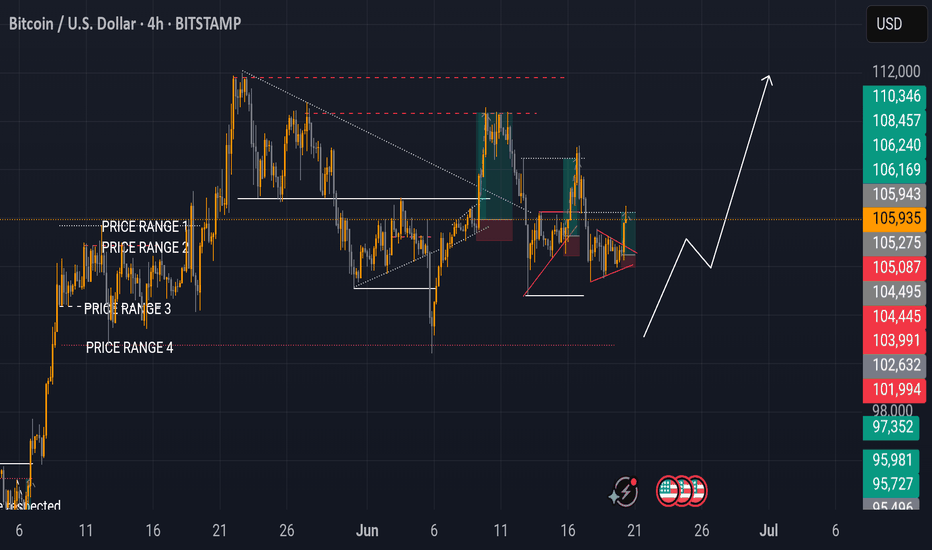
Currently we are on a triangle thats awaiting breakout but with my expectations I'm expecting a strong bull run
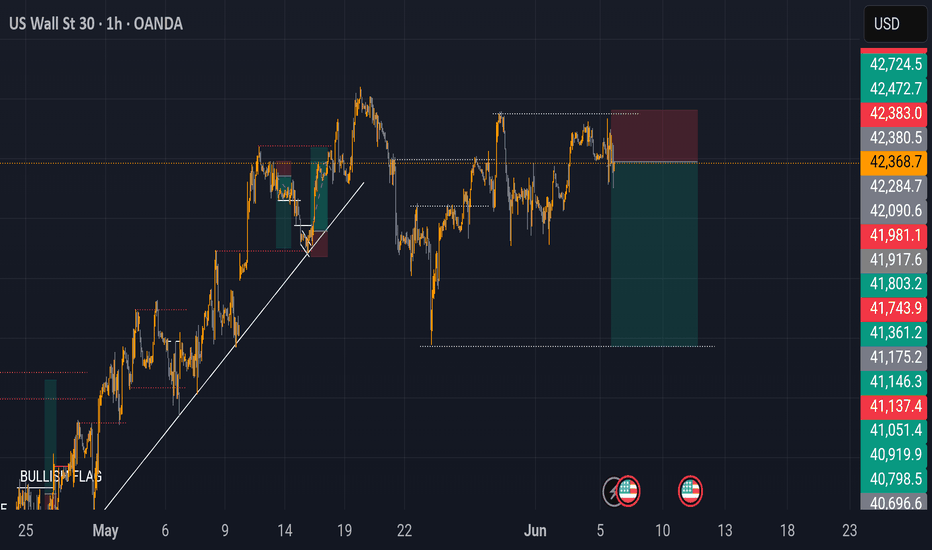
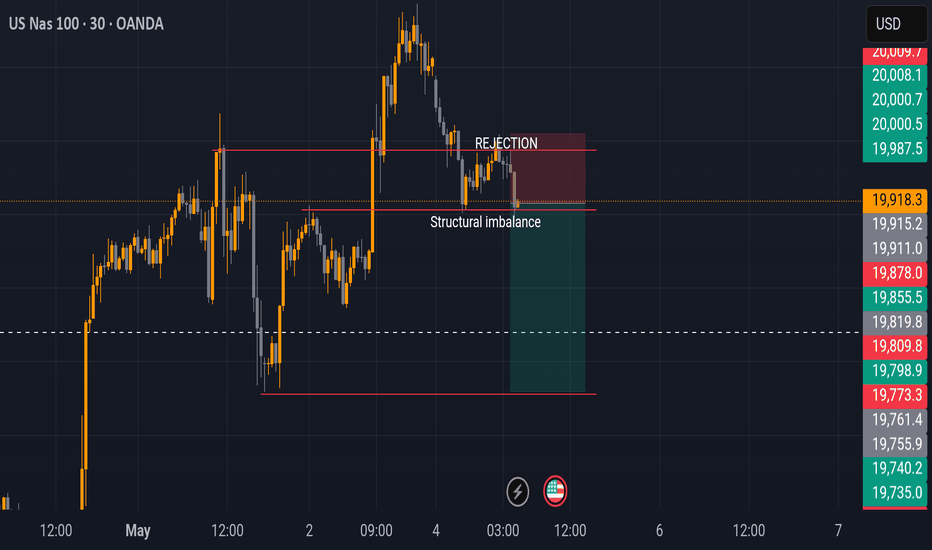
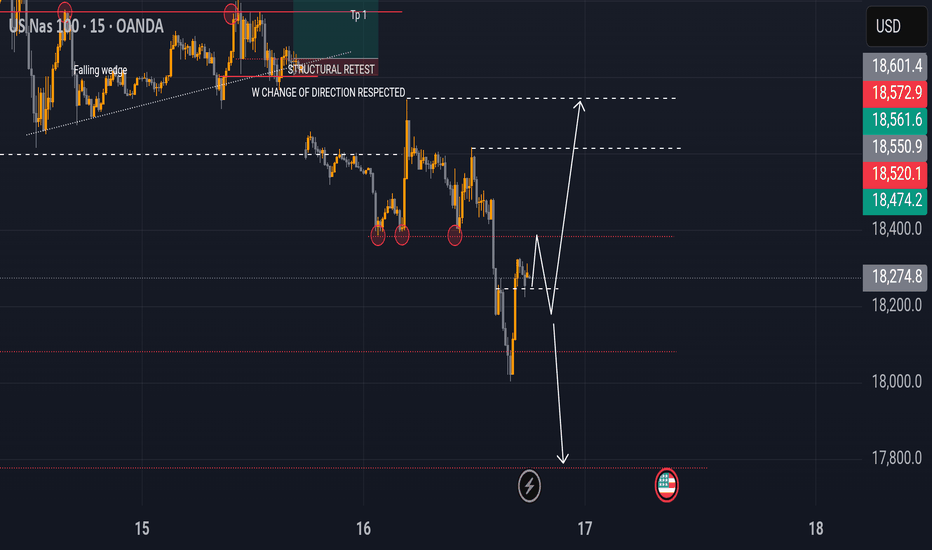
Daily rejection to the downside h4 rejection and h1 rejection this might be a potential huge bearish reversal
Strong resistance on the four hour time frame,previous high needs to be filled and news involved
Huge reversal pattern on the four hour time frame,the move is still reacting but has not yet completed,clear breakout structure is still in place
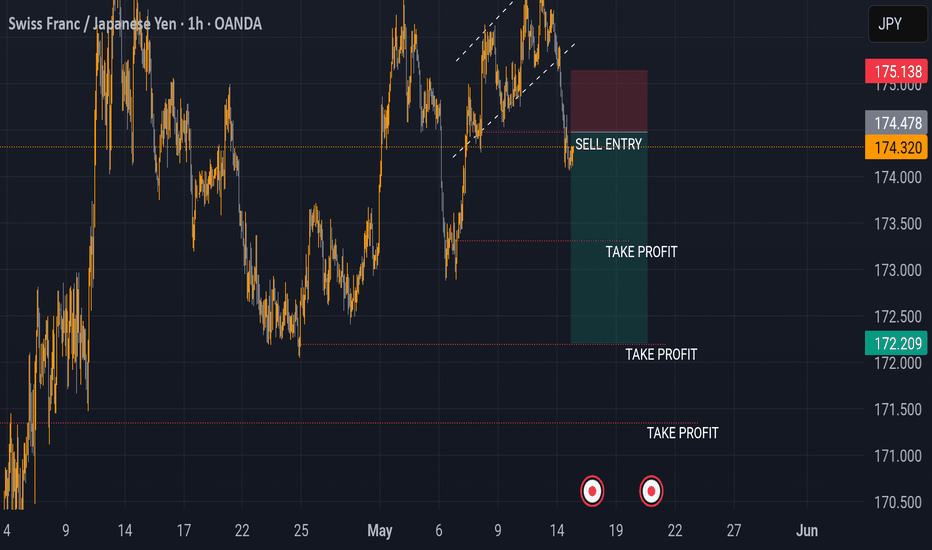
The current structure has an imbalance so a collapse is expected from my side plus we have a bearish flag formed waiting breakout towards the lowest low of the structure
We are facing a bearish triangle awaiting a breakout on H4,h1,m30,15 and m5 when this happens which is likely to be anytime from now on gold market will either a huge correction or reverse back to the downside
Pattern got a strong resistance level and respected it so a push to the downside is expected
Prise was moving on a rising wedge and got a strong support level which turned into resistance
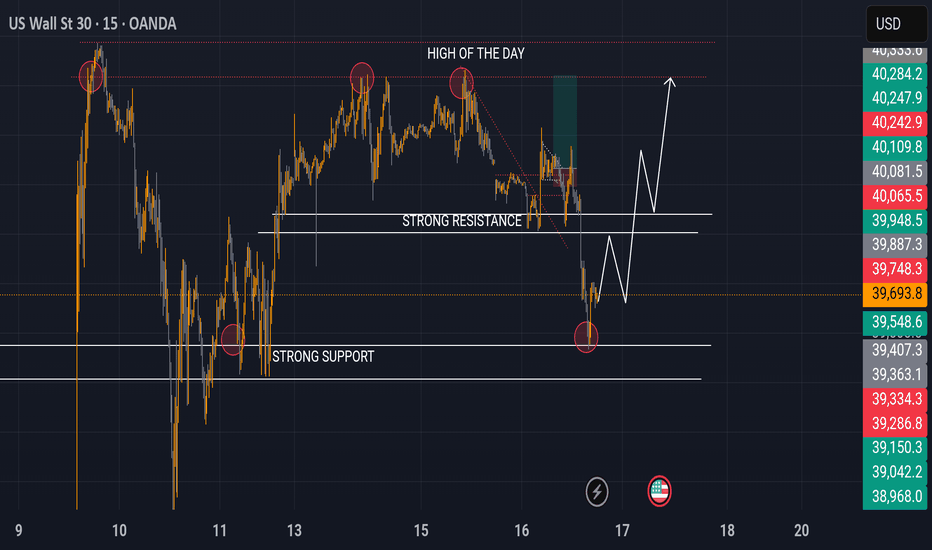
0rice pushed above strong support level and now playing within the strong resistance,it formed a bullish continuation patterns so I'm looking for buys
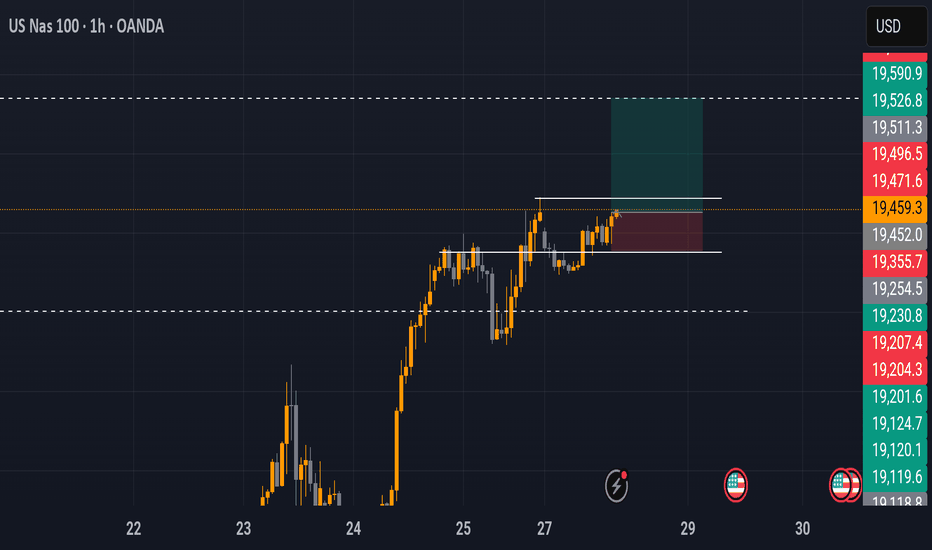
Price is moving on an uptrend looking forward to closing previous highest high
Firstly my apologies for the messy chart,Pattern broker and retested and I had a three move touch on my resistance marked with a rectangle
What I have realized is price is ranging in between HOD and LOD using inside multiple rejection zones to confuse me,so for now I want to see if it will buy till the HOd since I spotted a ranging market
Avoiding all necessary setbacks today,let me just look at it until it gives me what i understand
Yesterday mistakes need to be avoided today no trade setups so far just looking at it
Simple price action all patterns and structure says buy nothing fancy
Simplified price action explained using trend charts ,I just see a bullish continuation pattern forming which is continuously taking out both buyers and sellers out just need to spot a good entry on it
Simple price action explained on the chart just waiting for a possible buy impulse move...


