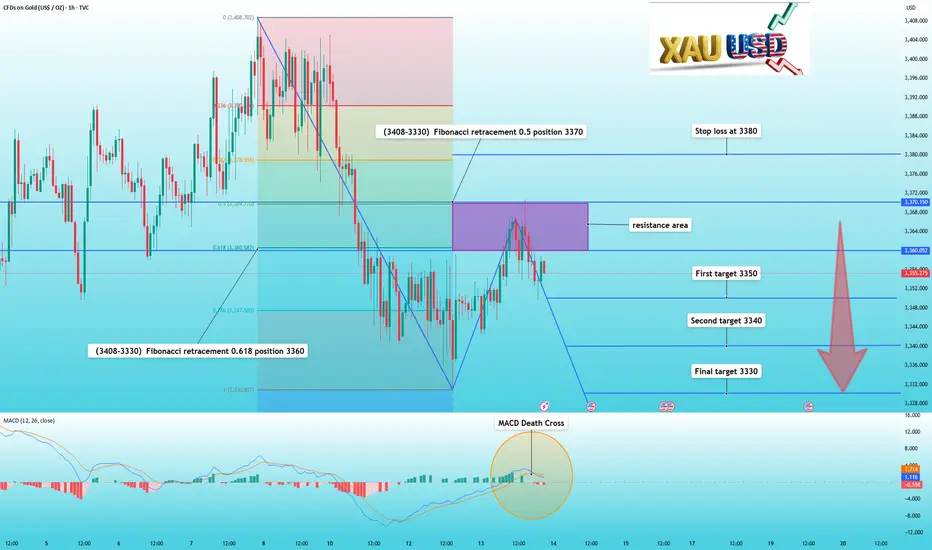
Gold pulls back as expected, you can continue to sellIn my previous trading strategy, I reiterated my view that gold prices would continue to fall if they couldn't break through 3370 in the short term.
And indeed, gold's performance behaved as expected. After hitting 3370, it fell again, reaching a low of 3350.
Technically, the current correction in

The best trades require research, then commitment.
Get started for free$0 forever, no credit card needed

Scott "Kidd" PoteetThe unlikely astronaut

Where the world does markets
Join 100 million traders and investors taking the future into their own hands.
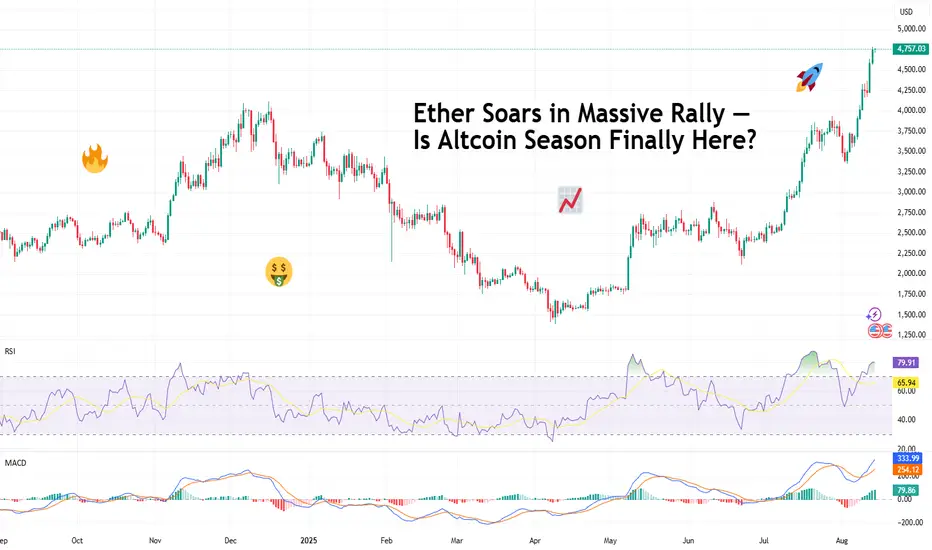
Ether Soars in Massive Rally — Is Altcoin Season Finally Here?Bitcoin who? Move over, orange coin. It's the alt season and Ethereum and its crew of alternatives are here to party.
🚀 Ether Edges Toward All-Time High
Ethereum BITSTAMP:ETHUSD is all the game in crypto town right now. Prices climbed another 3% early Thursday, cruising past $4,750 and now ju
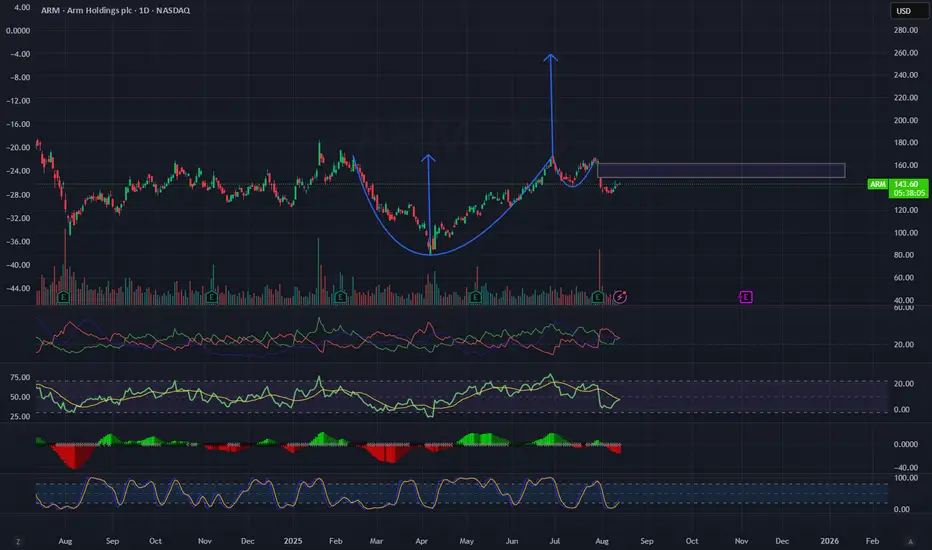
ARM – Cup & Handle Pattern with Potential BreakoutOn ARM’s daily chart, we can see a clear Cup & Handle pattern – twice in a row – with strong upward moves following each completion.
The latest pattern completed around the $165 area, after which the stock pulled back into a healthy correction and is now consolidating in the $140–$150 range.
Techni
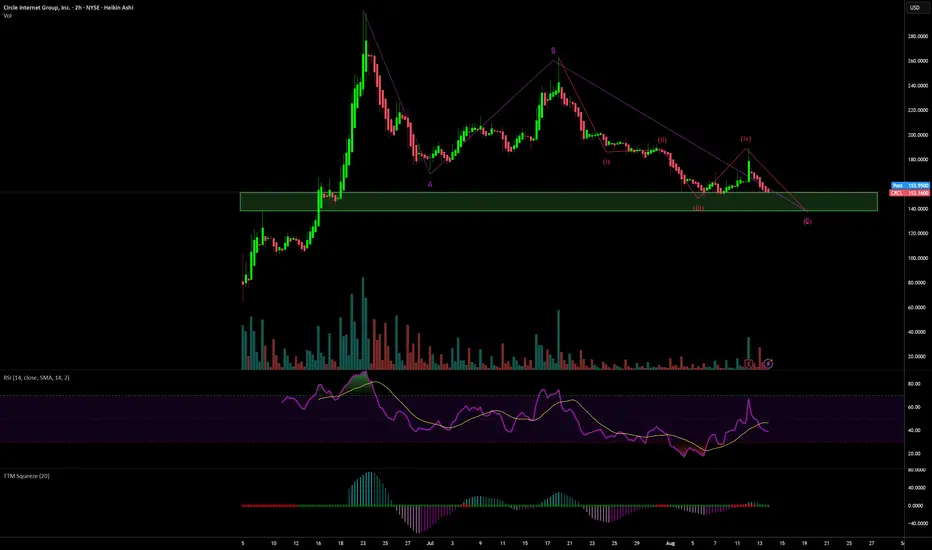
Circle buying opportunity. Bullish chartWith the announcement of the new stock release, more selling should come. I see limit entries of 139 and 144 to be ideal. Overall pattern is 4th wave correction IMO. Target at least double top in short term and much higher long term. People smarter than me would put stop losses under those targ
Cable & Fibre!So, generally I'm happy with the way the market is going. Though a little bit uncertain about how high it wants to go before it resumes its downward spiral, things are going good so far.
Looking at Cable, on an hourly chart, we see that between 06:00 am and 08:00 am (New York Time), there is FVG fo

RBA Cut by 25bp: Where From Here?The Reserve Bank of Australia (RBA) finally delivered the 25bp cut I anticipated in July. I take a quick look at how they have updated the economic forecasts that matter, and how Aussie markets reacted.
Matt Simpson, Market Analyst at City Index and Forex.com

Bitcoin, Ethereum Breakout: 401(k) funds & the next "Altseason"Bitcoin is up 10% in August, driven by strong ETF inflows and a game-changing executive order allowing 401(k) retirement funds to invest in cryptocurrencies, potentially bringing trillions of dollars into the sector.
Technically, Bitcoin and Ethereum are breaking out toward multi-year highs, with B

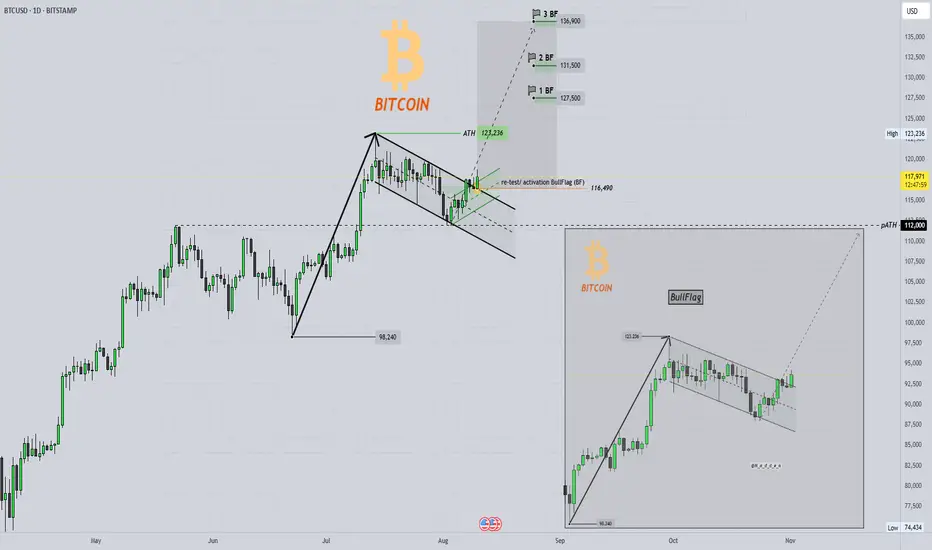
BITCOIN Bullflag and new all-time high ?!BULL FLAG and new all-time high 👀⏰
📇BTC daily-chart (BITSTAMP) and 💡everything important in the chart !
Bitcoin has broken out of its sideways consolidation and has recently successfully tested this channel (bull flag), thereby activating a potential bull flag.
The resulting targets (see example
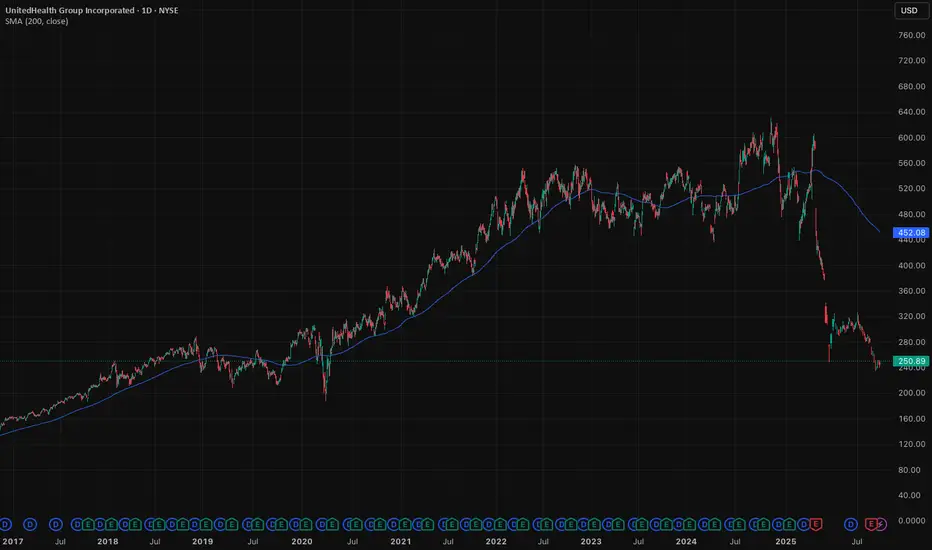
UnitedHealth: Deeply oversold but worth a closer lookUnitedHealth (UNH) is the largest private healthcare company in America. Eight million Medicare Advantage members. Optum’s network reaches tens of millions more. It has the data, the reach, and the pricing power. At today’s valuation, it’s worth adding to your watchlist. Forward P/E at 11× versus a
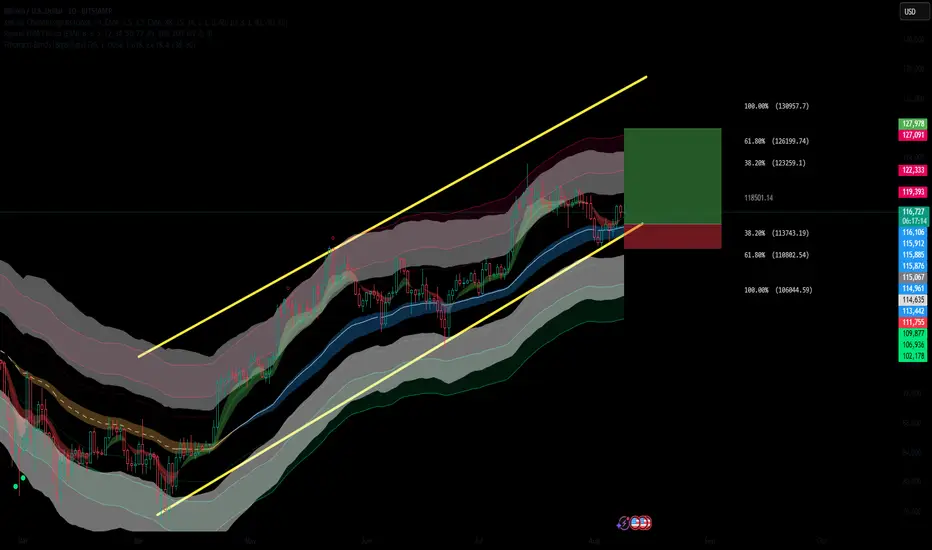
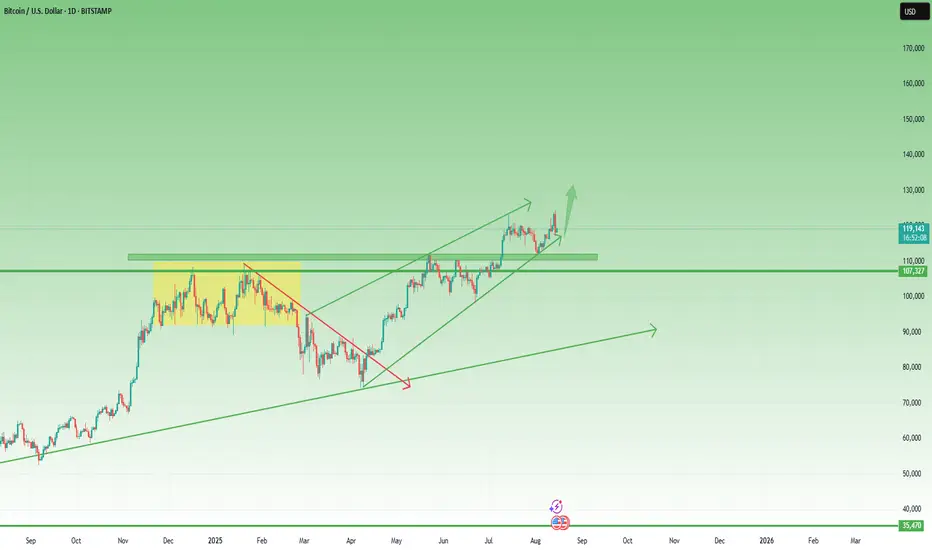
BTC Holding Strong: Fibonacci Levels Point to $130KBITSTAMP:BTCUSD is holding above a key dynamic support zone at the lower boundary of its ascending channel, with current price action signaling a potential continuation to the upside. This long setup is supported by multiple bullish confluences.
✅ Bullish Confluences:
Fibonacci Retracement Suppor
See all editors' picks ideas
Time & Sales (Tape) - TableWhat it is
A compact Time & Sales (tape) visualizer rendered as a table on your chart. It reconstructs prints from a lower timeframe (e.g., 1-second) or, optionally, streams them in Live Tick mode. Each row shows Date, Time, Side (▲ up / ▼ down), Last, and Volume (or Price Volume), with a dynamic

Angle Market Structure [BigBeluga]🔵 OVERVIEW
Angle Market Structure is a smart pivot-based tool that dynamically adapts to price action by accelerating breakout and breakdown detection. It draws market structure levels based on pivot highs/lows and gradually adjusts those levels closer to price using an angle threshold. Upon bre

Dynamic Swing Anchored VWAP (Zeiierman)█ Overview
Dynamic Swing Anchored VWAP (Zeiierman) is a price–volume tool that anchors VWAP at fresh swing highs/lows and then adapts its responsiveness as conditions change. Instead of one static VWAP that drifts away over time, this indicator re-anchors at meaningful structure points (swings).

Trading Holidays and Expiry CalendarTrading Holiday and Expiry Calendar
This indicator displays calendar for current and next 2 months. Calendar marks ‘CRITICAL DAYS’ on the calendar.
‘CRITICAL DAYS’:
Trading Days
Trading Holidays
Weekends
Expiry Days
Out of these ‘Expiry Days’ are marked based on User input and rest of

Drawdown Distribution Analysis (DDA) ACADEMIC FOUNDATION AND RESEARCH BACKGROUND
The Drawdown Distribution Analysis indicator implements quantitative risk management principles, drawing upon decades of academic research in portfolio theory, behavioral finance, and statistical risk modeling. This tool provides risk assessment capabilit

FunctionADFLibrary "FunctionADF"
Augmented Dickey-Fuller test (ADF), The ADF test is a statistical method used to assess whether a time series is stationary – meaning its statistical properties (like mean and variance) do not change over time. A time series with a unit root is considered non-stationary and

Adaptive Market Profile – Auto Detect & Dynamic Activity ZonesAdaptive Market Profile is an advanced indicator that automatically detects and displays the most relevant trend channel and market profile for any asset and timeframe. Unlike standard regression channel tools, this script uses a fully adaptive approach to identify the optimal period, providing you

Trading Report Generator from CSVMany people use the Trading Panel. Unfortunately, it doesn't have a Performance Report. However, TradingView has strategies, and they have a Performance Report :-D
What if we combine the first and second? It's easy!
This script is a special strategy that parses transactions in csv format from Paper

Smart Money Breakout Channels [AlgoAlpha]🟠 OVERVIEW
This script draws breakout detection zones called “Smart Money Breakout Channels” based on volatility-normalized price movement and visualizes them as dynamic boxes with volume overlays. It identifies temporary accumulation or distribution ranges using a custom normalized volatility me

Trend Range Detector (Zeiierman)█ Overview
Trend Range Detector (Zeiierman) is a market structure tool that identifies and tracks periods of price compression by forming adaptive range boxes based on volatility and price movement. When prices remain stable within a defined band, the script dynamically draws a range box; when p

See all indicators and strategies
Community trends
Micron Technology - The bullrun is not over!⛓️💥Micron Technology ( NASDAQ:MU ) will break out soon:
🔎Analysis summary:
Over the past couple of years, Micron Technology has perfectly been respecting the rising channel pattern. With the current retest of the previous all time high, a breakout becomes more and more likely. Therefore the

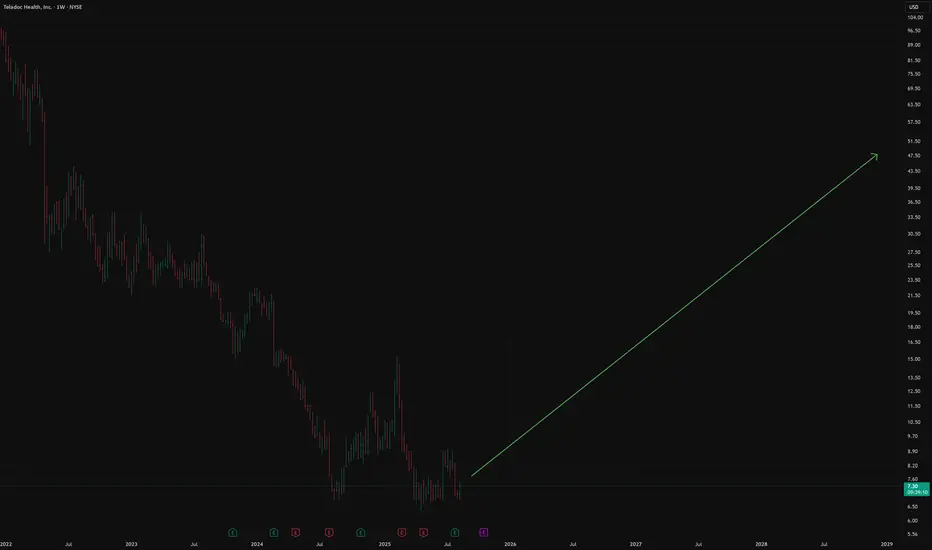
Teladoc Mid-Long term ideaTeladoc Health is a company specializing in telemedicine and virtual healthcare.
The company gained wide popularity during the covid-19 pandemic.
The company has historically expanded its operations through M&A:
In 2013 and 2014, the acquisition of Consult A Doctor, AmeriDoc allowed Teladoc to becom
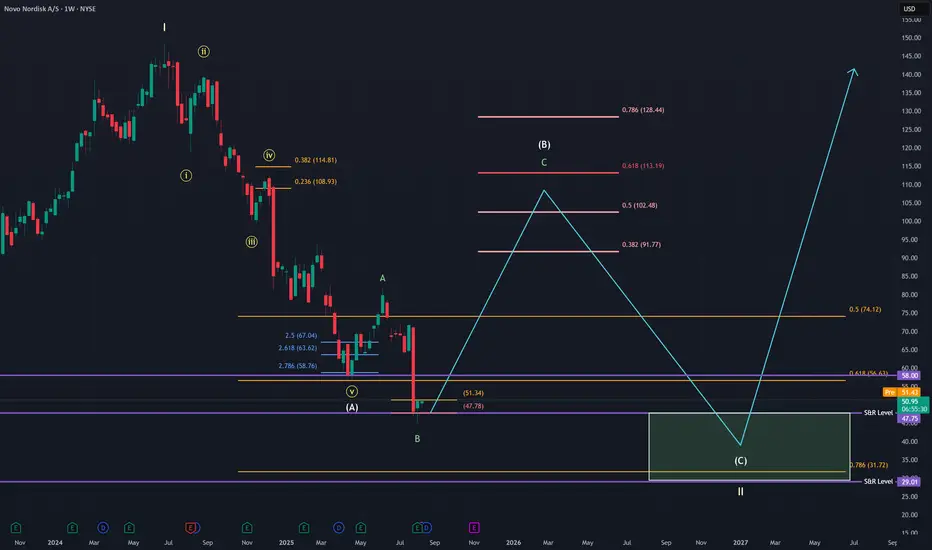
$NVO Elliott Wave Count – Eyeing $113 Before Big C-Wave DropPrimary Elliott Wave Scenario – NYSE:NVO
I believe NYSE:NVO completed a multi-year Wave I in May 2024. Since then, we’ve seen the A-wave of a larger ABC correction play out.
The price dipped below the 0.618 Fib at $56.63, but reclaimed key support at $47.75. My current primary count suggests th
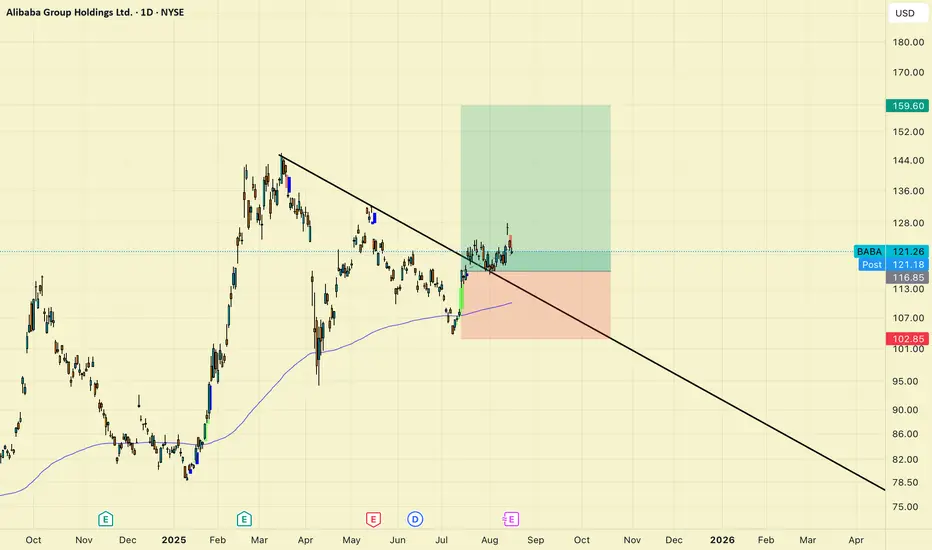
Looks bullish to me…If they crush earnings we could have a pretty nice sized break out. Im long for earnings. Boom or Bust…
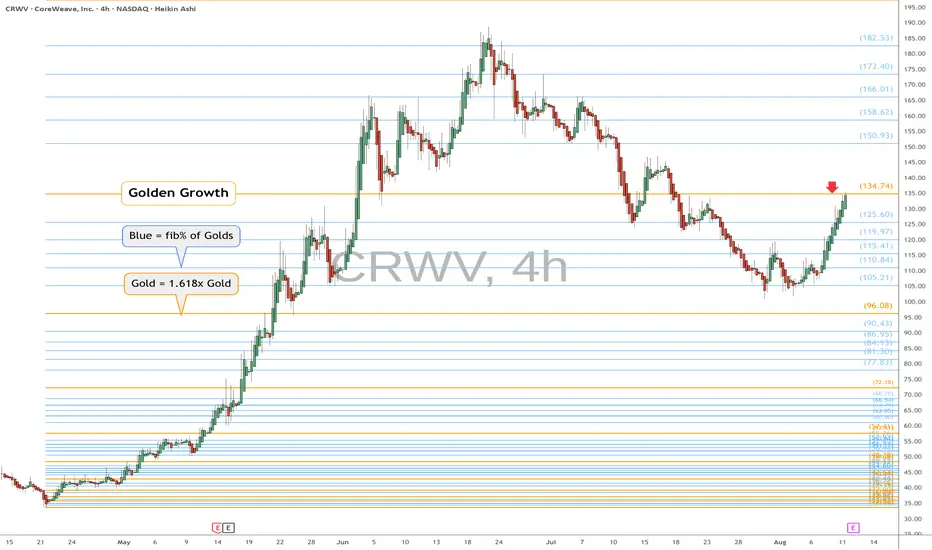
CRWV heads up at $134.74: Golden Genesis fib to determine trend CRWV trying for a trend change back to rocket mode.
Currently testing a Golden Genesis fib at $134.74
Looking for a clean Break-n-Retest for possible longs.
.
Previous Plot that caught the HUGE BREAKOUT:
Hit BOOST and FOLLOW for more such PRECISE and TIMELY charts.
=============================
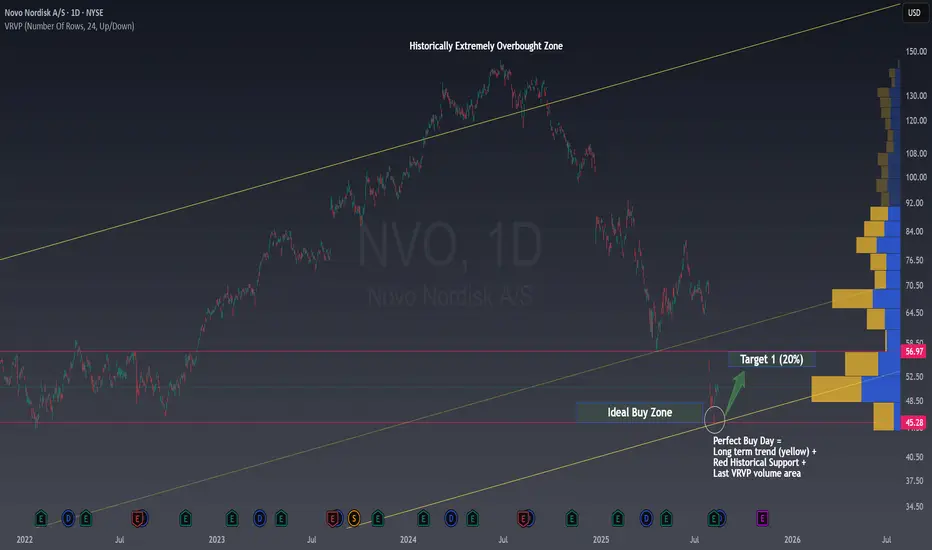
Once in a Lifetime Opportunity and the Psychology behind itOnce in a Lifetime Opportunity and the Psychology behind it
There are moments in the market that happen so rarely , they feel almost mythical when they finally arrive. Novo Nordisk NYSE:NVO has just given us one of those moments.
If you’ve been following my work, you might remember my previo
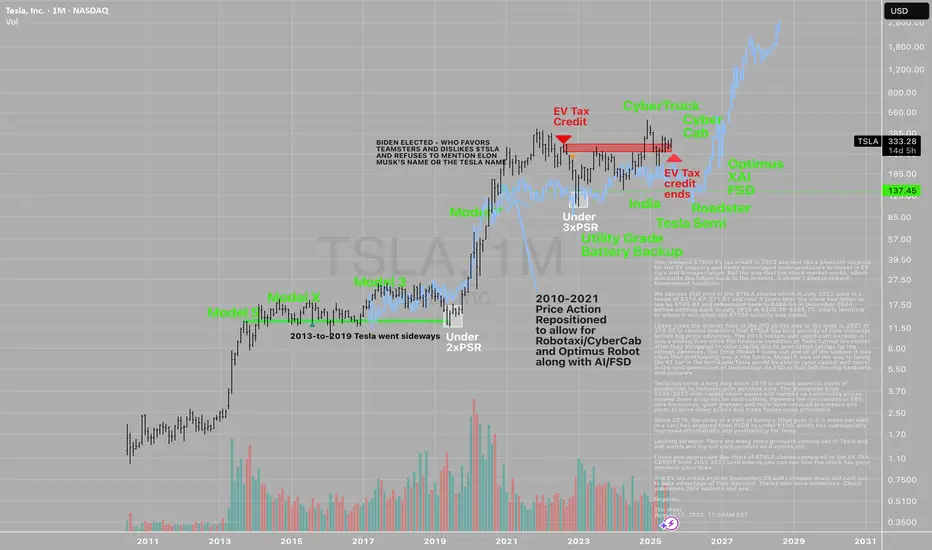
EV Tax Credit Did Nothing For $TSLA StockThe renewed $7500 EV tax credit in 2022 seemed like a pleasant surprise for the EV industry and likely encouraged some producers to invest in EV cars and transportation. But the way that the stock market works, which discounts the future back to the present, it doesn't always reward Government hando
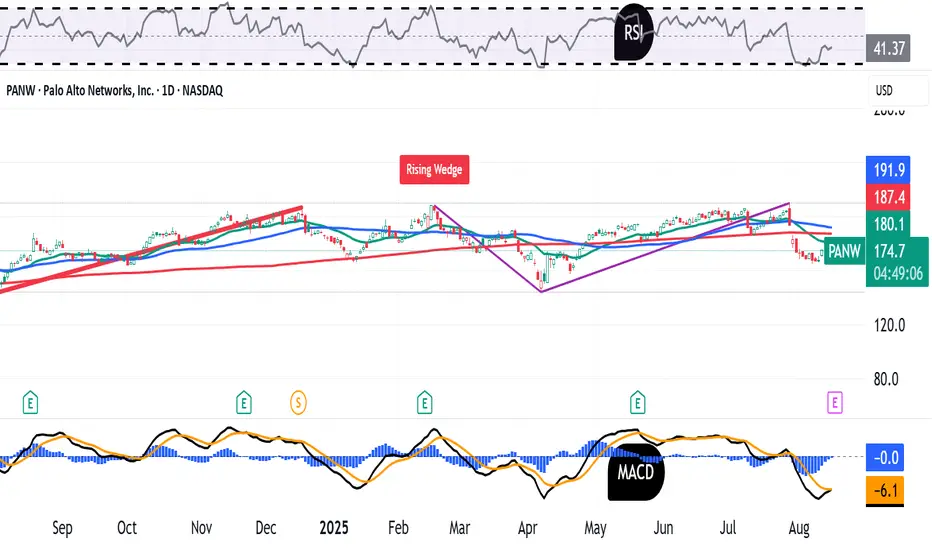
Palo Alto Networks Has Stumbled YTD. What Does Its Chart Say?Cybersecurity firm Palo Alto Networks NASDAQ:PANW will report fiscal Q4 results next week at a time when the stock is up 300%+ over five years, but down some 4% year to date. What does PANW's fundamental and technical analysis say?
Let's take a look:
Palo Alto Networks' Fundamental Analysis
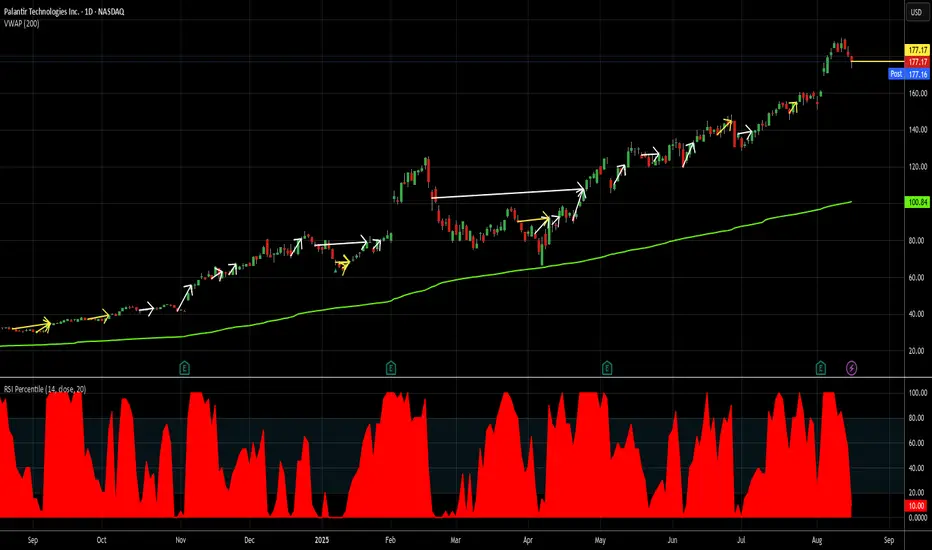
Again and again and again and again...long at 177.17If you want my case for trading PLTR and the chart for the last year isn't enough, consult my last PLTR idea here -
Since then, nothing has changed, in my mind, except there's been a few more profitable trades added to my account thanks to PLTR.
+5.73% in 2 days
+10.06% in 4 days
+9.32% in 3
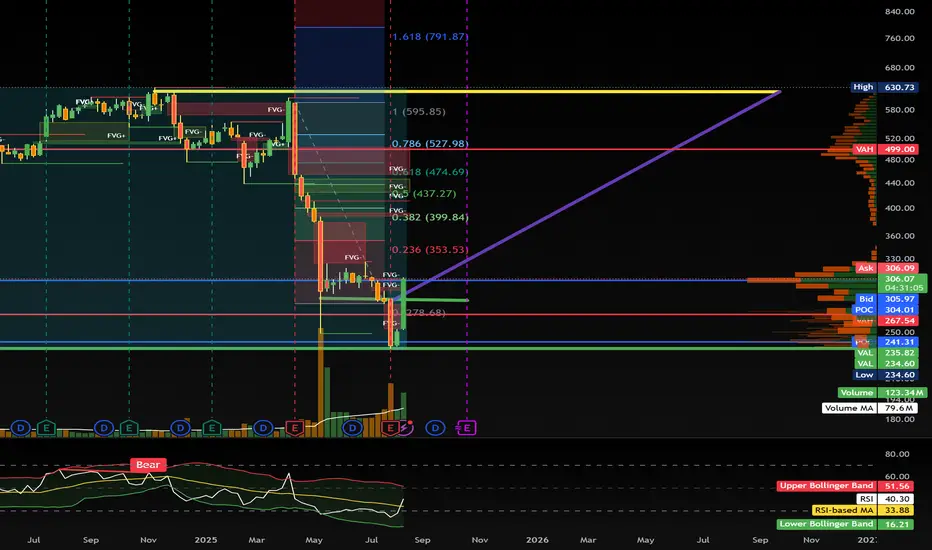
UNH clean breakoutUNH can crawl back to its trading price above $600 within the next 12 months.
After today's load up based on Buffett's news, FOMO will kick in by September for the rally to stabilize. When levels dictate the outcome, the target is obviously correct.
Next stop is $360, then stabilize, followed by
See all stocks ideas
Aug 18
BTDRBitdeer Technologies Group
Actual
—
Estimate
−0.12
USD
Aug 18
NMMNavios Maritime Partners LP
Actual
—
Estimate
1.74
USD
Aug 18
AGROAdecoagro S.A.
Actual
—
Estimate
0.26
USD
Aug 18
SPIRSpire Global, Inc.
Actual
—
Estimate
−0.51
USD
Aug 18
CAAPCorporacion America Airports SA
Actual
—
Estimate
0.43
USD
Aug 18
PACSPACS Group, Inc.
Actual
—
Estimate
0.39
USD
Aug 18
FLFoot Locker, Inc.
Actual
—
Estimate
0.07
USD
Aug 18
DSSDSS, Inc.
Actual
—
Estimate
—
See more events
Community trends
Bitcoin - Huge drop will continue! Then a new ATH (buy here)Bitcoin and mainly altcoins have been pumping in the recent weeks, so the important question is - will this trend continue, or is it over? My Elliott Wave analysis on Bitcoin suggests that we should see a correction to 105,000 USDT before another push to the upside. Why? I see a completed Impulse wa
The season of Ethereum has arrived!
Do you know that Ethereum is currently the strongest coin in the market?
Even its targets and chart look stronger than Bitcoin’s.
Exactly 4 months ago, I posted an Ethereum analysis saying it had reached its lowest bottom, and at that time its price was exactly $2,180.
Take a look at the chart bel

Bitcoin – Momentum Turns Bearish After Topside SweepBitcoin has just completed a clean sweep of the old all-time high, which served as a major liquidity grab. This move has cleared out buy-side liquidity at the very top, creating the perfect environment for a shift in momentum. Price action shows a clear rejection after the sweep, suggesting that the

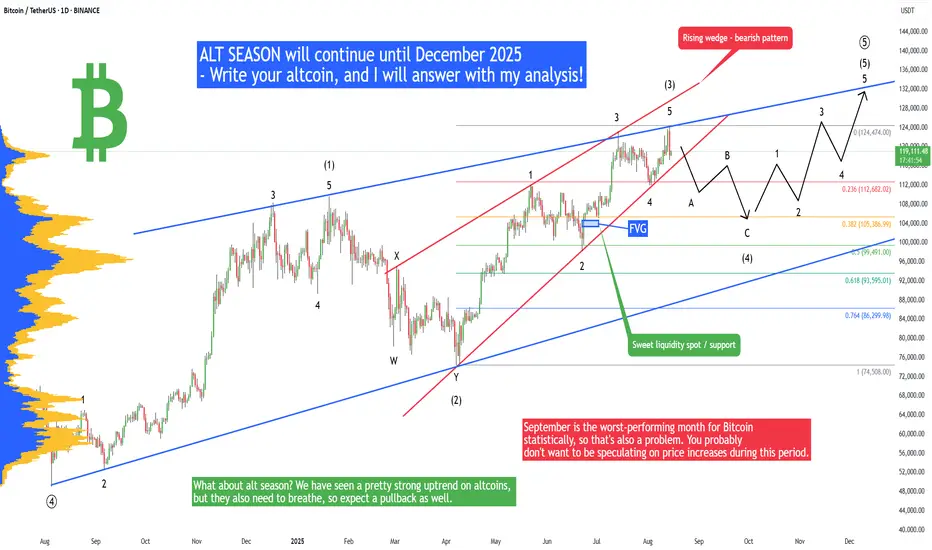
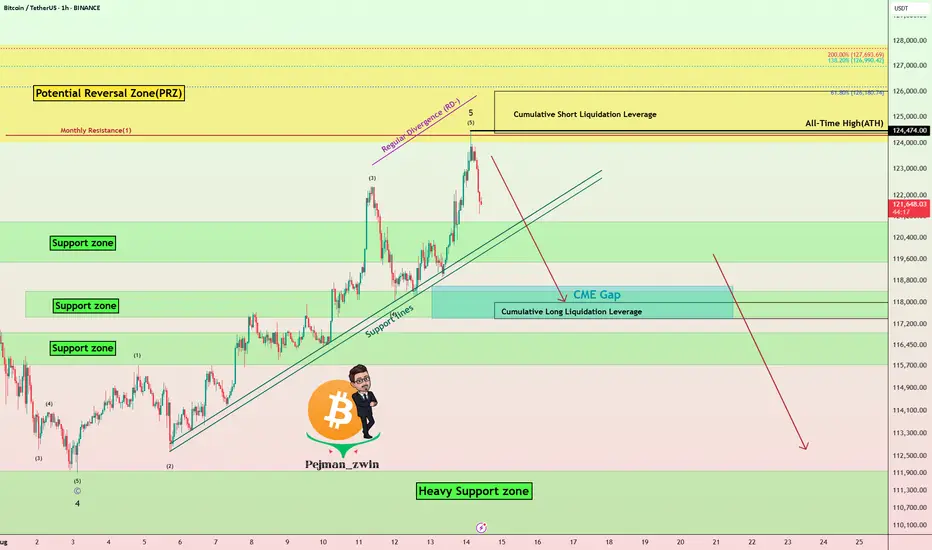
Bitcoin Hits New ATH – Is This the Final Pump Before a Crash?Bitcoin ( BINANCE:BTCUSDT ) reacted well to the Potential Reversal Zone(PRZ) that I told you about in the previous idea and started to decline, but Bitcoin managed to create a new All-Time High(ATH=$124,474) in this rally.
Do you think Bitcoin can create a new All-Time High(ATH) again in the
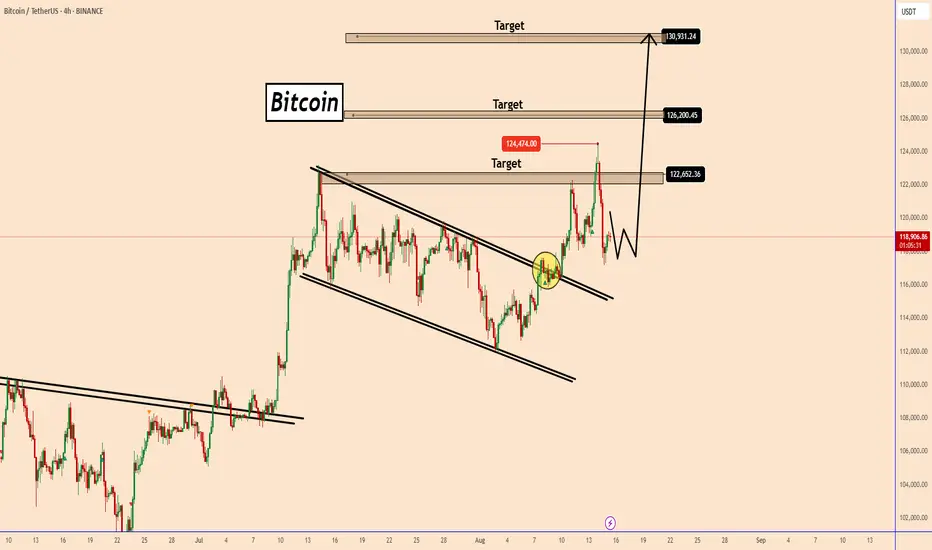
BTC: Uptrend remains strong despite a slight sell-offBTC: Uptrend remains strong despite a slight sell-off
From our previous analysis, BTC rose beyond our first target and turned back down.
Once again BTC proved to be the market favorite, reaching a new all-time high near 124500.
So far we can see a sell-off that could be a profit from the unkno
Dogecoin - The all time high will follow!🎁Dogecoin ( CRYPTO:DOGEUSD ) prepares new all time highs:
🔎Analysis summary:
Dogecoin has been creating bullish cycles for the past decade. Following these cycles, it is quite likely that Dogecoin will break the previous all time high soon. And with the recent bullish break and retest, bulls

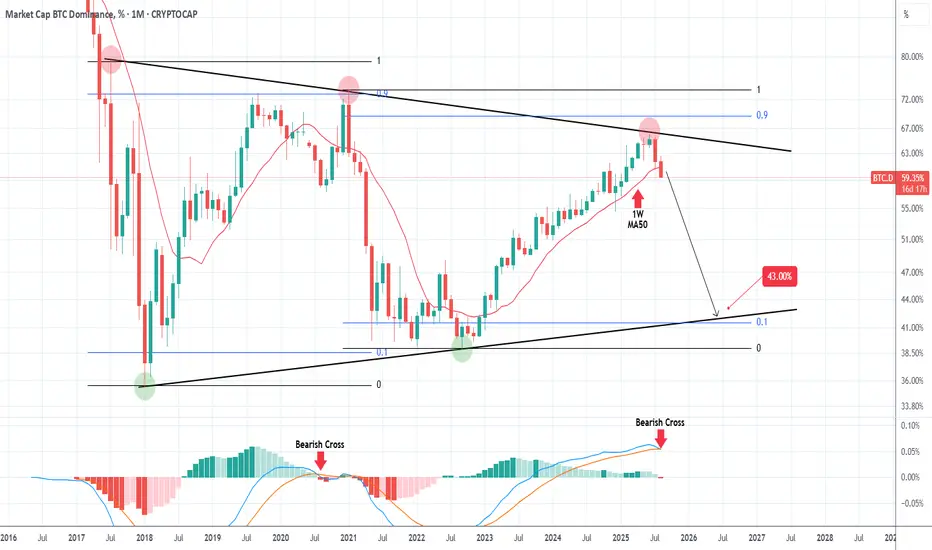
ALTSEASON has already started!The BTC Market Cap Dominance (BTC.D) has made an emphatic rejection at the top (Lower Highs trend-line) of the 8-year Triangle and if it closes the 1M candle of August below the 1W MA50 (red trend-line), it will largely confirm the new Bearish Leg.
With the 1M LMACD about to complete its first Bear
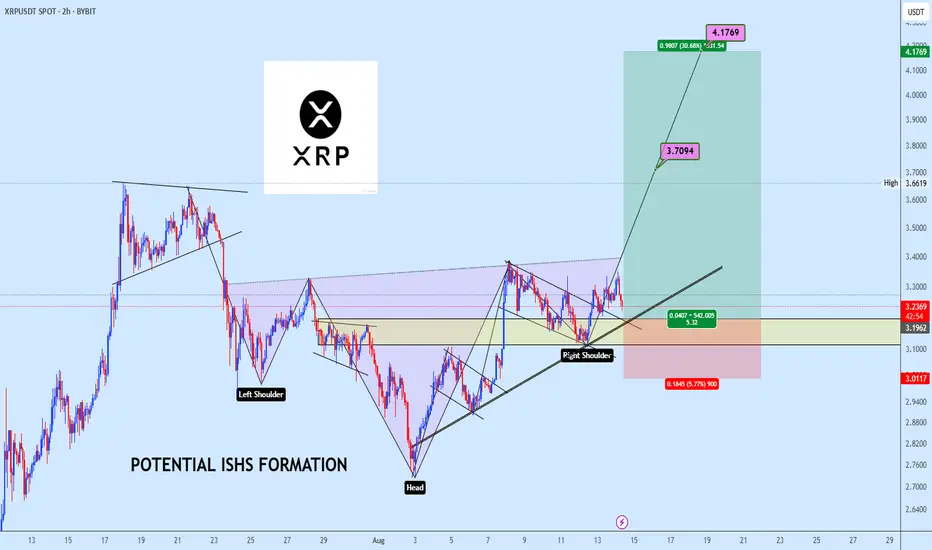
XRPUSDT Targets $4.17 After Neckline BreakXRPUSDT is forming a potential inverse head and shoulders structure, with price currently building the right shoulder above the key demand zone. A confirmed breakout above the neckline would validate the bullish reversal pattern, targeting the projected levels at $3.7094 and $4.1769. The plan is to
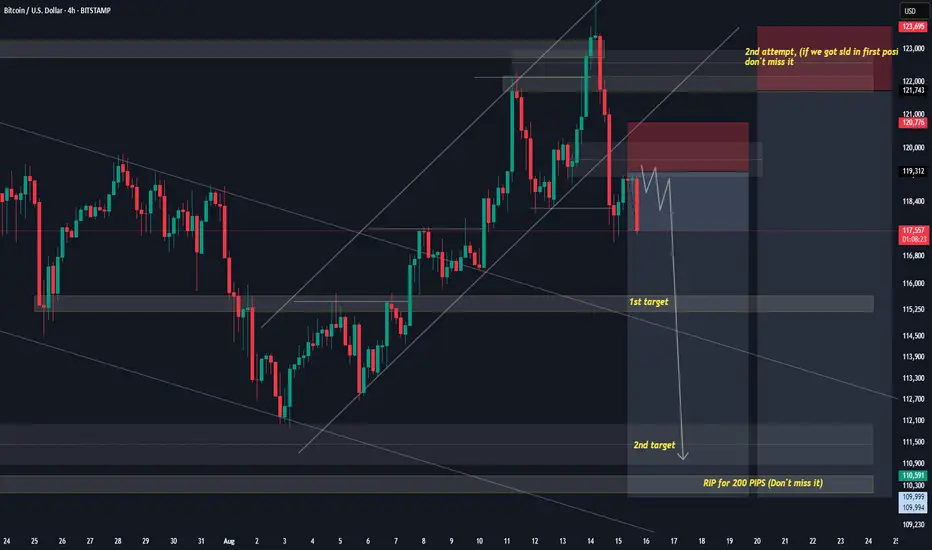
BTCUSD NEXT MOVE (Expecting bearish move)(15-08-2025) Go through the analysis carefully, and do trade accordingly.
Anup 'BIAS for BTCUSD (15-08-2025) (MIDTERM)
Current price- 118000
"if Price stay below 121000 then next target is 115000, 111000 and 108000 above that 129000
-POSSIBILITY-1
Wait (as geopolitical situation are worsening )
-POSSIBILITY
This BTC Pullback Doesn’t Break the Bullish StructureYesterday, BTC dropped around 5% from its freshly printed intraday ATH, reaching a low of 117,300. Should bulls be worried?
In my view, this drop can’t be seen as more than just a correction — while it was indeed quite deep, the overall structure remains fully intact.
Price is still comfortably ab
See all crypto ideas
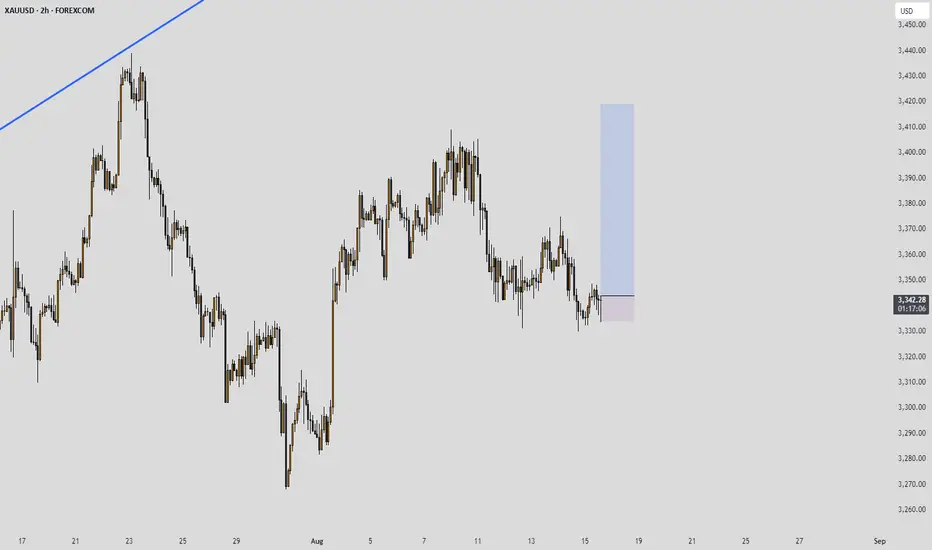
Lingrid | GOLD Key Support Zone In Range-Bound MarketOANDA:XAUUSD is approaching the confluence of the downward trendline and the 3,315 support, forming a potential bullish reversal setup. The structure suggests a base-building phase after the recent correction, aligning with the 61.8% golden zone of the prior swing. A decisive push above 3,340 would

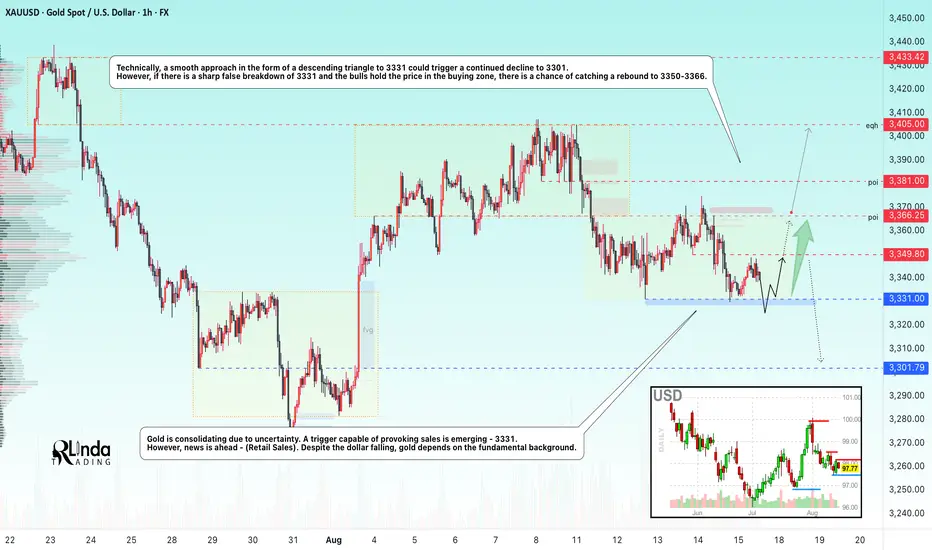
GOLD → Gold is consolidating. What will C.Retail Sales show?FX:XAUUSD is consolidating due to uncertainty caused by economic data from the US, interest rate decisions, and negotiations between the presidents of Russia and the US.
Gold has not had an easy time lately, with the price in a rather difficult zone both technically and fundamentally. Low-pot
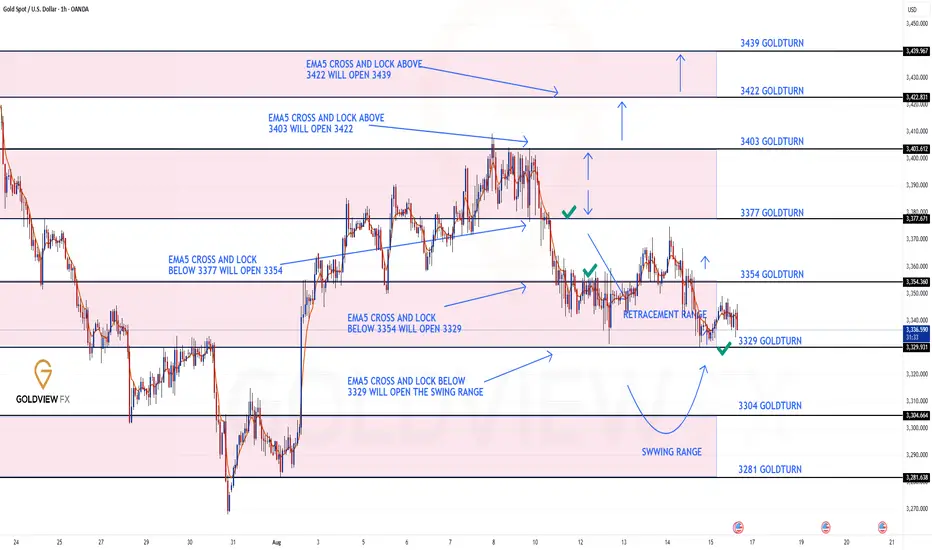
GOLD ROUTE MAP UPDATEHey Everyone,
Great finish to the week with our chart idea playing out as analyzed. In yesterday’s update, we stated that the 3329 full gap remained open and that we had another cross-and-lock confirming this.
That gap has now been completed perfectly and also gave the reaction and bounce in line
XAUUSD - market structure by SERAXAUUSD - market structure by SERA, use trade and risk managment for best result!
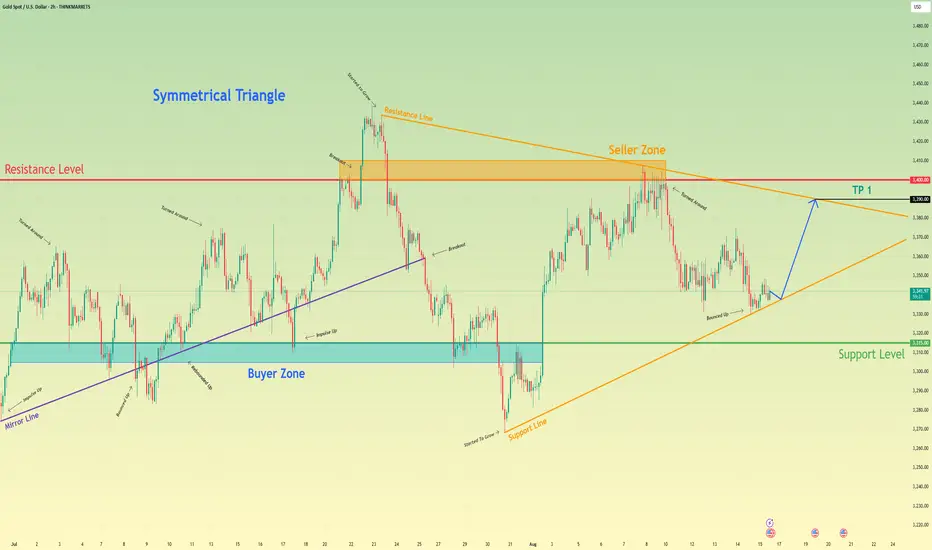
Gold can make correction and then rebound up of support lineHello traders, I want share with you my opinion about Gold. The Gold market has transitioned from a clear directional trend into a phase of price discovery and consolidation, following a significant breakdown of a prior ascending mirror line. This shift in market dynamics has led to the formation of
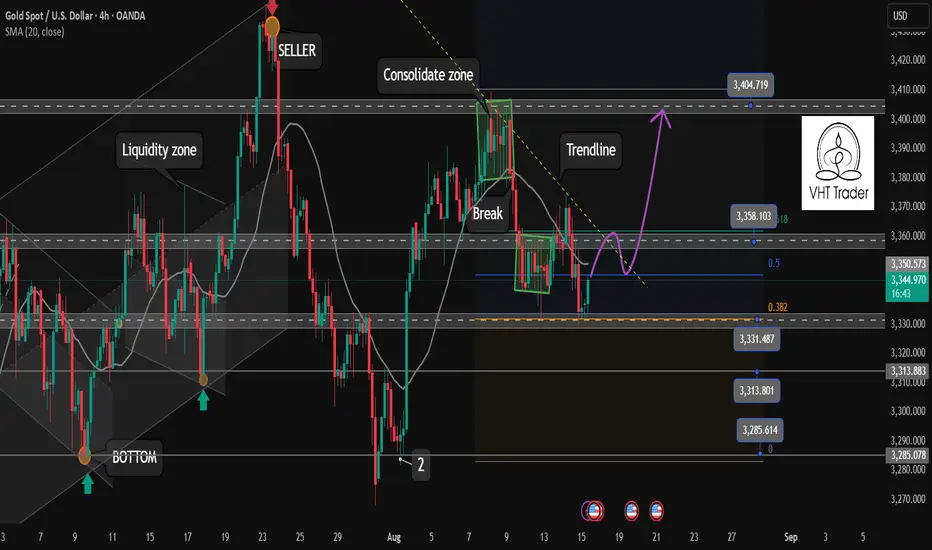
Today's important price zone 3332. Determine the Gold Trend✏️Gold continues to receive some buying pressure at 3332 Fibonacci 0.382 zone. Thus, 3332 zone becomes the Key Level zone in the current trend. Gold is currently trading in a 332-3360 border zone. When Price breaks the trendline as well as Fibonacci 3360, it will confirm clear buying pressure.
📉 K
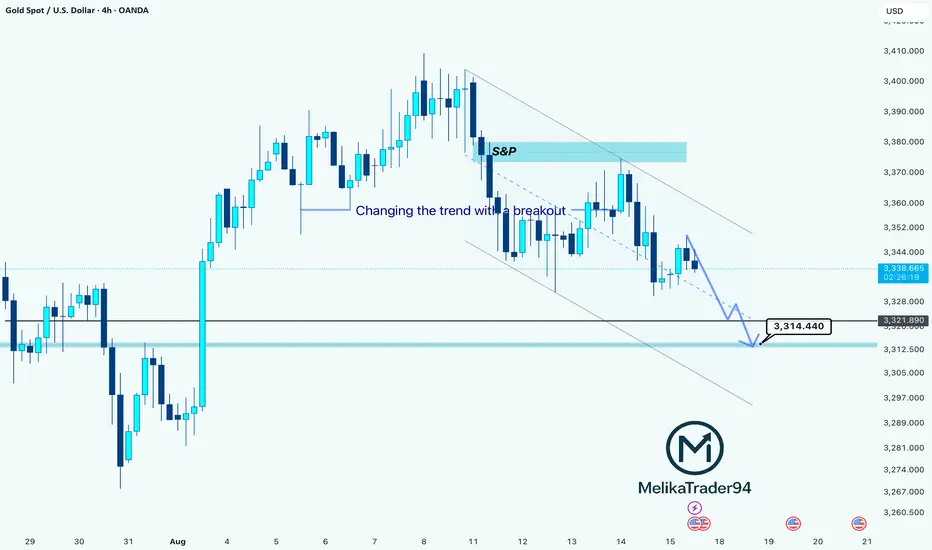
XAU/USD: Trend Change After Breakout, Bearish ContinuationHello guys!
After a strong bullish run, Gold has shifted momentum with a clear breakout to the downside, confirming a change in trend. The S&P supply zone acted as a strong resistance, rejecting the price back into a descending channel.
Currently, price is respecting the channel structure and has
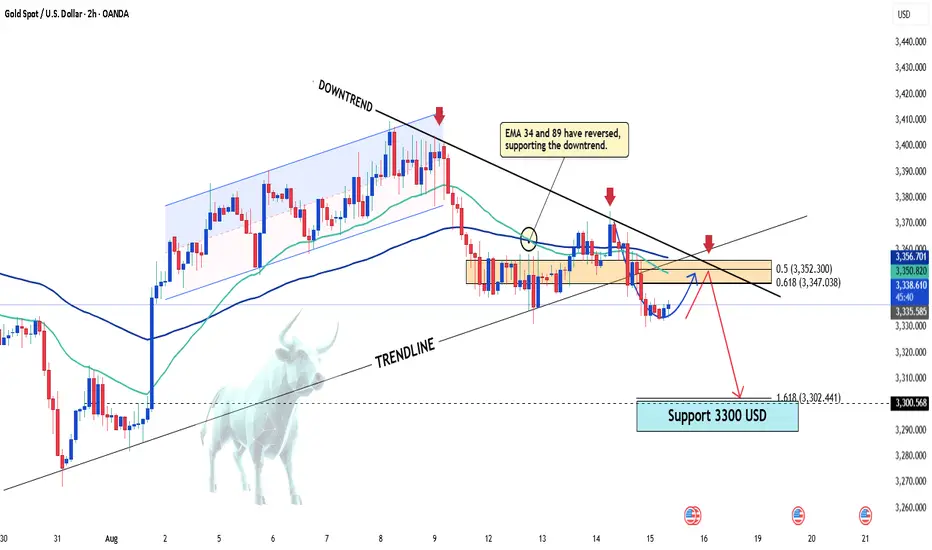
Gold Faces Sharp Decline After Key Data ReleaseHello everyone, what are your thoughts on the current trend of XAUUSD?
Contrary to expectations, gold saw a steep correction yesterday. The precious metal is now trading around 3,340 USD, roughly 30 USD lower than the previous session’s high.
This drop came after yesterday’s economic data releas
3330 Under Pressure – New York Could Decide the MoveYesterday’s Move
Yesterday, after the initial rejection from the 3370 resistance zone, Gold broke below the 3350 confluence support and tumbled toward the 3330 key support. Since then, the price has been consolidating, with low volatility — largely due to the European bank holiday.
Key Question
THE KOG REPORT - UpdateEnd of day update from us here at KOG:
A decent week on the markets with the path playing out quiet well, the bias levels holding and the bias level and red box targets completing. It's been frustrating with the range and the choppy price action but you have to adapt to the markets you're in.
Now

See all futures ideas
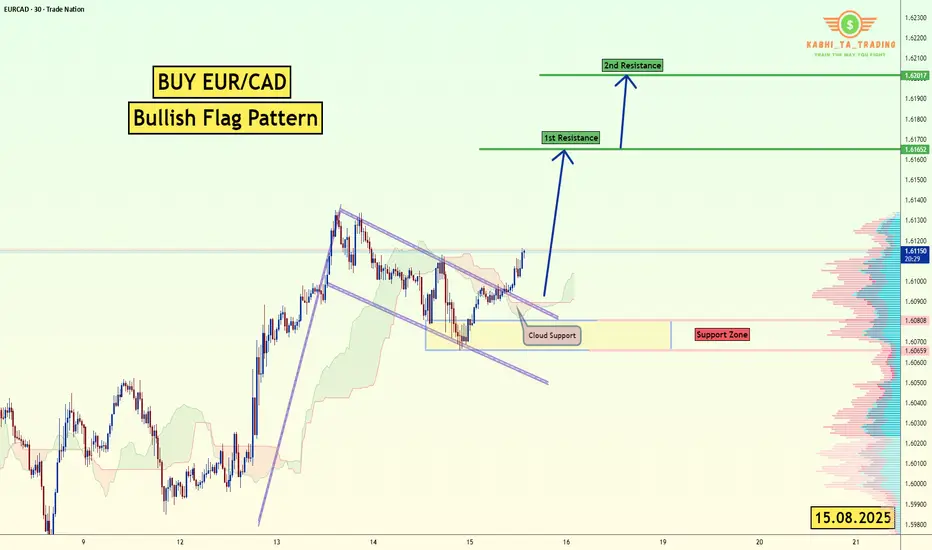
EUR/CAD - H1 - Flag Breakout (15.08.2025)The EUR/CAD pair on the M30 timeframe presents a Potential Buying Opportunity due to a recent Formation of a Bullish Flag Pattern Pattern. This suggests a shift in momentum towards the upside and a higher likelihood of further advances in the coming hours.
Possible Long Trade:
Entry: Consider Ent
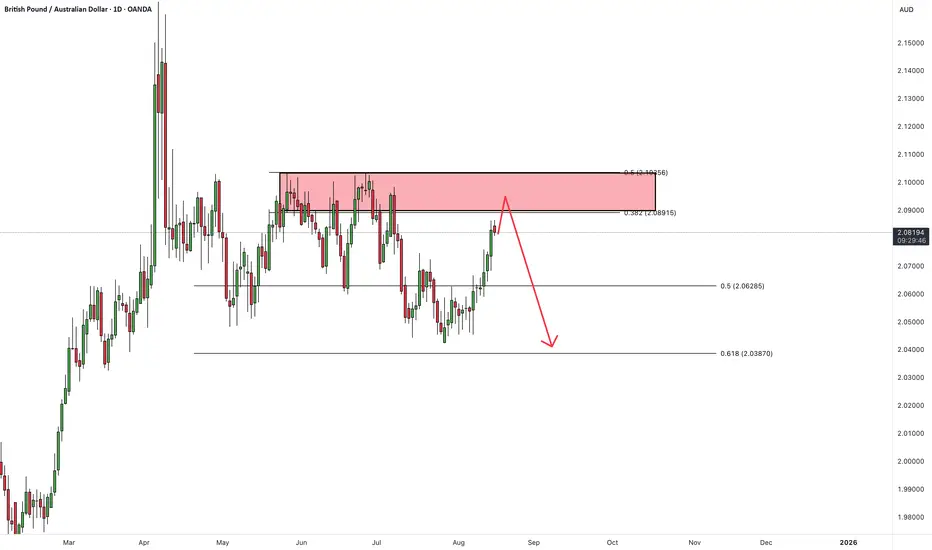
GBPAUDHello Traders! 👋
What are your thoughts on GBPAUD?
The GBP/AUD pair has reached a significant resistance zone.
We anticipate some consolidation or choppy movement in this area, followed by a potential bearish reversal toward lower support levels.
As long as price remains below the resistance, the b
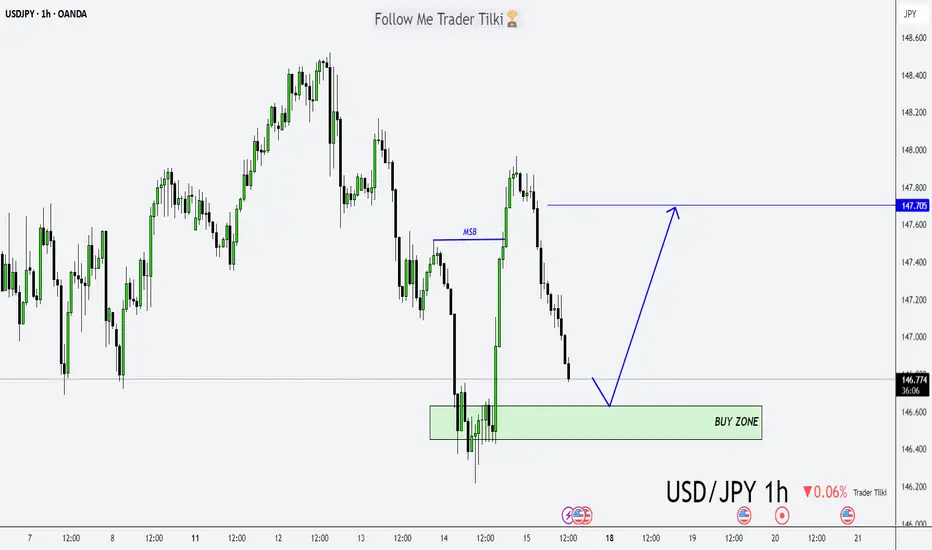
Everything’s Aligned: USDJPY Buy Setup Locked and LoadedHey friends 👋
I’ve prepared a fresh USDJPY analysis for you.
I’m planning to open a buy position around 146.631 or 146.451, targeting the 147.700 level.
Also, today’s upcoming U.S. economic data will play a key role from a fundamental analysis perspective.
Every single like you send is my bigges
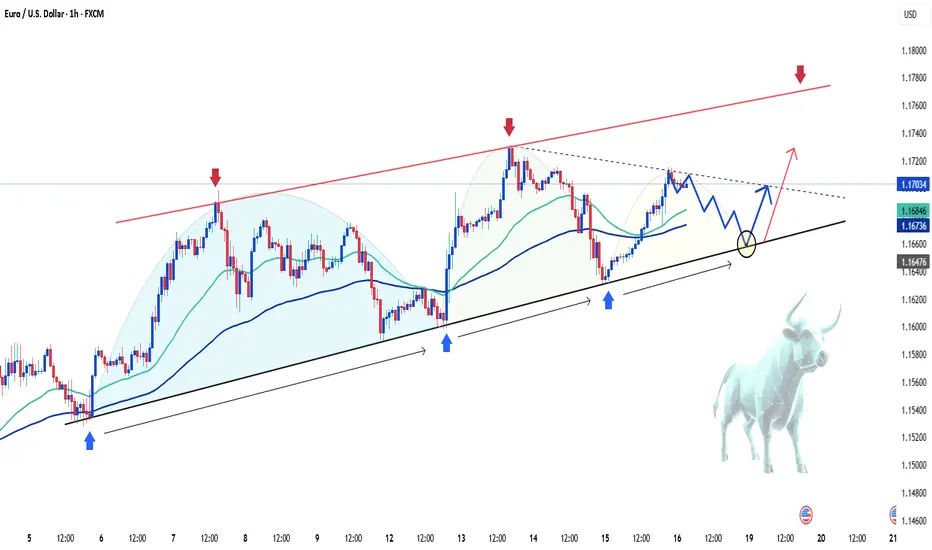
EURUSD Holds Bullish Momentum – Next Target 1.177?Hello everyone, what do you think about the trend of FX:EURUSD ?
EUR/USD continues its upward momentum, trading in positive territory around 1.1700 during the end-of-week session. Mixed retail sales and consumer sentiment data from the US have made it difficult for the US Dollar to gain traction,
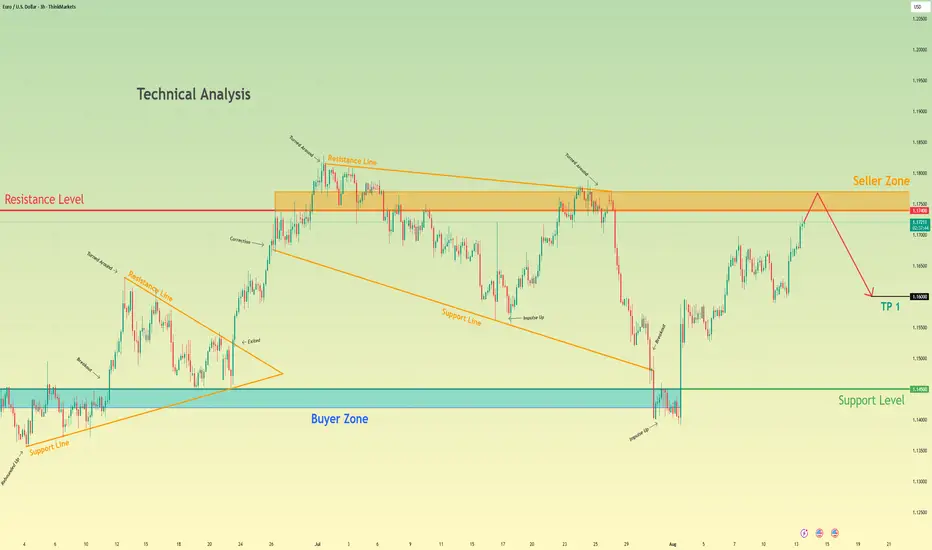
Euro may reach seller zone and then start to decline to 1.1600Hello traders, I want share with you my opinion about Euro. The historical price action for the Euro began with a period of contracting volatility, where the market consolidated within a triangle formation. A decisive breakout from this triangle unleashed a strong upward impulse, which marked a shif
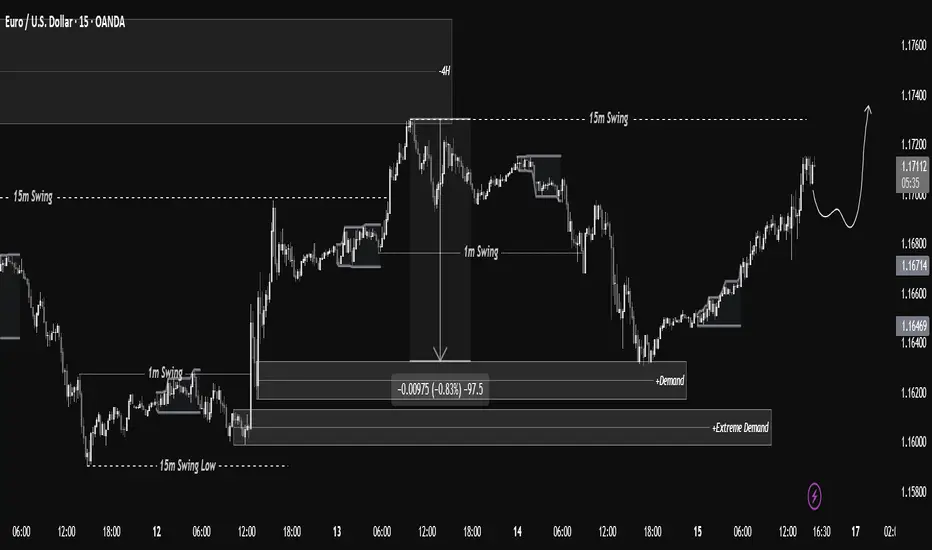
$EURUSD 15m Mark-UpOANDA:EURUSD
August 15
Analysis Notes:
After the nearly 100 Pip drop we captured on EURUSD, price has reacted to the 4H zone, bounced from the decision demand, and is now heading towards the 15-minute swing. It will likely move up to 50% of the 4H supply zone.
Follow us to never miss more
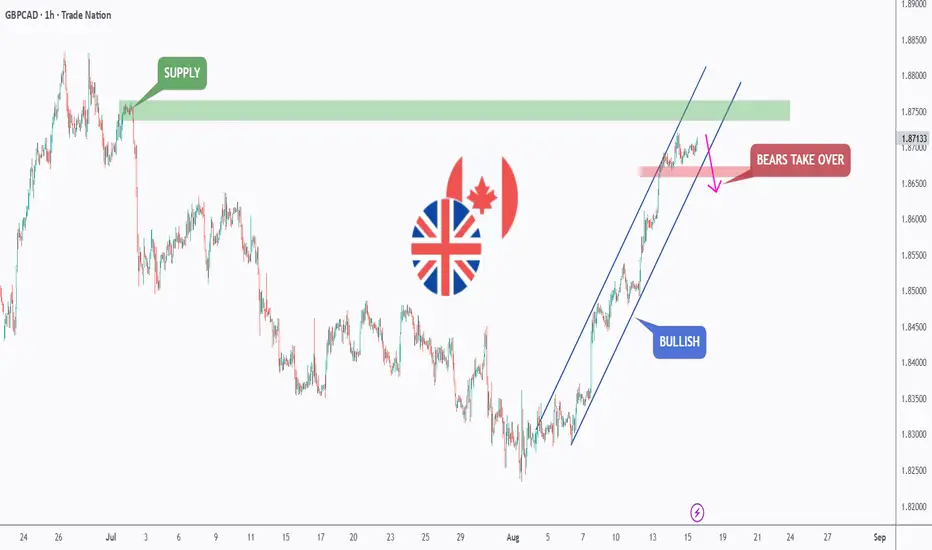
GBPCAD - Bulls in Control, But Supply Zone Ahead🏹 GBPCAD has been climbing within a steep bullish channel , approaching a key supply zone around 1.8750. As long as the channel holds, buyers remain in control.
However, if price rejects this supply area and breaks below the 1.8670 support, the bears could take over, potentially triggering a deeper
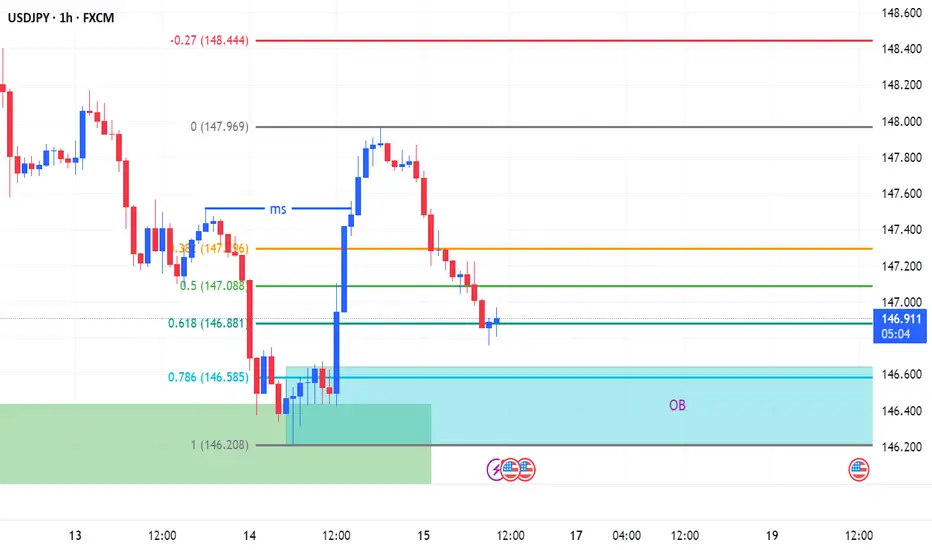
buy USD/JPY Following Price liquidity sweep on the downside, price reached a major 4 hour demand zone and price pushed to the upside on a supply zone causing a market shift. price is expected to pull to a 4 hour OB at 146.64, which aligns with the golden fib retracement at 0.786. price then likely to push til
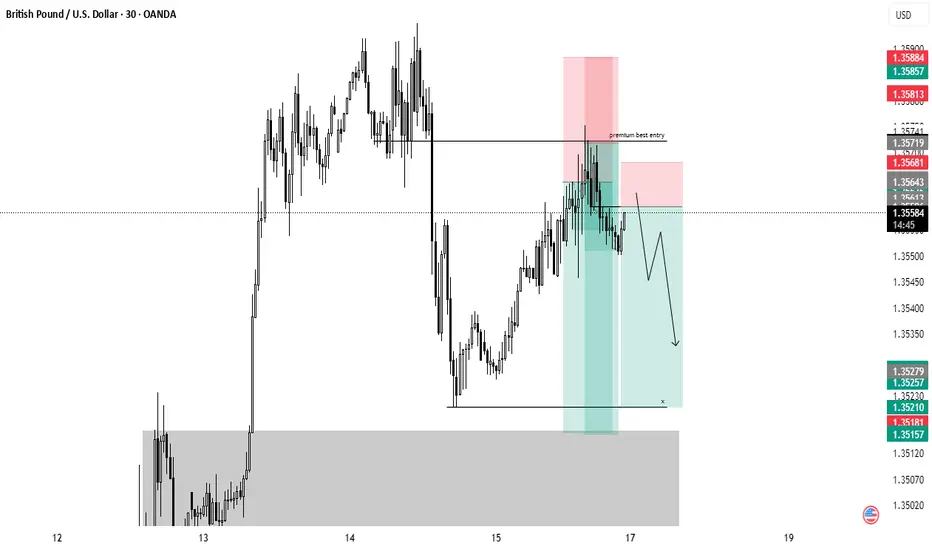
GBPUSD follow up entryPossible entry following current bearish move
Mitigation on OB + sweep of liquidity
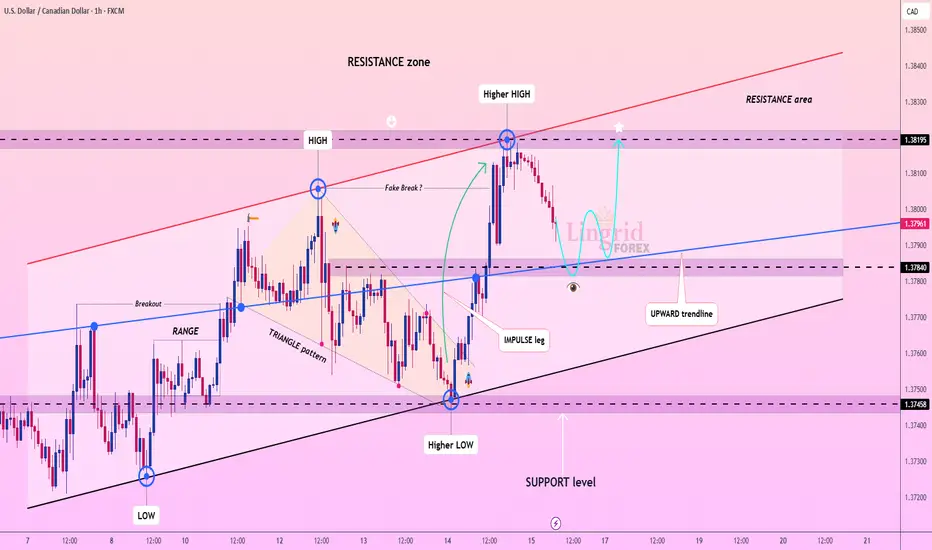
Lingrid | USDCAD Potential Resistance Zone RetestFX:USDCAD is pulling back from the higher high near 1.3820 after testing the resistance zone, with price still holding above the upward trendline. A retest of the 1.3784–1.3780 zone could invite buyers back for another push toward the 1.3819 target. Maintaining higher lows along the trendline keeps
See all forex ideas
| - | - | - | - | - | - | - | ||
| - | - | - | - | - | - | - | ||
| - | - | - | - | - | - | - | ||
| - | - | - | - | - | - | - | ||
| - | - | - | - | - | - | - | ||
| - | - | - | - | - | - | - | ||
| - | - | - | - | - | - | - | ||
| - | - | - | - | - | - | - |
Trade directly on the supercharts through our supported, fully-verified and user-reviewed brokers.


