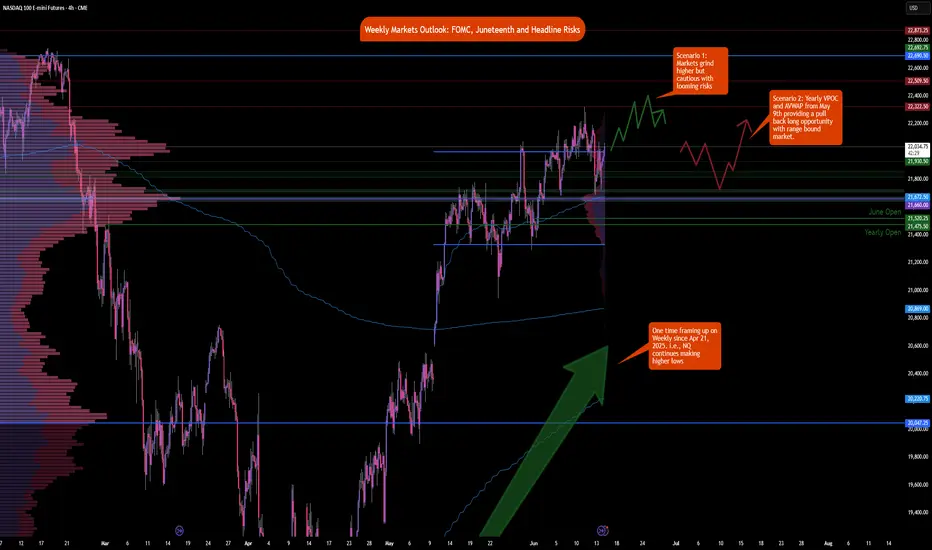
Weekly Market Outlook: FOMC, Trade Deals and GeopoliticsIt is a holiday-shortened week, with the majority of markets halting early on Thursday, June 19, 2025, in observance of Juneteenth. See here for holiday trading schedule
Key Themes to Monitor This Week
Geopolitical Risks
Any outside intervention in the ongoing Israel-Iran conflict will like

The best trades require research, then commitment.
Get started for free$0 forever, no credit card needed

Scott "Kidd" PoteetThe unlikely astronaut

Where the world does markets
Join 100 million traders and investors taking the future into their own hands.
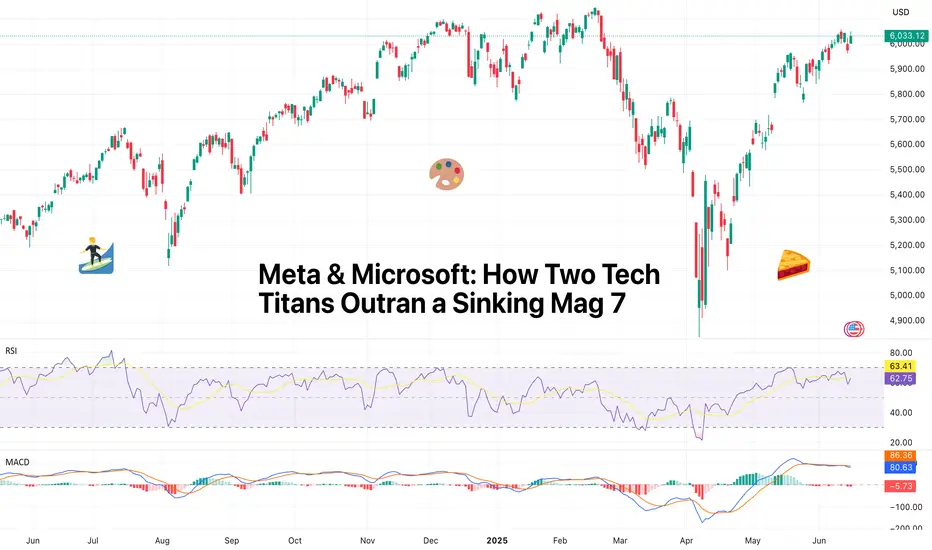
Meta & Microsoft: How Two Tech Titans Outran a Sinking Mag 7Forget about the Magnificent Seven and say hello to M&M — the only two winners of the year so far.
If you blinked during the first half of 2025, you might’ve missed it: the mighty Magnificent Seven are starting to look more like a Scraggly Five. While Tesla NASDAQ:TSLA fumbled its autonomy narra
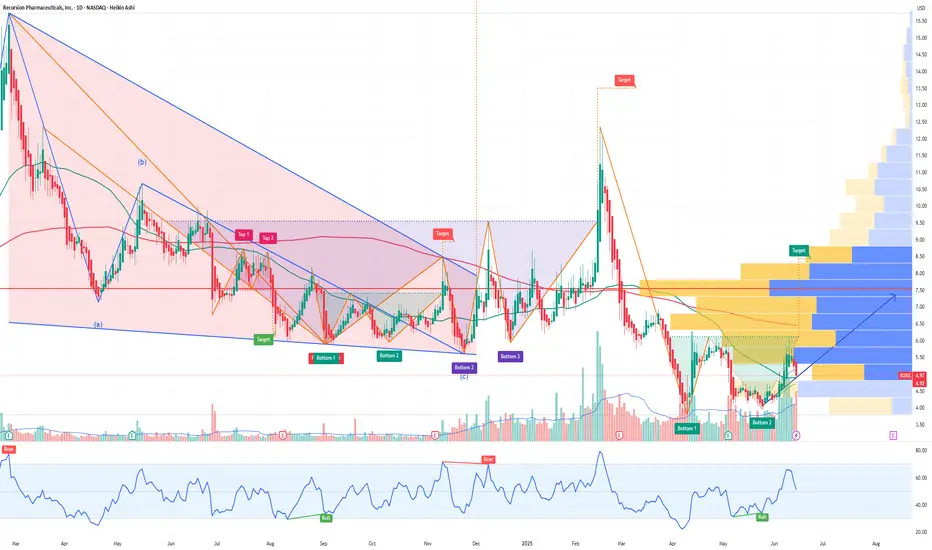
Why Recursion Pharmaceuticals RXRX Could Be the NVDA of BiotechRecursion Pharmaceuticals RXRX is rapidly emerging as a transformative force in drug discovery, leveraging cutting-edge artificial intelligence and automation to industrialize and accelerate the development of new medicines. Here’s why RXRX could be the next NVIDIA (NVDA) of biotechnology and why it
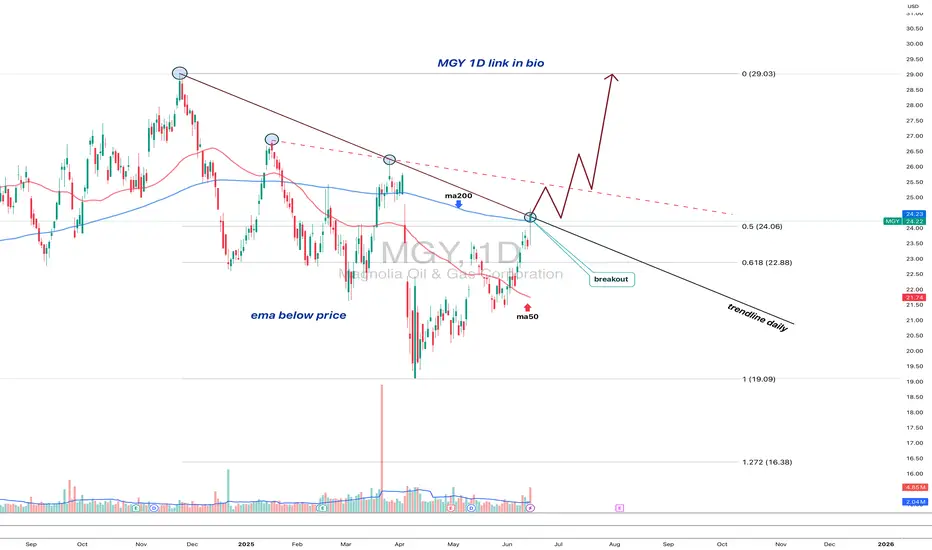
MGY: Technical Breakout + Fundamental Momentum = Quiet Winner?Magnolia Oil & Gas (MGY) is showing one of the cleanest technical breakouts in the energy sector — and the market hasn’t priced it in yet. After months of pressure, price has broken above both the 50-day and 200-day moving averages with rising volume, signaling a clear phase shift from distribution
Gold Takes the Throne as Safe Haven AgainThe recent escalation in the Middle East — particularly Israel’s surprise strike on Iran — has stirred up significant volatility in global financial markets. Oil prices surged, stock markets around the world turned red, just as many had predicted. However, in a surprising twist, capital did not rush
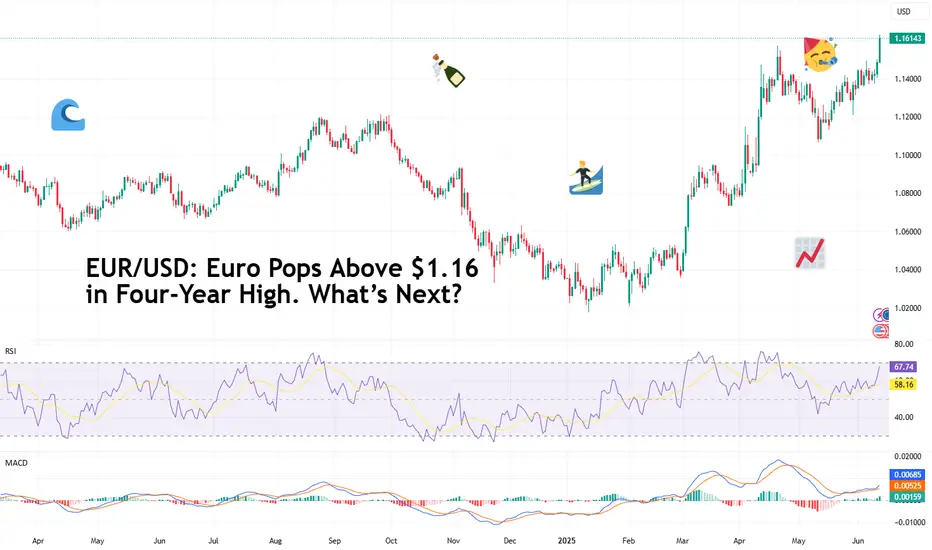
EUR/USD: Euro Pops Above $1.16 in Four-Year High. What’s Next?The dollar wobbles, Trump talks tariffs, and the euro’s got its dancing shoes on.
The Euro Wakes Up, Stretching Its Legs at $1.16
Look who just rolled out of bed and decided to make a scene.
For the first time in four years, the euro has finally leapt out of its slumber and sprinted to $1.16 —
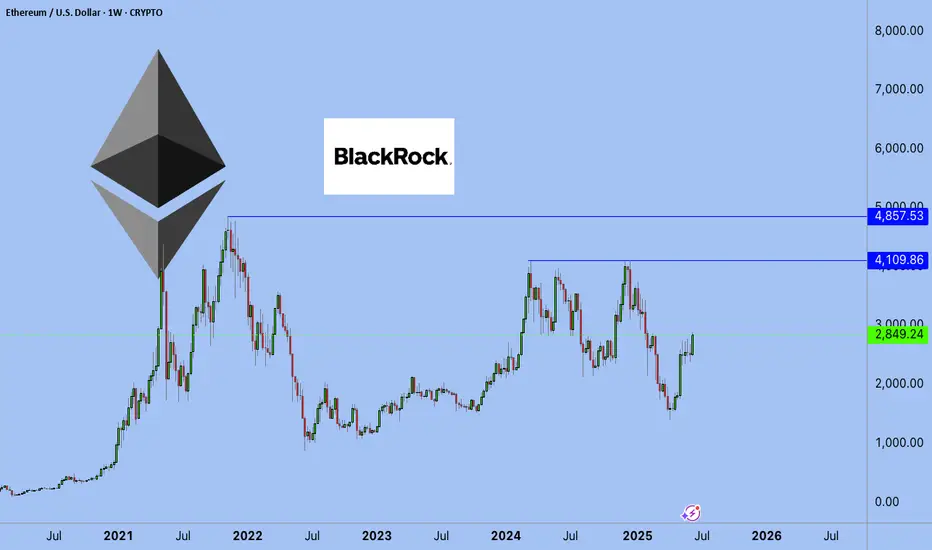
ETHEREUM: THE NEW BOND OF THE DIGITAL WORLDPrice isn’t the goal. Price is the side effect.
Meanwhile, BlackRock - a black hole with a trust-backed logo - just absorbed 42,000 ETH more.
Yesterday, you may have read this "regular" headline:
BlackRock increases its Ethereum exposure to $4 billion, adding $109.5 million via ETFs.
But here’s w
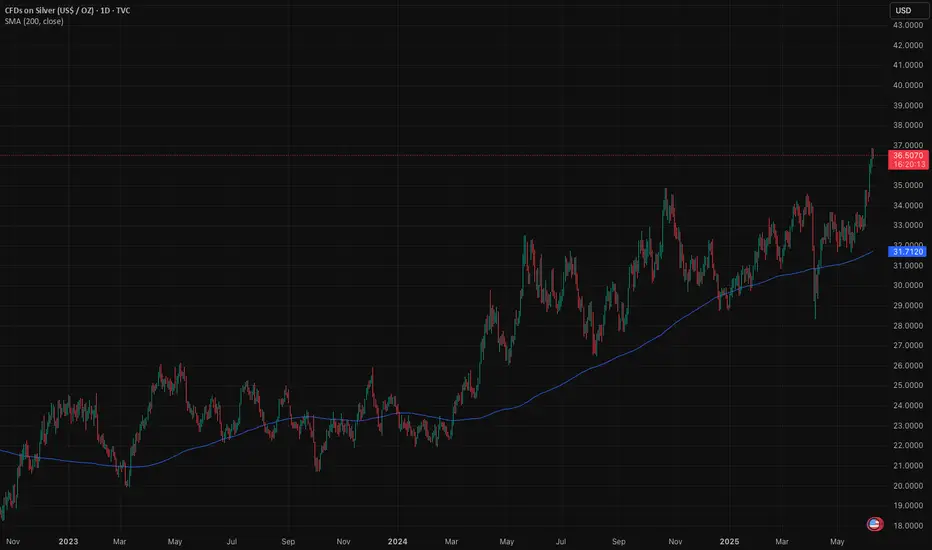
Silver surge has more bullish upsideSilver is breaking out. Its strength is no accident. The US is running a structural deficit north of 6% of GDP in a full-employment economy. The bond market has absorbed the pain so far, but pressure is building. Investors are starting to look for insurance. Silver is one of the cleanest ways to pl
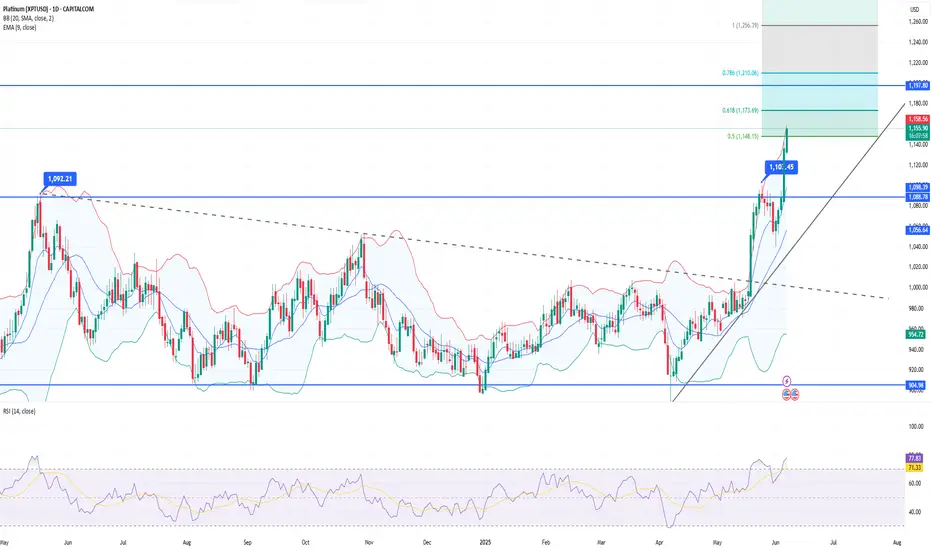
Soaring platinum breaks a 3 year high at $1,152.50/ozChina, the world’s largest consumer of platinum, imported its highest amount in a year last month. Retail investment demand (bars and coins) in China more than doubled, overtaking North America as the top market for platinum investment.
Analysts at Bloomberg Intelligence predict that global platinum
Elon Musk vs Trump: Who you betting on?Elon Musk and Donald Trump have recently had a public falling-out, with their feud playing out on social media and in political circles.
The dispute seems to have started over Trump's new budget bill, which Musk has criticized for increasing the national debt. Trump, in turn, accused Musk of being

See all editors' picks ideas
Trend Impulse Channels (Zeiierman)█ Overview
Trend Impulse Channels (Zeiierman) is a precision-engineered trend-following system that visualizes discrete trend progression using volatility-scaled step logic. It replaces traditional slope-based tracking with clearly defined “trend steps,” capturing directional momentum only when

Magnificent 7 OscillatorThe Magnificent 7 Oscillator is a sophisticated momentum-based technical indicator designed to analyze the collective performance of the seven largest technology companies in the U.S. stock market (Apple, Microsoft, Alphabet, Amazon, NVIDIA, Tesla, and Meta). This indicator incorporates established

SmartPhase Analyzer📝 SmartPhase Analyzer – Composite Market Regime Classifier
SmartPhase Analyzer is an adaptive regime classification tool that scores market conditions using a customizable set of statistical indicators. It blends multiple normalized metrics into a composite score, which is dynamically evaluated

ATR RopeATR Rope is inspired by DonovanWall's "Range Filter". It implements a similar concept of filtering out smaller market movements and adjusting only for larger moves. In addition, this indicator goes one step deeper by producing actionable zones to determine market state. (Trend vs. Consolidation)
>

Langlands-Operadic Möbius Vortex (LOMV)Langlands-Operadic Möbius Vortex (LOMV)
Where Pure Mathematics Meets Market Reality
A Revolutionary Synthesis of Number Theory, Category Theory, and Market Dynamics
🎓 THEORETICAL FOUNDATION
The Langlands-Operadic Möbius Vortex represents a groundbreaking fusion of three profound mathematic

Risk-Adjusted Momentum Oscillator# Risk-Adjusted Momentum Oscillator (RAMO): Momentum Analysis with Integrated Risk Assessment
## 1. Introduction
Momentum indicators have been fundamental tools in technical analysis since the pioneering work of Wilder (1978) and continue to play crucial roles in systematic trading strategies (Jeg

TrendMaster Pro 2.3 with Alerts
Hello friends,
A member of the community approached me and asked me how to write an indicator that would achieve a particular set of goals involving comprehensive trend analysis, risk management, and session-based trading controls. Here is one example method of how to create such a system:
Core

Support and Resistance Logistic Regression | Flux Charts💎 GENERAL OVERVIEW
Introducing our new Logistic Regression Support / Resistance indicator! This tool leverages advanced statistical modeling "Logistic Regressions" to identify and project key price levels where the market is likely to find support or resistance. For more information about the proc

Mandelbrot-Fibonacci Cascade Vortex (MFCV)Mandelbrot-Fibonacci Cascade Vortex (MFCV) - Where Chaos Theory Meets Sacred Geometry
A Revolutionary Synthesis of Fractal Mathematics and Golden Ratio Dynamics
What began as an exploration into Benoit Mandelbrot's fractal market hypothesis and the mysterious appearance of Fibonacci sequences i

EMD Trend [InvestorUnknown]EMD Trend is a dynamic trend-following indicator that utilizes Exponential Moving Deviation (EMD) to build adaptive channels around a selected moving average. Designed for traders who value responsive trend signals with built-in volatility sensitivity, this tool highlights directional bias, market

See all indicators and strategies
Community trends
Tesla - This bullish break and retest!Tesla - NASDAQ:TSLA - confirmed the bullish reversal:
(click chart above to see the in depth analysis👆🏻)
Tesla recently created a very bullish break and retest. Therefore together with the monthly bullish price action, the recent rally was totally expected. But despite the short term volatilit

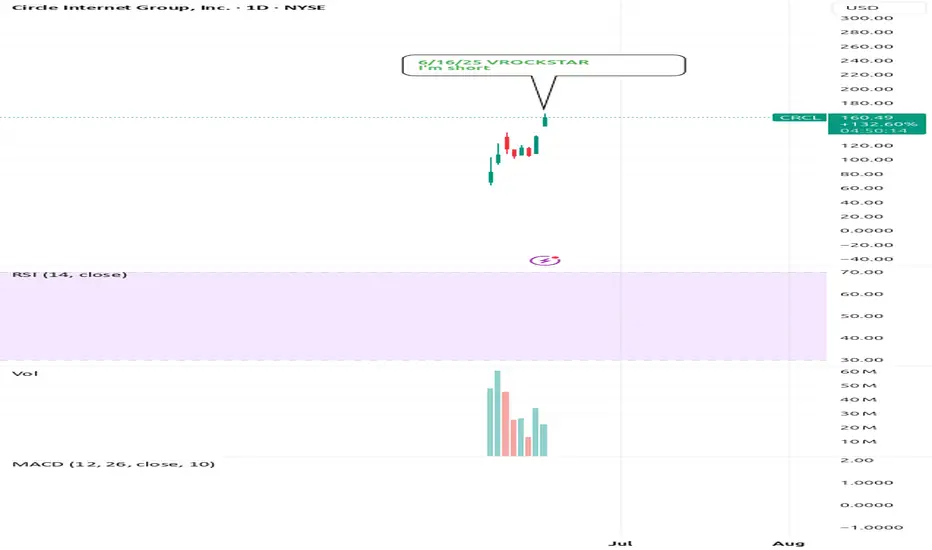
6/16/25 - $crcl - I'm short6/16/25 :: VROCKSTAR :: NYSE:CRCL
I'm short
- it's much easier to find shorts in this tape than the converse
- NYSE:CRCL is the chitstablecoin that broke a few yrs ago and nobody serious in "crypto" (when i mention "serious" i mean bitcoiners) uses
- they basically hold deposits and give you a
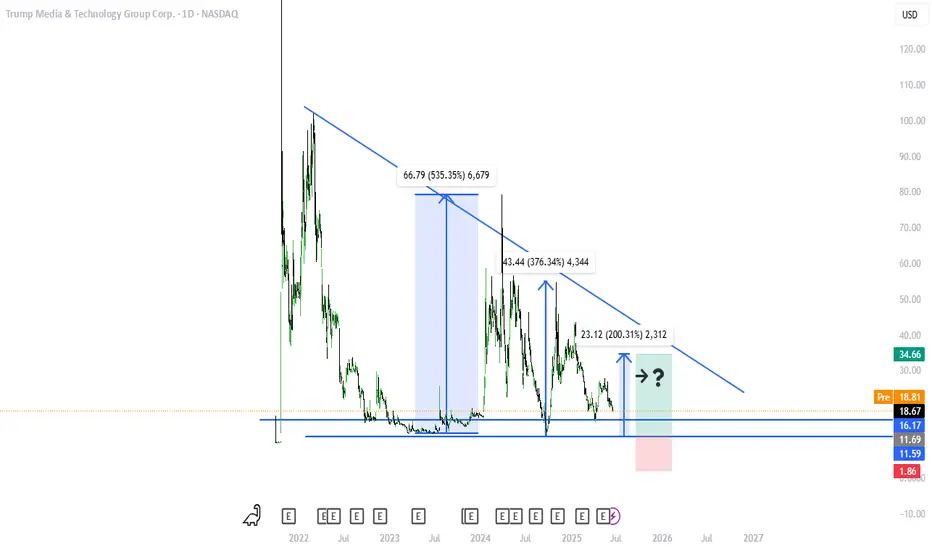
Is DJT getting ready for a pump?The “Pump”—Trump Hype and Public Signals
-Trump’s social media signals: Trump frequently posts “THIS IS A GREAT TIME TO BUY!!! DJT” on Truth Social or X, coinciding with dramatic tariff announcements or political rallies. Shortly after, DJT stock often spikes—rising ~22% in a single day following
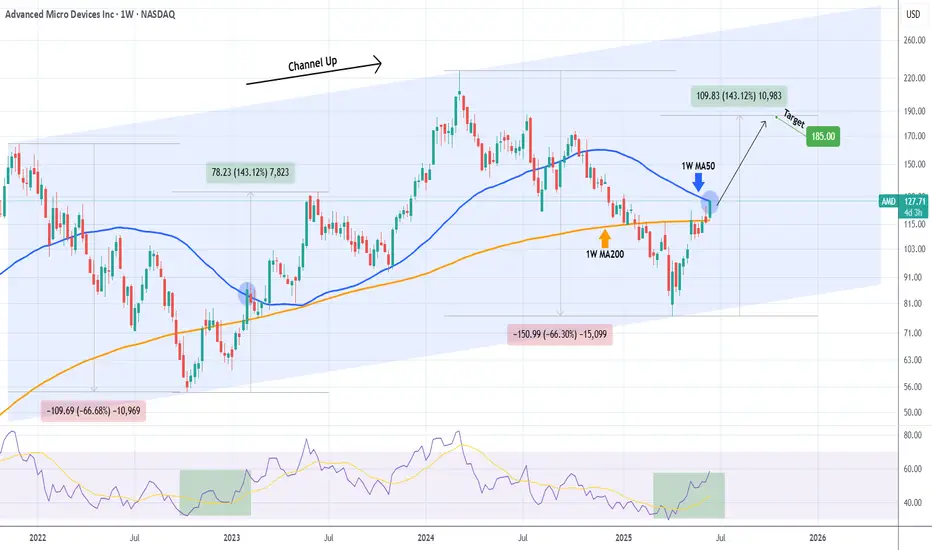
AMD First touch of 1W MA50 after 8 months!Advanced Micro Devices (AMD) hit today its 1W MA50 (blue trend-line) for the first time in almost 8 months (since October 28 2024). This is a crucial test as the las time this level broke as a Resistance following a Channel Up bottom rebound was on the week of January 30 2023.
When that happened, t
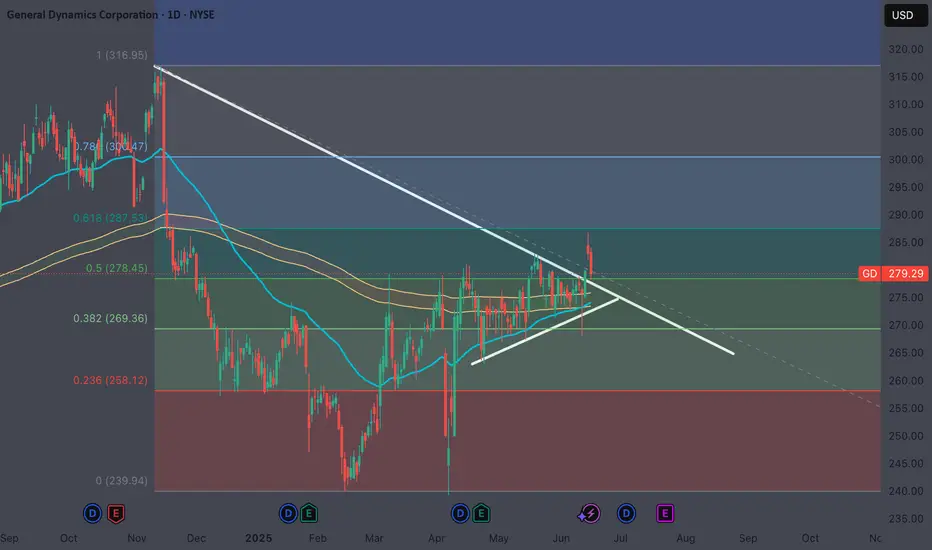
General Dynamics Launch Pad Cleared for TakeoffNYSE:GD Multiple Bullish Signals Detected
- Geopolitical tensions are causing bullish tailwinds for the defense sector
- Tested .5 Fibonacci retracement level 5 times before breakout, now retesting as support
- Lined up perfectly with the trendline breakout and retest
- And the overnight gap fr
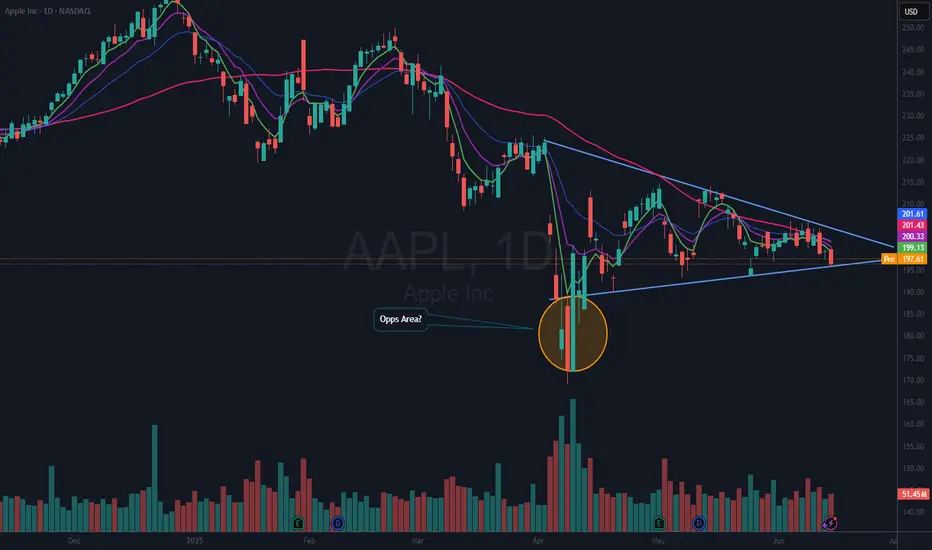
$AAPL In ConsolidationNASDAQ:AAPL is consolidating here in a wedging pattern. I do not know which way this will resolve. But, since I rarely if ever short, I am looking on the long side of a trade. The thing I like about a consolidation pattern like this is, you know when you are wrong very quickly. My plan is to take a
NIO CHART UPDATETRENDS AND PRICE TARGETS MARKED
GAPS IN YELLOW
Guideline in yellow.
Watch the two major trends closely, (RED)
short term trends going down are about to break.
Red trends will become support when price crosses over and confirms the Daily.
Good luck!

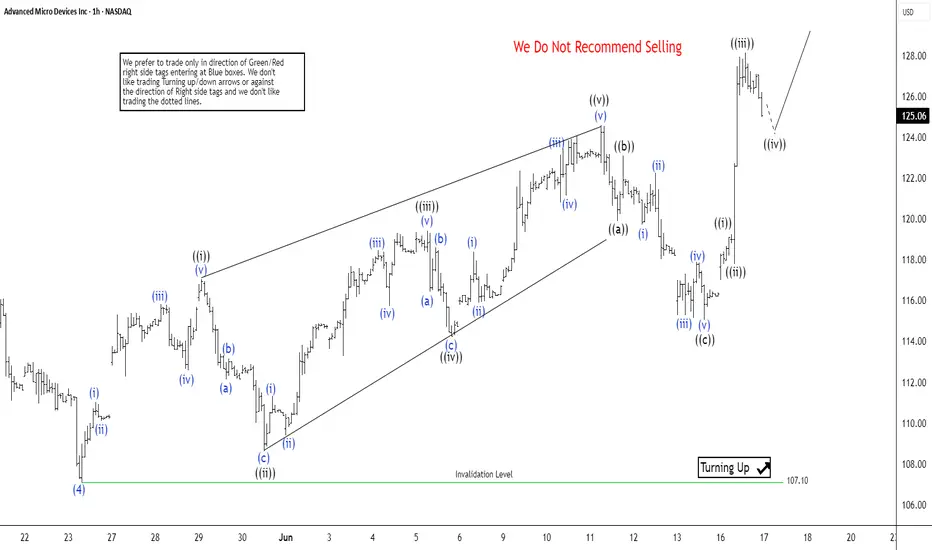
AMD Elliott Wave Analysis: 5 Wave Rally Supports Bullish BiasSince bottoming out on April 10, 2025, Advanced Micro Devices (AMD) has embarked on a robust rally, signaling a bullish trend. Technical analysis reveals a five-swing sequence from the April 10 low, favoring continued upward momentum. The initial ascent, wave (1), peaked at $97.91, followed by a cor
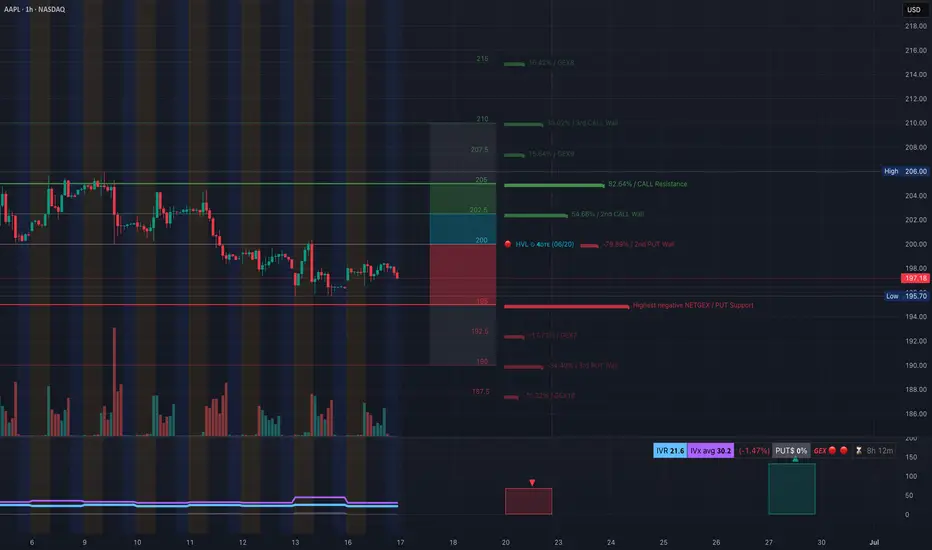
AAPL Breaking Structure! Gamma Says Caution — Is $195 Next? 🍎 AAPL Breaking Structure! Gamma Says Caution — Is $195 Next? 🔻
🧬 GEX Options Sentiment Analysis:
* Gamma Key Levels:
* CALL Walls:
* $202.50 (moderate resistance)
* $205 = Gamma Wall / Call Resistance
* $210–215 = Higher walls unlikely to reach short-term without cataly
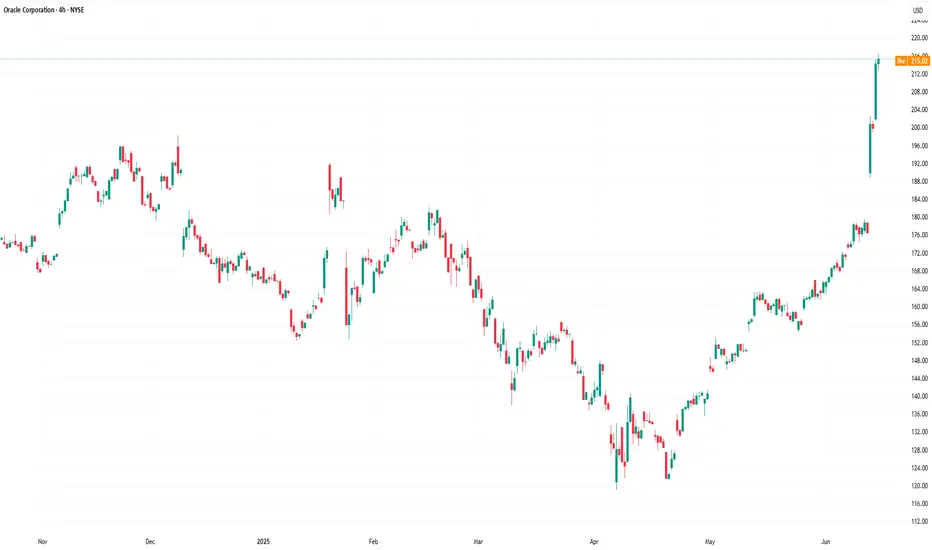
Oracle (ORCL) shares surge 24% in a week, hitting all-time highOracle (ORCL) shares surge 24% in a week, hitting an all-time high
Last week, Oracle (ORCL) shares:
→ rose by approximately 24% — marking the strongest weekly gain since 2001;
→ broke through the psychological level of $200 per share;
→ reached an all-time high, with Friday’s session closing above
See all stocks ideas
Today
KIRKKirkland's, Inc.
Actual
−0.51
USD
Estimate
−0.47
USD
Today
VNCEVince Holding Corp.
Actual
0.23
USD
Estimate
−0.48
USD
Today
WLYJohn Wiley & Sons, Inc.
Actual
1.37
USD
Estimate
1.27
USD
Today
JBLJabil Inc.
Actual
2.55
USD
Estimate
2.31
USD
Today
PODCPodcastOne, Inc.
Actual
—
Estimate
−0.04
USD
Today
CRWSCrown Crafts, Inc.
Actual
—
Estimate
—
Today
QMCOQuantum Corporation
Actual
—
Estimate
−1.17
USD
Today
TENTsakos Energy Navigation Ltd
Actual
0.92
USD
Estimate
0.48
USD
See more events
Community trends
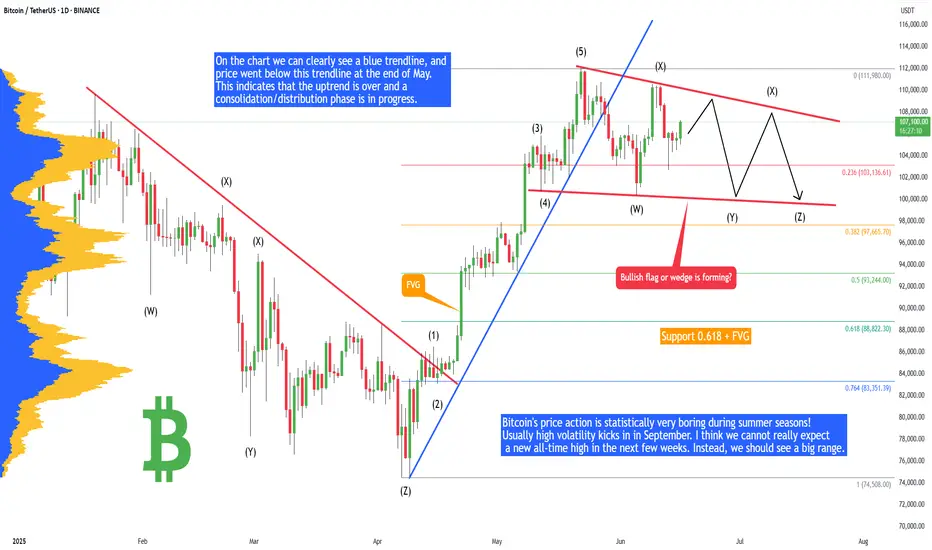
Bitcoin - Plan for summer 2025 (no new ATH, big range!)Bitcoin's price action is statistically very boring during summer seasons! Usually high volatility kicks in in September. I think we cannot really expect a new all-time high in the next few weeks. Instead, we should see a big range. Why? Let's take a look at technical analysis.
On the chart we can
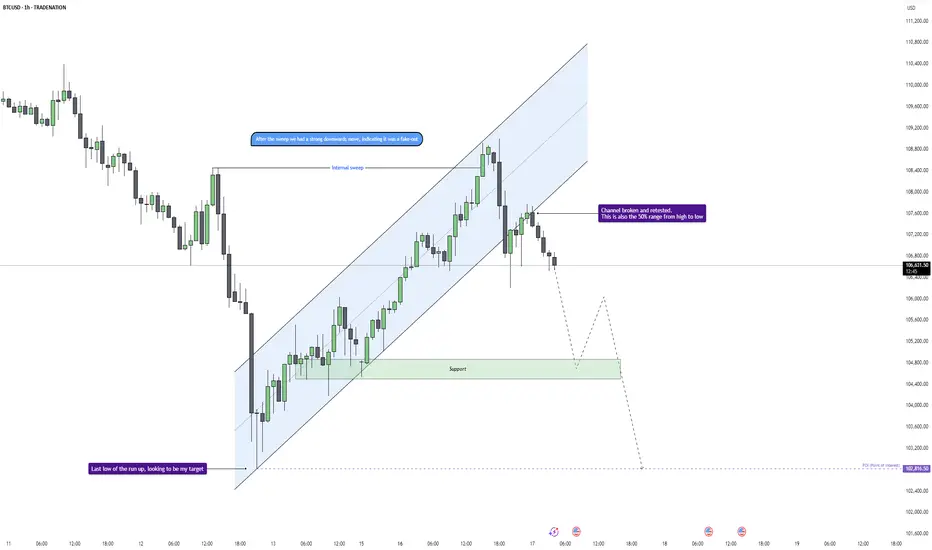
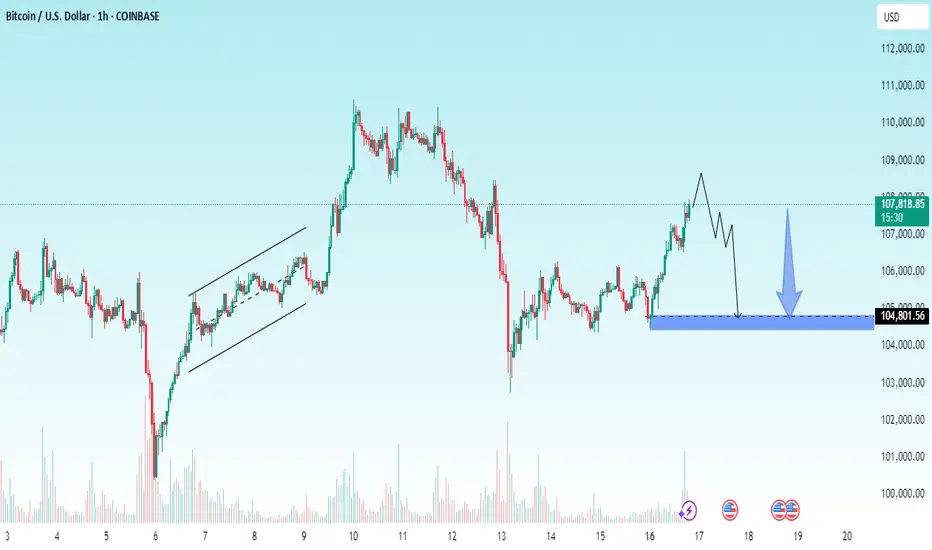
Bitcoin - Trend Shift Confirmed, Eyes on $102.8K LiquidityMarket Context
Bitcoin showed signs of exhaustion after a strong short-term rally within a clean upward channel on the 1H chart. Price action had been respecting the trend structure until a key deviation occurred near $108,500, where we saw an internal liquidity sweep that hinted at potential distr
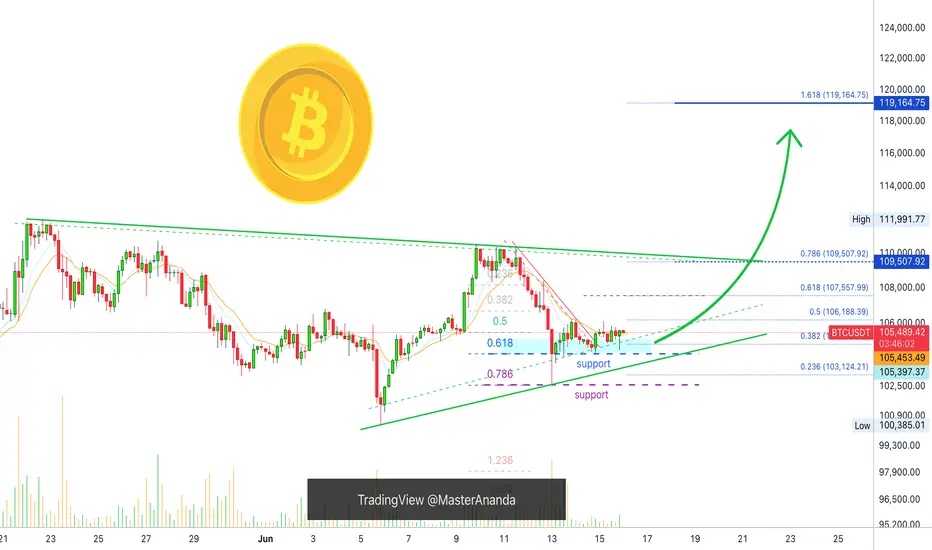
Bitcoin Mid-Term, 4H Timeframe, Bullish ($119,165 Next Target)On the 4H timeframe we have a consolidation pattern with a bullish bias. Bitcoin is aiming higher after a close above EMA8 & 13 with higher lows.
The drop 13-June found support perfectly at 0.786 Fib. retracement on a wick. The session closed above 0.618. The action turned bullish immediately and w
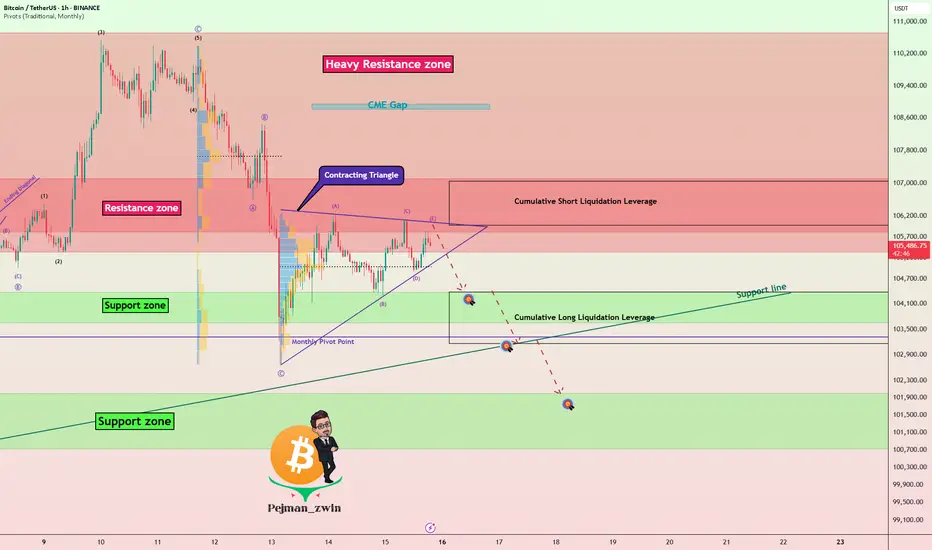
Geopolitical Tensions & Technical Pattern Point to BTC Decline!Bitcoin ( BINANCE:BTCUSDT ) fell about -5% after tensions between Israel and Iran escalated. Unfortunately , these tensions are still escalating, but Bitcoin has managed to recover about +3% so far.
Bitcoin is moving near the Resistance zone($107,120-$105,330) and Cumulative Short Liqui
HelenP. I Bitcoin will continue to move up inside triangleHi folks today I'm prepared for you Bitcoin analytics. After rebounding from the support level, the price initially showed strength and moved upward. However, the bullish momentum was short-lived, and the price began a downward correction, forming a well-defined descending channel. During this decli
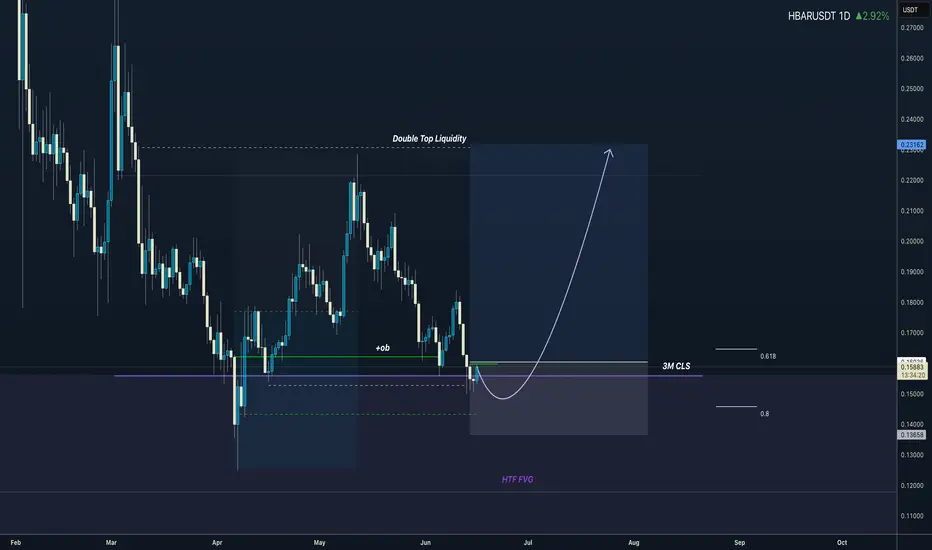
3M CLS I KL - FVG I Model 2 I Target 50% CLSHey, Market Warriors, here is another outlook on this instrument
If you’ve been following me, you already know every setup you see is built around a CLS Footprint, a Key Level, Liquidity and a specific execution model.
If you haven't followed me yet, start now.
My trading system is completely
Iran-Israel Affected Btc MarketThe conflict between Israel and Iran has escalated since the initial strike on Friday. After sustaining a wide-scale strike on nuclear facilities, ballistic missile factories and military commanders, Iran retaliated by launching drones and missile attacks on Israel.
Reuters reports that Iran has re
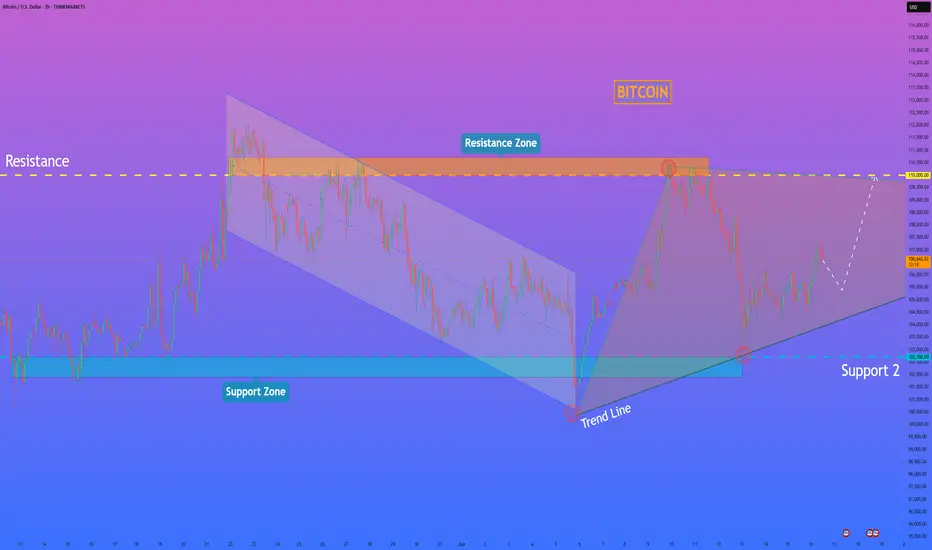
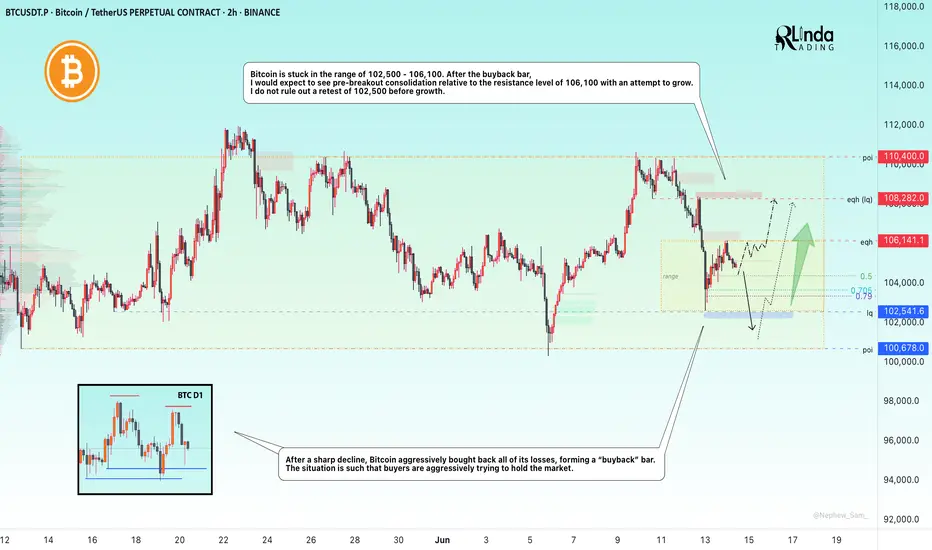
BITCOIN → Buyback bar. Chance of growth to 108,000BINANCE:BTCUSDT is trading in a fairly wide range of 100,600 - 110,400. The market is stagnating due to fundamental uncertainty, but the risks of a decline are quite high...
After the escalation of the conflict in the Middle East, Bitcoin broke the bullish structure on the market and managed t
Polkadot (DOT): Strong Signs of Potential Bullish MovementPolkadot caught our attention with rather good potential for upward movement from here, which can be seen both on 30M timeframe and 4H timeframe
More in-depth info is in the video—enjoy!
Swallow Academy

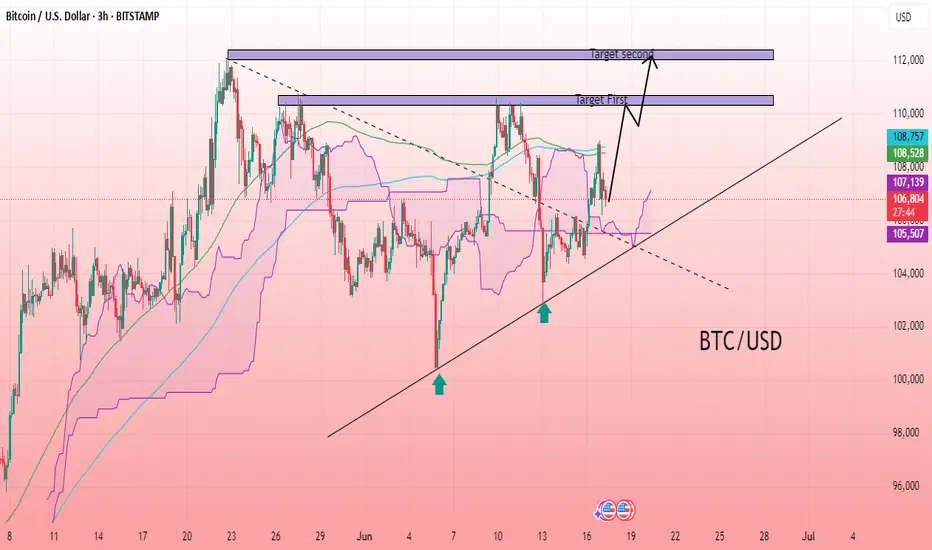
BTC/USD 3H CHART PATTERNThe BTC/USD 3-hour chart shows a bullish reversal forming from a higher low structure along a rising trendline, indicating increasing buyer strength. Price action has broken above the Ichimoku cloud and is now testing resistance levels, suggesting bullish momentum. The chart also highlights confluen
See all crypto ideas
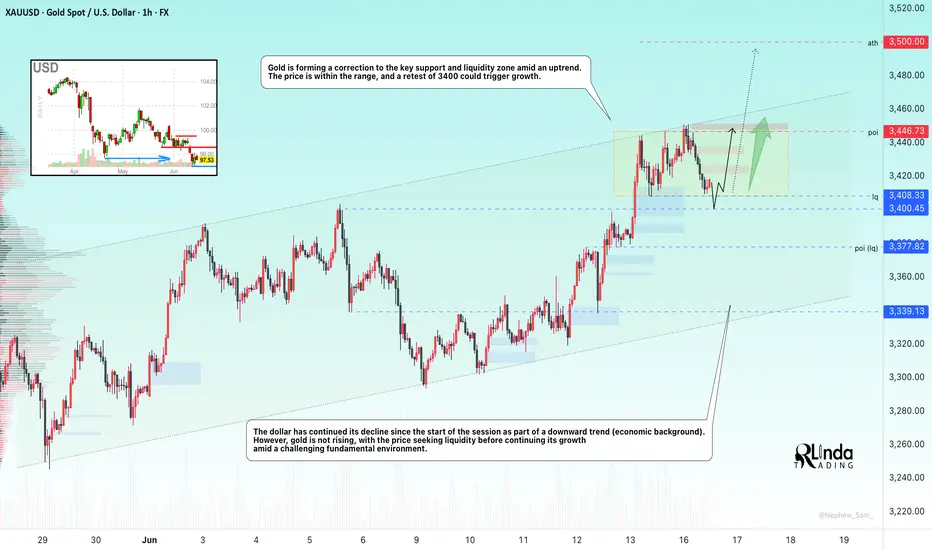
GOLD → Hunting for liquidity before continued growthFX:XAUUSD has been correcting since the start of the session. The fundamental background is complicated due to the escalation of the conflict in the Middle East.
The price of gold briefly retreated from a two-month high above $3,450 amid a recovery in the dollar and investor caution. Escalatin
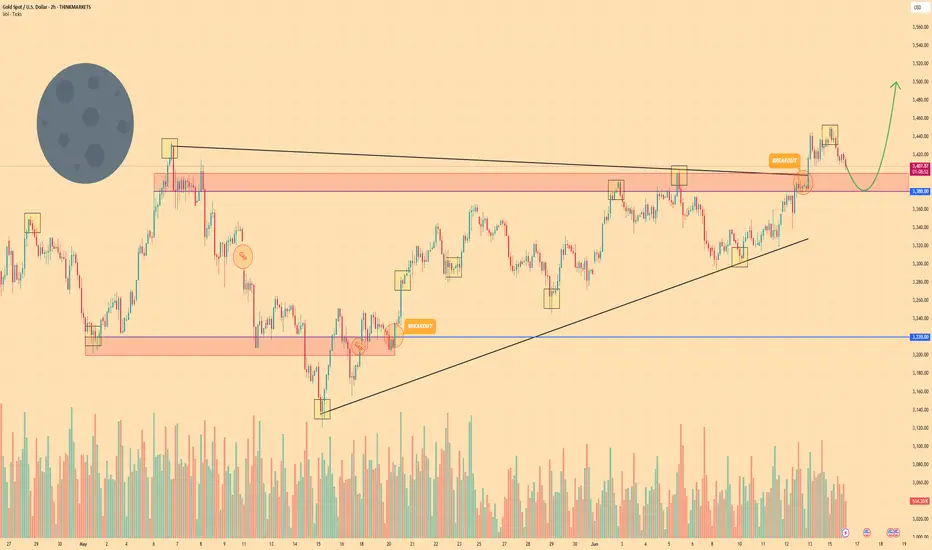
XAUUSD: Accumulation in process,Waiting for Bullish DistributionHello,
Today, we will analyse the key points of each significant move.
Following the price’s all-time high at $3500, it experienced a sharp decline and failed to maintain that level. A substantial 2400 pips would have resulted in significant losses for many accounts. Initially, it was perceived as
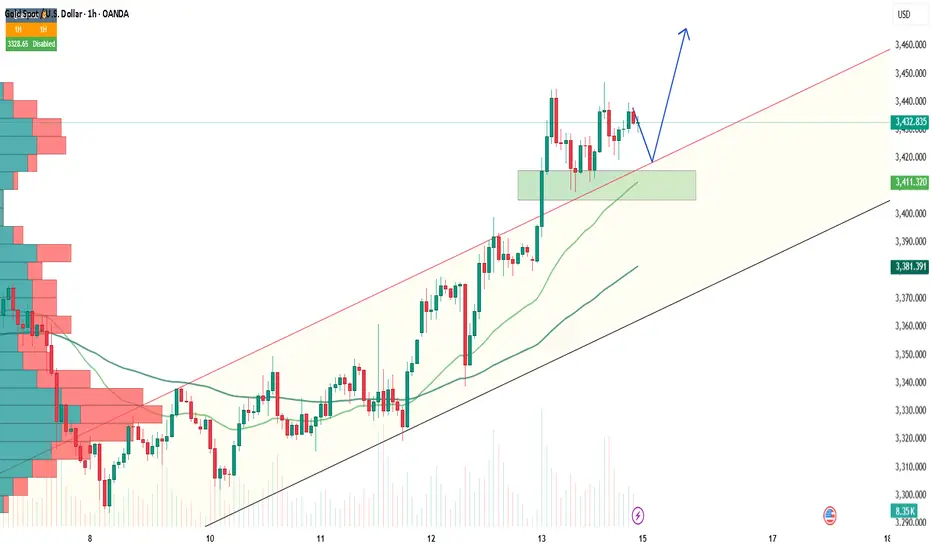
GOLD's rise has been steady, decisive move aheadGold is the focus, plain and simple. We’re in an ascending channel, and price is respecting that structure with precision, higher highs, and no major signs of exhaustion yet.
Recently a clear resistance level was just taken out, and now I am watching for the classic retest. That breakout? A big dea

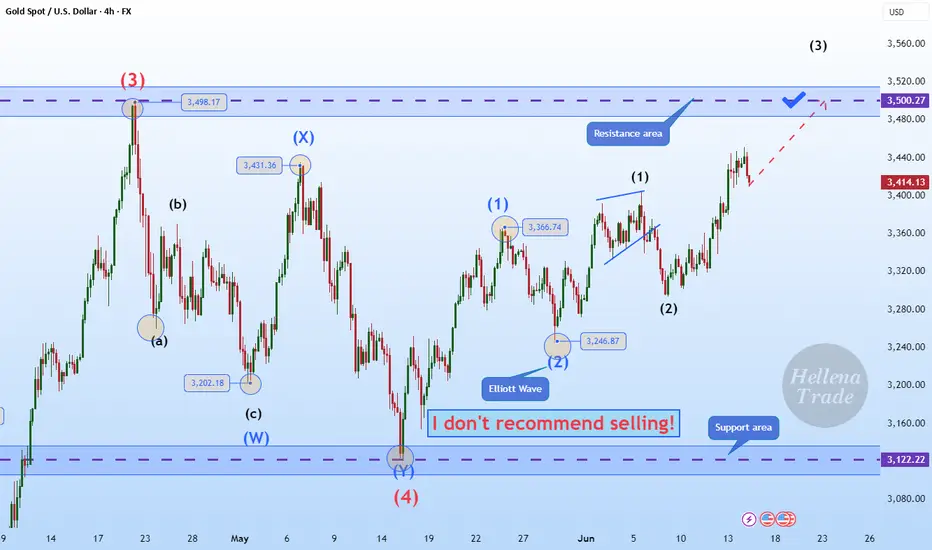
Hellena | GOLD (4H): LONG to resistance area of 3500.Colleagues, I believe that, as with the euro, the upward five-wave impulse is not yet over. At the moment, I see the formation of wave “3” of the lower order and wave ‘3’ of the middle order, which means that the upward movement will continue at least to the resistance area of 3500 — this is the max
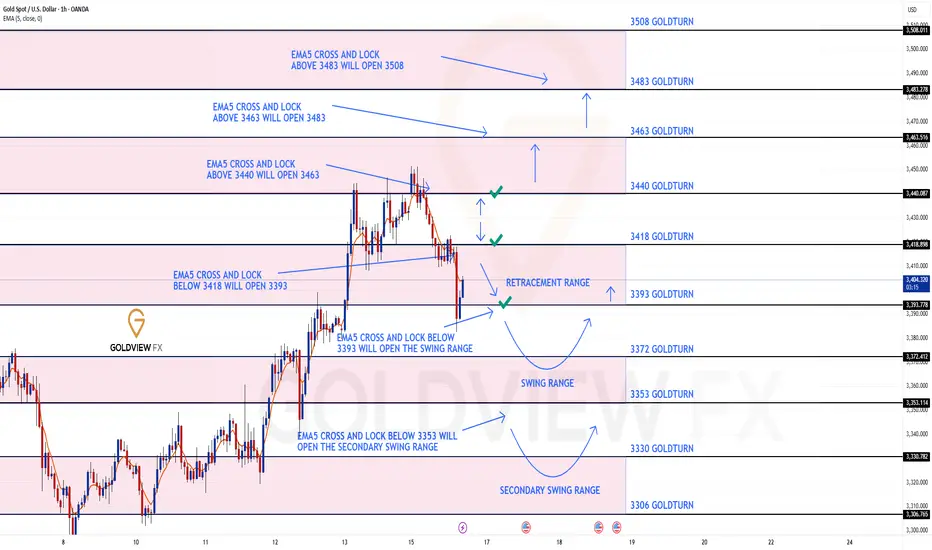
GOLD ROUTE MAP UPDATEHey Everyone,
Great start to the week with our chart idea playing out to perfection once again!!
We started with our Bullish target at 3440 hit followed with no ema5 cross and lock confirming the perfect rejection, showcasing the accuracy of our levels. This rejection went onto hitting our Bearish
HelenP. I Gold may correct to support zone and then rebound upHi folks today I'm prepared for you Gold analytics. After rebounding from the trend line, XAUUSD began to grow steadily within the rising structure, confidently pushing through local resistance and breaking above the previous support 2 area. This breakout was backed by strong bullish momentum, with
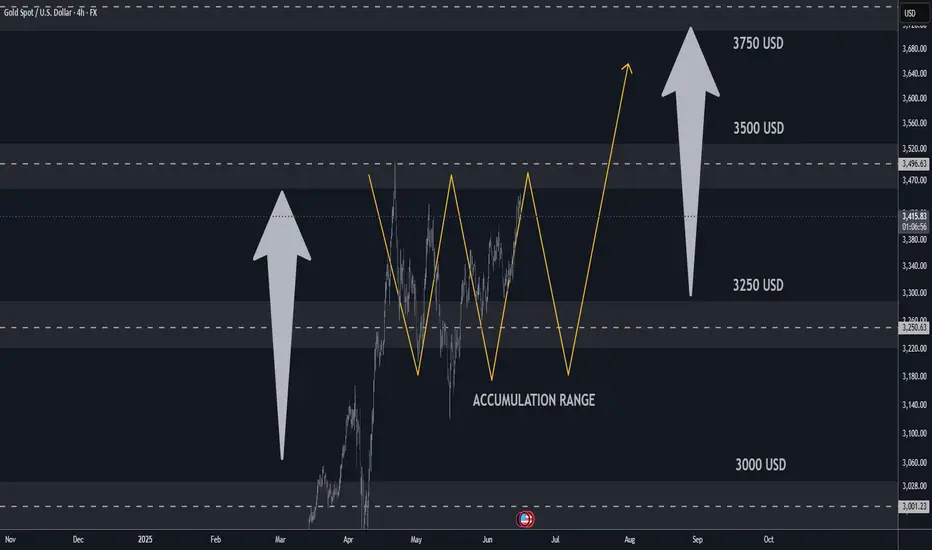
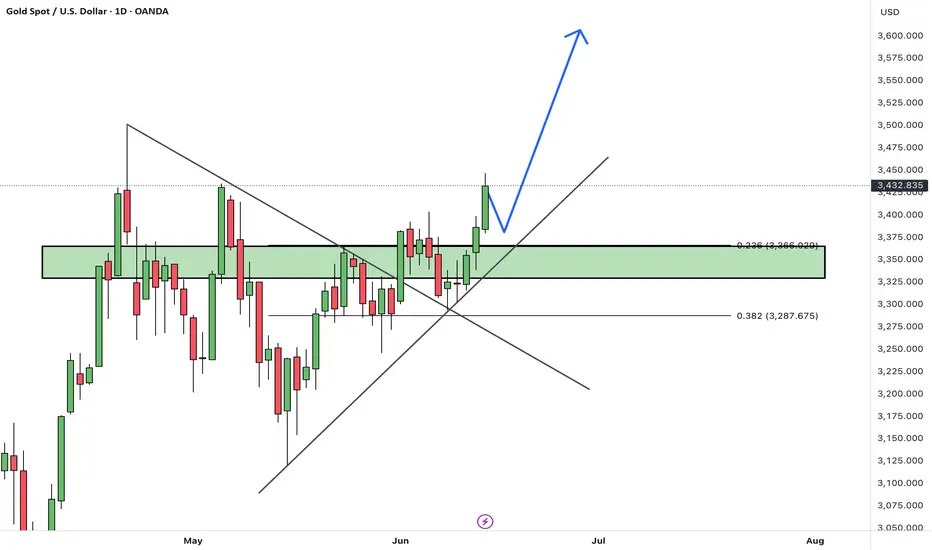
GOLD H4 Update: Bulls will target 3600/3750 USD Market Update🏆 Gold Market Mid-Term Update (June 16, 2025)
📊 Price & Technical Outlook
Current Spot Price: around $3,414
Technical Setup
* Gold consolidating above major support at \~\$3,180–3,200
* Testing resistance at \~\$3,380–3,400; breakout could push toward \$3,600
* Recent price action conside
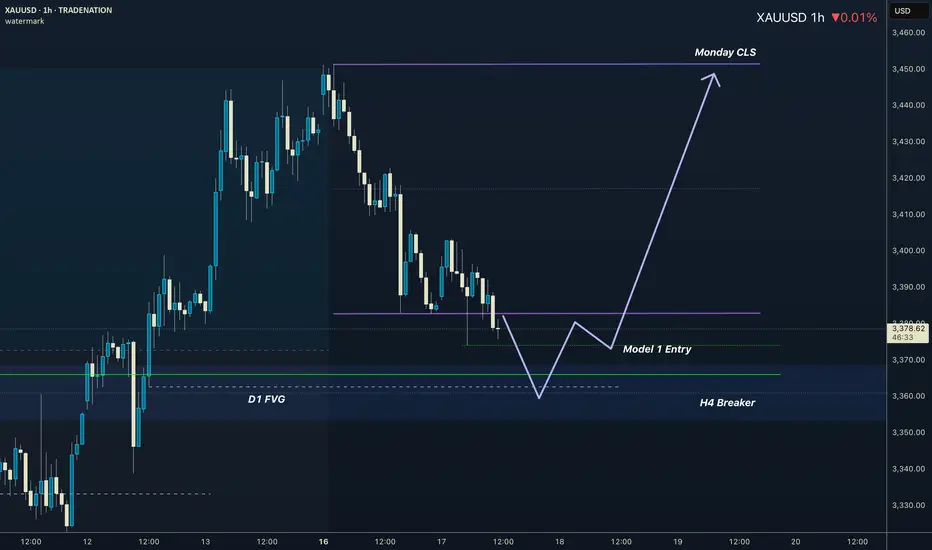
GOLD I Monday CLS I KL - OB/FVG I Target Monday CLS HighsHey, Market Warriors, here is another outlook on this instrument
If you’ve been following me, you already know every setup you see is built around a CLS Footprint, a Key Level, Liquidity and a specific execution model.
If you haven't followed me yet, start now.
My trading system is completely
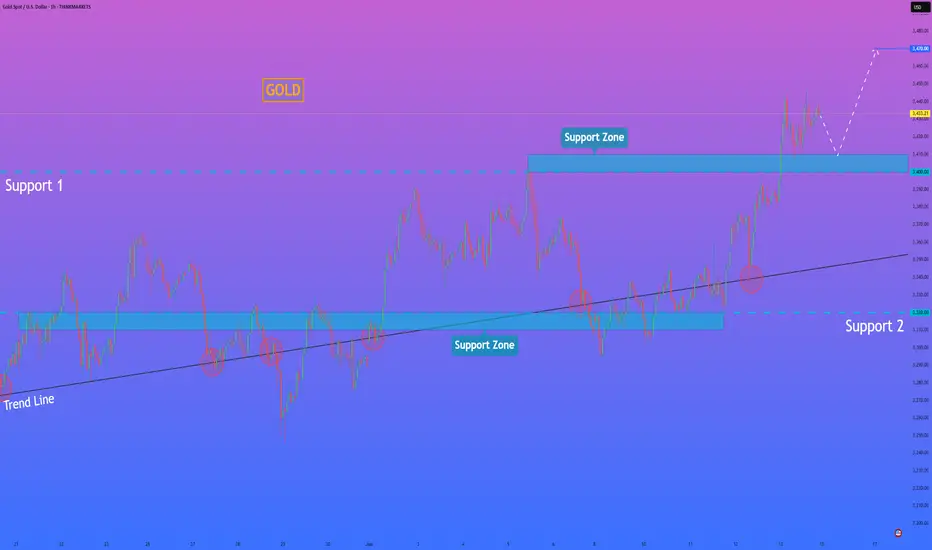
XAUUSD Hello Traders! 👋
What are your thoughts on GOLD?
Gold has broken above a major resistance level, and price has closed firmly above this zone, signaling strong bullish momentum and a shift in market sentiment.
We expect a brief pullback in the short term, followed by a resumption of the upward mov
GOLD - Price will bounce from support area and start to growHi guys, this is my overview for XAUUSD, feel free to check it and write your feedback in comments👊
Some days ago price declined to $3220 level and then started to grow, and soon reached $3380 level and even broke it.
Then price started to trades inside wedge, where it at once started to decline a
See all futures ideas
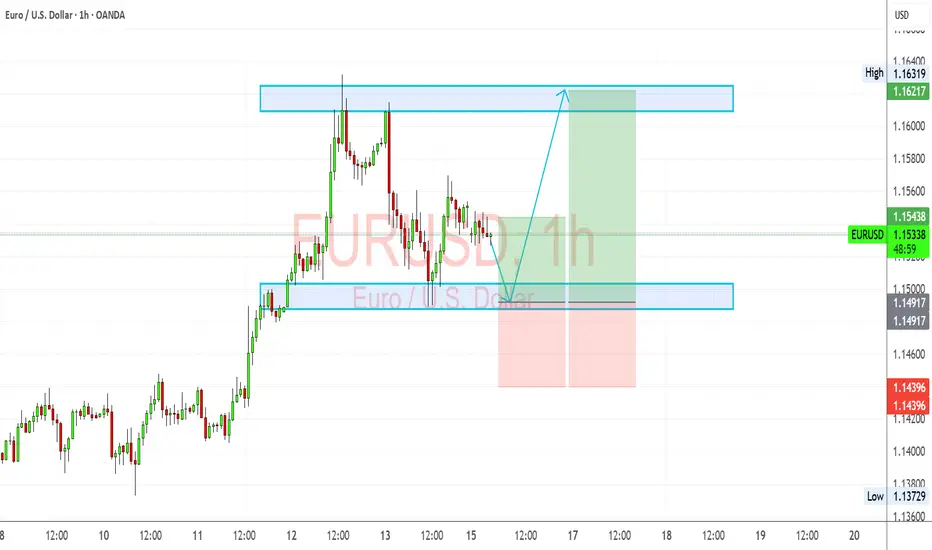
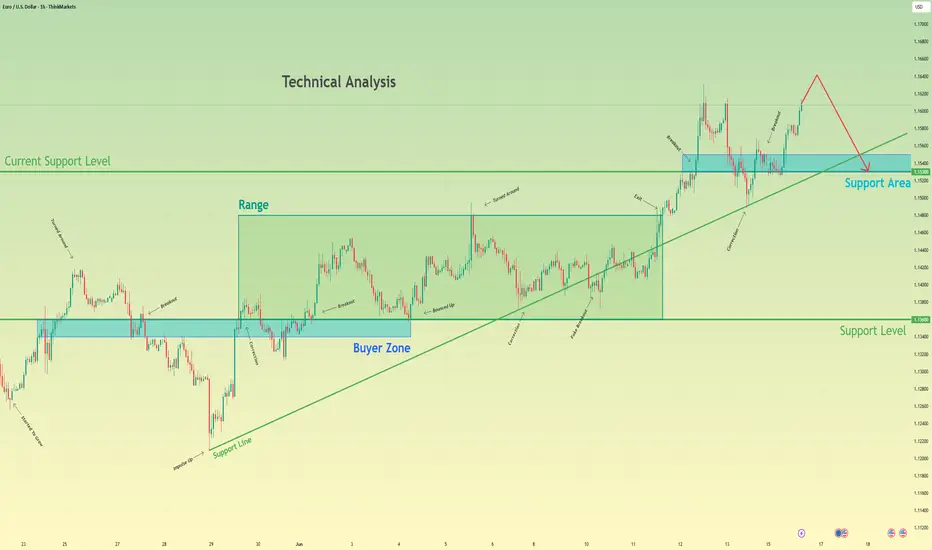
EURUSD Long Setup – Bullish Rejection from Demand ZoneEURUSD remains supported by strong eurozone fundamentals and broad USD softness. The pair has retraced into a key demand zone around 1.1490 and is showing signs of bullish rejection. With the Fed likely to pause further rate hikes and the ECB maintaining a steady tone, the bias favors further upside
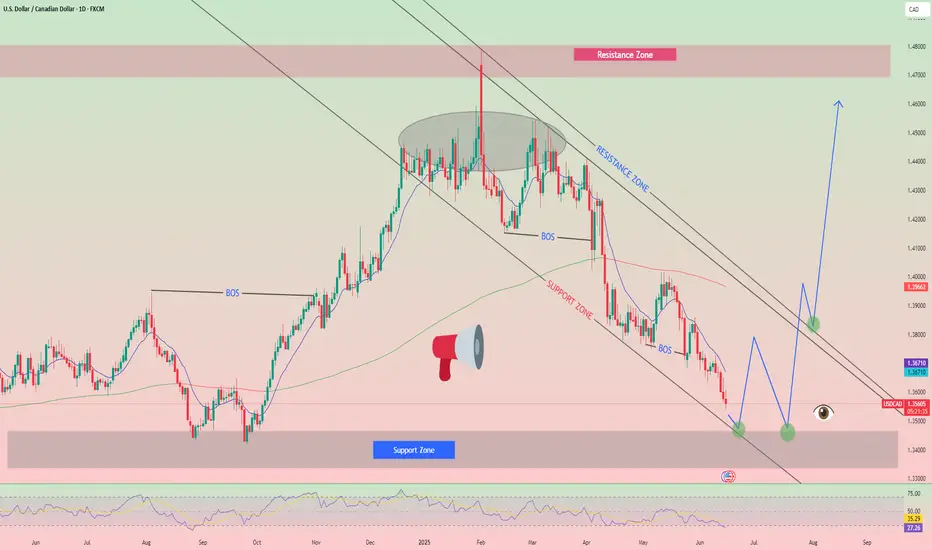
Israel-Iran Confrontation. (I expect upward movement in USD/CADIsrael and Iran are exchanging missile strikes, but it seems markets are trying to play their own game, assuming that this conflict will not cross the nuclear threshold. in the meantime, investors are shifting their focus to key events this week.
The main highlights will be the consumer inflation r
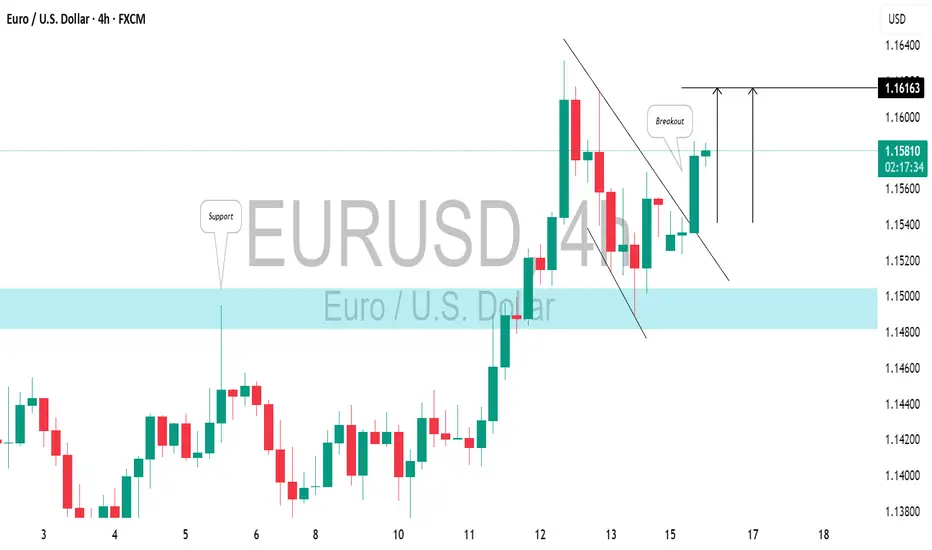
EURUSD: Bullish Move After BreakoutThe price action on EURUSD shows that it broke through a horizontal resistance level on the 4-hour chart.
Following the breakout, a local correction occurred, forming a bullish flag pattern.
As the NY session opened, the market rose and surpassed its resistance line, indicating a strong likeliho
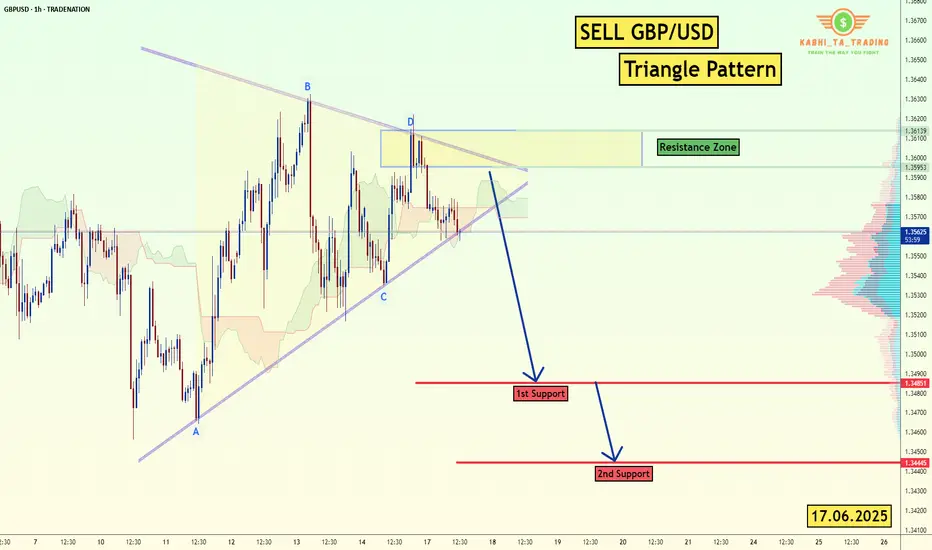
GBP/USD - H1-Triangle Breakout (17.06.2025)The GBP/USD Pair on the H1 timeframe presents a Potential Selling Opportunity due to a recent Formation of a Triangle Breakout Pattern. This suggests a shift in momentum towards the downside in the coming hours.
Possible Short Trade:
Entry: Consider Entering A Short Position around Trendline O
AUDJPY Potential UpsidesHey Traders, in today's trading session we are monitoring AUDJPY for a buying opportunity around 93.600 zone, AUDJPY is trading in an uptrend and currently is in a correction phase in which it is approaching the trend at 93.600 support and resistance area.
Trade safe, Joe.

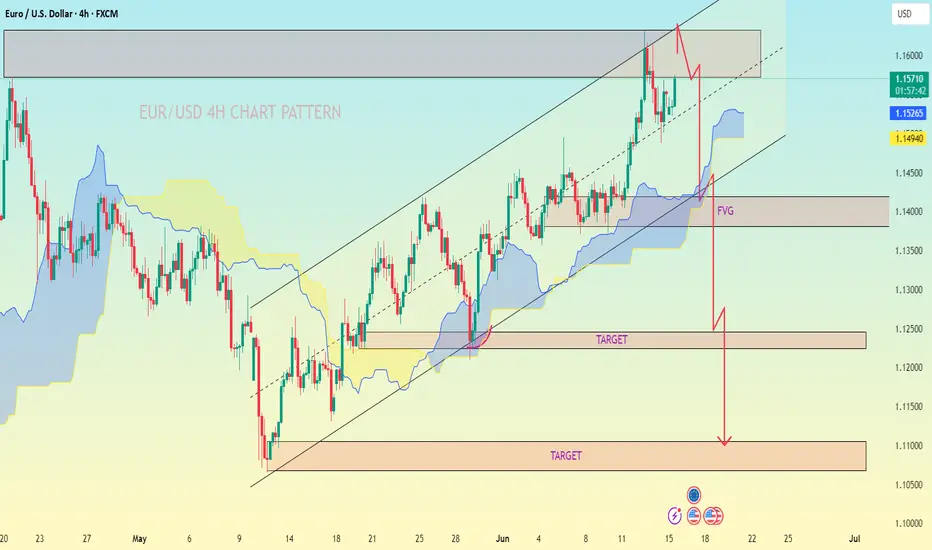
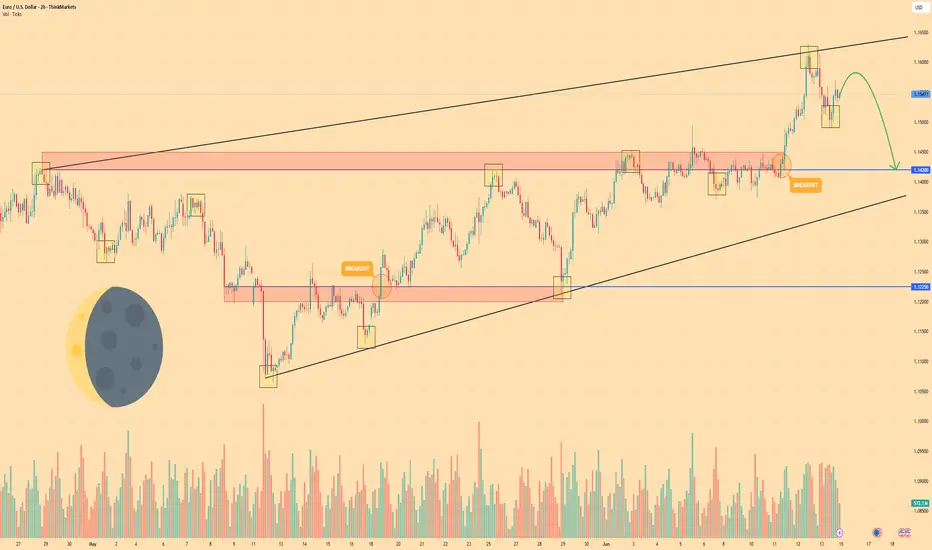
EUR/USD 4H CHART PATTERN.EUR/USD 4H chart, the chart analysis shows a bearish outlook after a potential rising channel breakdown. Here are the key bearish targets as shown:
---
📉 Bearish Targets:
1. First Target Zone (FVG Area)
Price Range: Around 1.1400 – 1.1350
This is marked as the Fair Value Gap (FVG) and could ac
Euro can turn around and start to fall to support areaHello traders, I want share with you my opinion about Euro. Observing this chart, we can see how the price earlier dropped toward the 1.1360 support level and successfully broke it. Then we saw a short recovery move, but the price once again returned to the downside and retested the support line fro
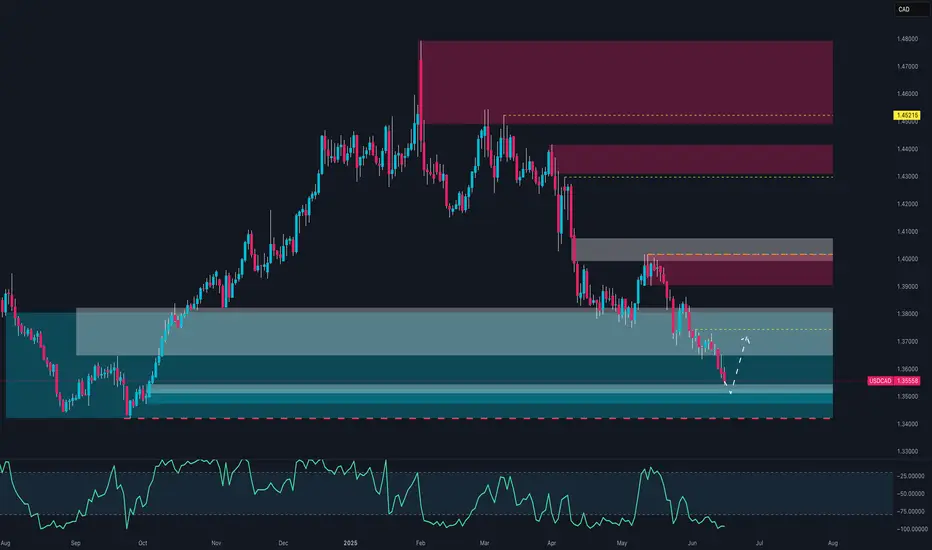
Smart Money Just Flipped Bearish on USD/CAD. Are You Still Long?🧠 1. COT Context & Institutional Flows
🇨🇦 CAD COT Report (CME) – June 10, 2025
Non-Commercials (speculators): net short 93,143 contracts (19,651 long vs. 112,794 short), with a short reduction of -14,319 → early bearish unwinding.
Commercials: net long 91,207 contracts (223,285 long vs. 132,078 s
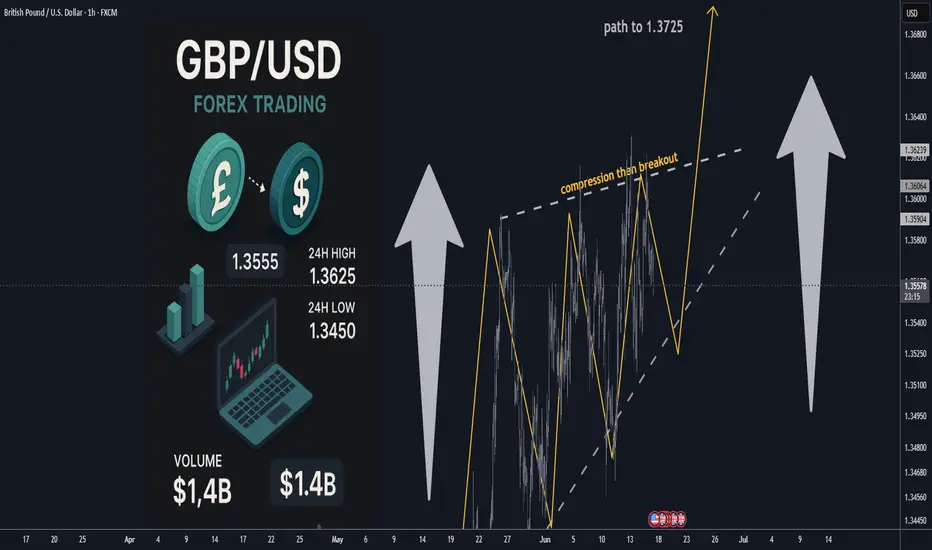
GBPUSD H1 compression BUY/HOLD TP1 +100 TP2 +200 pips low risk🏆 GBPUSD Market Update
📊 Technical Outlook
Short-term: BULLS active; resistance forming mid‑1.3600s, consolidation below 1.3600s
Mid-term: Neutral to slight bullish bias; bulls seek 1.3600–1.3700/1.3730 zone
Status: Narrow trading range (tight band) ahead of key UK CPI, Fed & BoE meetings
🔥 Lates
EURO - Pirce can make movement up and then drop to $1.1420Hi guys, this is my overview for EURUSD, feel free to check it and write your feedback in comments👊
After entering the wedge, Euro began to slow down, creating a tightening structure between support and resistance.
Price corrected toward the support line of the wedge, where it briefly paused and b
See all forex ideas
| - | - | - | - | - | - | - | ||
| - | - | - | - | - | - | - | ||
| - | - | - | - | - | - | - | ||
| - | - | - | - | - | - | - | ||
| - | - | - | - | - | - | - | ||
| - | - | - | - | - | - | - | ||
| - | - | - | - | - | - | - | ||
| - | - | - | - | - | - | - |
Trade directly on the supercharts through our supported, fully-verified and user-reviewed brokers.


