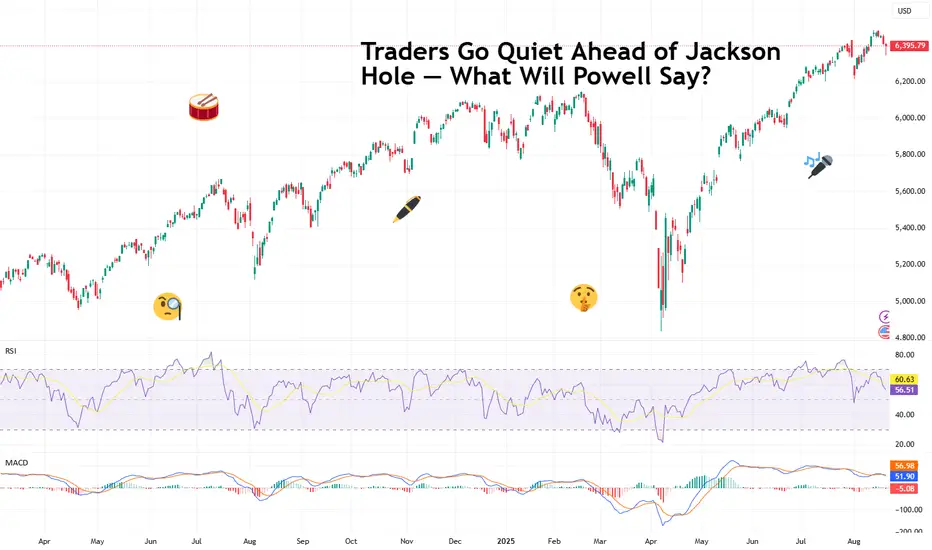
Traders Go Quiet Ahead of Jackson Hole — What Will Powell Say?Markets have been eerily quiet this week. Not because traders suddenly discovered meditation, but because everyone is waiting for one man in Wyoming to make things move.
Federal Reserve Chair Jerome Powell, the man who moves markets with a simple “Good afternoon,” is about to step onto the stage at

The best trades require research, then commitment.
Get started for free$0 forever, no credit card needed

Scott "Kidd" PoteetThe unlikely astronaut

Where the world does markets
Join 100 million traders and investors taking the future into their own hands.
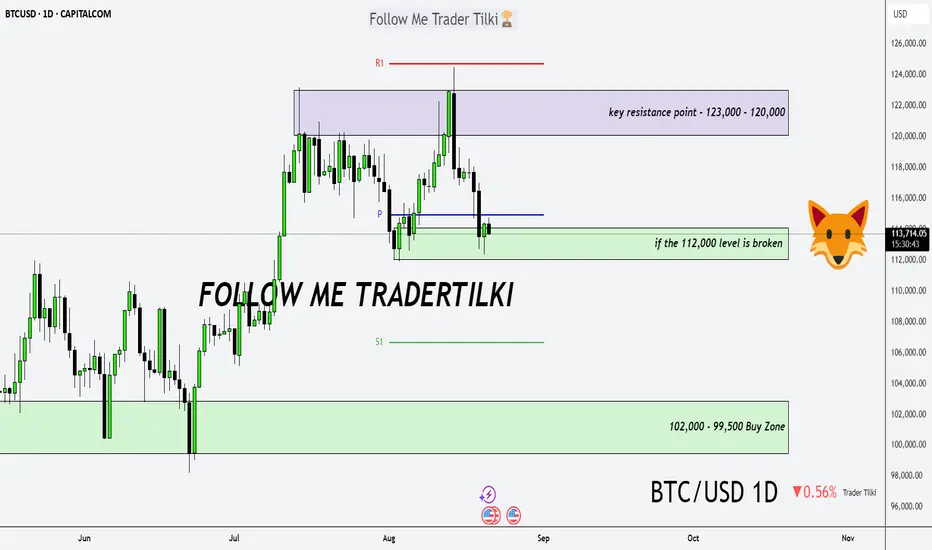
Bitcoin Daily Analysis – The Trend Is Our FriendGood morning, Guys,
I’ve prepared a fresh Bitcoin analysis for you.
🔹 First off, I stand firmly behind my long-term targets of **127,000 – 137,000 – 146,000**. I previously shared these levels with you in a weekly analysis.
🔍 Now let’s shift to the 1-day chart:
What is Bitcoin telling us righ
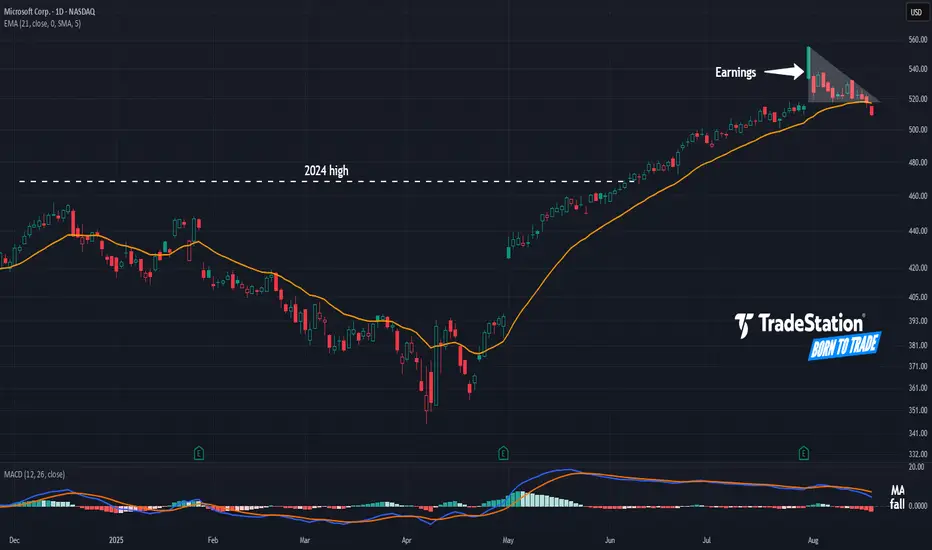
Is the AI Trade Done for Now?AI has been a dominant theme for months, but some traders may think the robots are getting tired.
Today’s idea highlights a few key stocks in the technology sector associated with the trend.
First is Microsoft, which jumped on July 31 after strong results but failed to hold. It subsequently made a
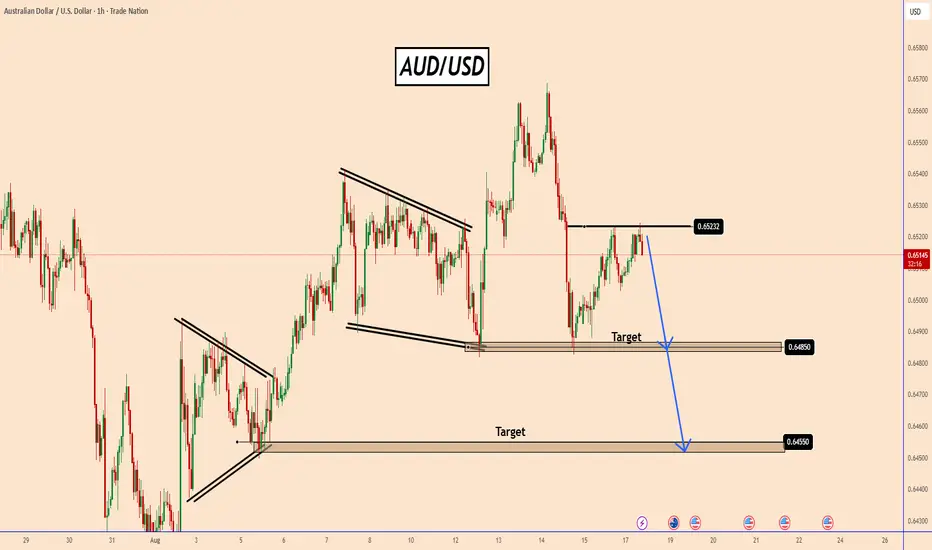
AUDUSD Reversal Risk as Buying Power WeakensAUDUSD Reversal Risk as Buying Power Weakens
In recent days, AUDUSD has shown upward momentum, but buying pressure appears to be waning.
The pair has slipped from 0.6570 to 0.6480 without any clear fundamental catalyst, suggesting a potential loss of bullish steam.
Currently, price action seems
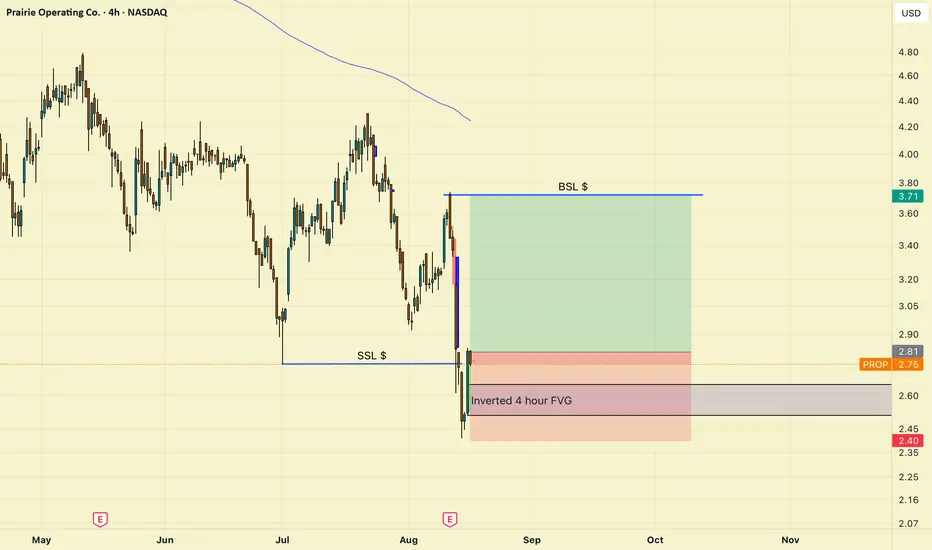
My favorite set up Looks like this company got beat up after earning. I dont pay much attention to news but from what I can see is a bunch of people complaining about this stock being undervalued and beaten up.
Well this is where I just come in and look for an entry model.
Now this is a dangerous trade… because of
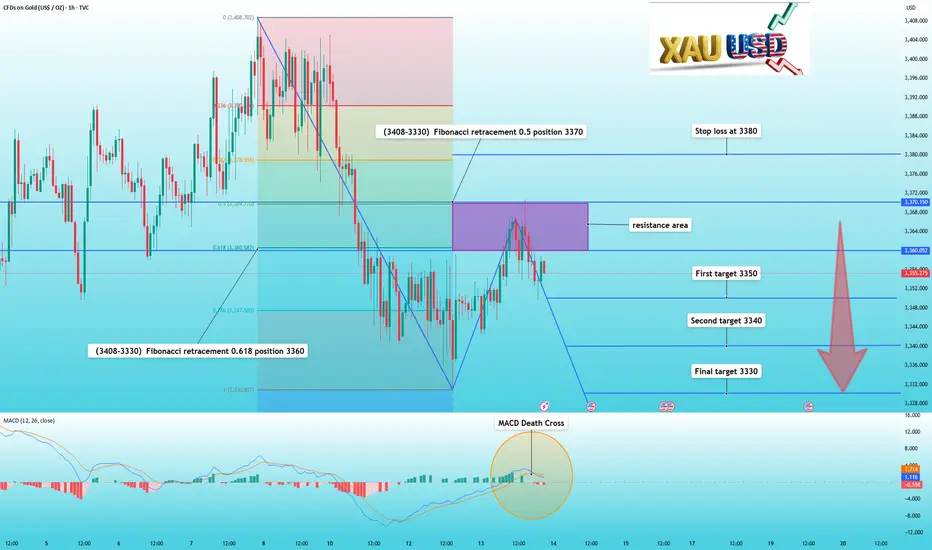
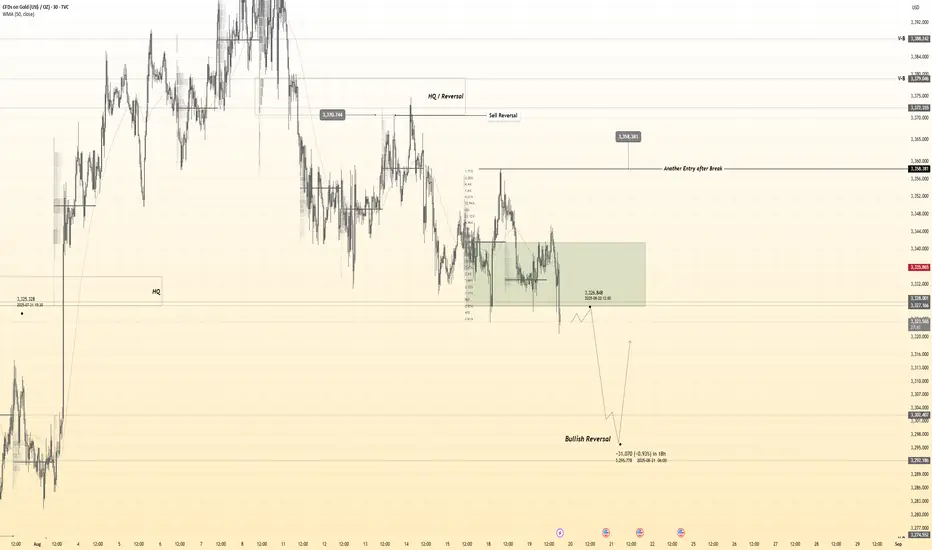
Gold pulls back as expected, you can continue to sellIn my previous trading strategy, I reiterated my view that gold prices would continue to fall if they couldn't break through 3370 in the short term.
And indeed, gold's performance behaved as expected. After hitting 3370, it fell again, reaching a low of 3350.
Technically, the current correction in
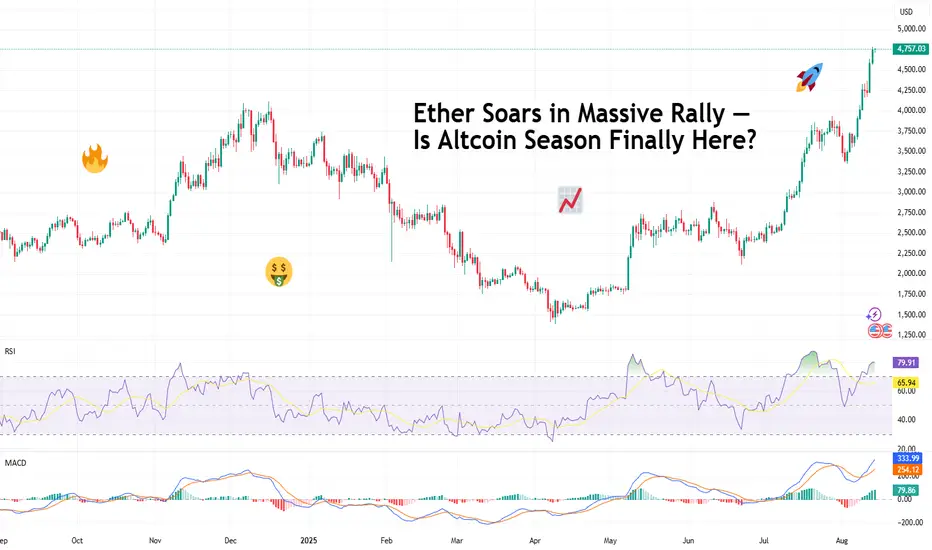
Ether Soars in Massive Rally — Is Altcoin Season Finally Here?Bitcoin who? Move over, orange coin. It's the alt season and Ethereum and its crew of alternatives are here to party.
🚀 Ether Edges Toward All-Time High
Ethereum BITSTAMP:ETHUSD is all the game in crypto town right now. Prices climbed another 3% early Thursday, cruising past $4,750 and now ju
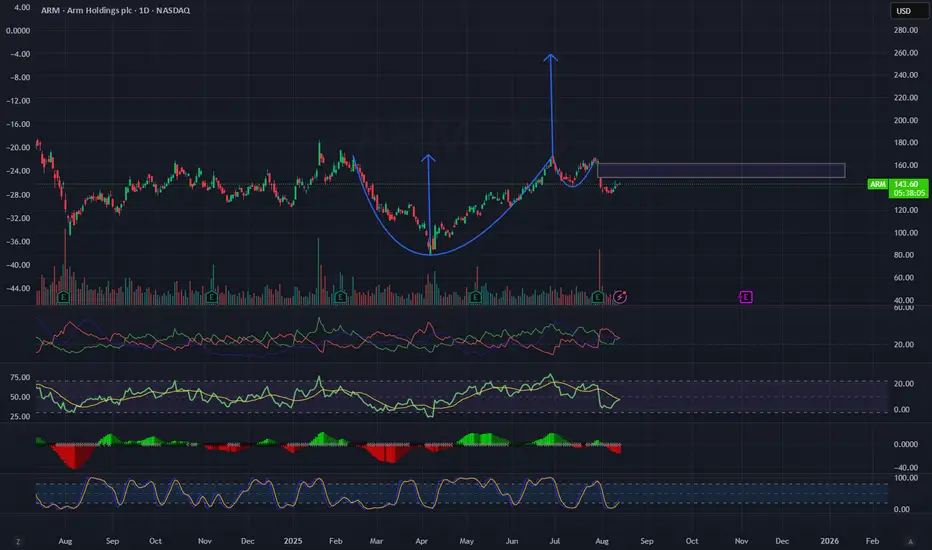
ARM – Cup & Handle Pattern with Potential BreakoutOn ARM’s daily chart, we can see a clear Cup & Handle pattern – twice in a row – with strong upward moves following each completion.
The latest pattern completed around the $165 area, after which the stock pulled back into a healthy correction and is now consolidating in the $140–$150 range.
Techni
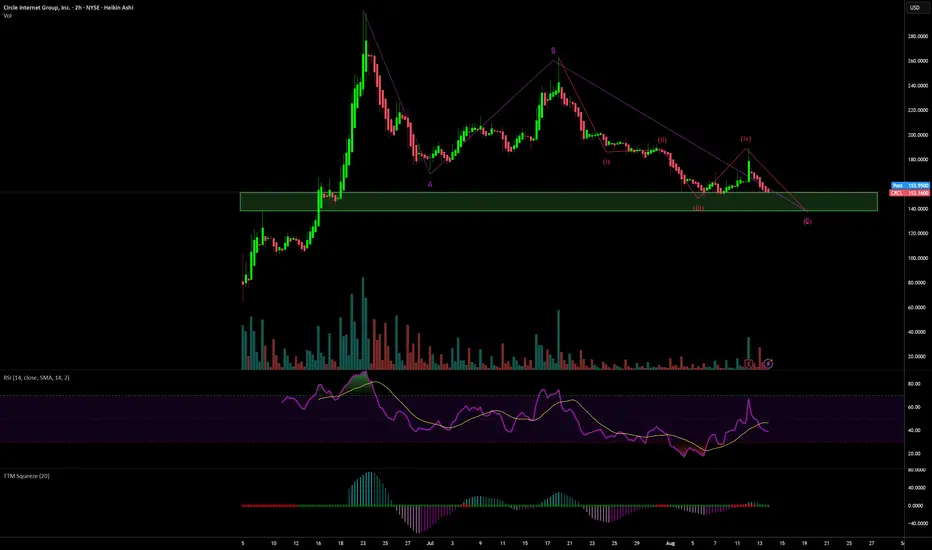
Circle buying opportunity. Bullish chartWith the announcement of the new stock release, more selling should come. I see limit entries of 139 and 144 to be ideal. Overall pattern is 4th wave correction IMO. Target at least double top in short term and much higher long term. People smarter than me would put stop losses under those targ
Cable & Fibre!So, generally I'm happy with the way the market is going. Though a little bit uncertain about how high it wants to go before it resumes its downward spiral, things are going good so far.
Looking at Cable, on an hourly chart, we see that between 06:00 am and 08:00 am (New York Time), there is FVG fo

See all editors' picks ideas
Volume Rotor Clock [hapharmonic]🕰️ Volume Rotor Clock
The Volume Rotor Clock is an indicator that separates buy and sell volume, compiling these volumes over a recent number of bars or a specified past period, as defined by the user. This helps to reveal accumulation (buying) or distribution (selling) behavior, showing which si

Prime NumbersPrime Numbers highlights prime numbers (no surprise there 😅), tokens and the recent "active" feature in "input".
🔸 CONCEPTS
🔹 What are Prime Numbers?
A prime number (or a prime) is a natural number greater than 1 that is not a product of two smaller natural numbers.
Wikipedia: Prime n

Angle Market Structure [BigBeluga]🔵 OVERVIEW
Angle Market Structure is a smart pivot-based tool that dynamically adapts to price action by accelerating breakout and breakdown detection. It draws market structure levels based on pivot highs/lows and gradually adjusts those levels closer to price using an angle threshold. Upon bre

Dynamic Swing Anchored VWAP (Zeiierman)█ Overview
Dynamic Swing Anchored VWAP (Zeiierman) is a price–volume tool that anchors VWAP at fresh swing highs/lows and then adapts its responsiveness as conditions change. Instead of one static VWAP that drifts away over time, this indicator re-anchors at meaningful structure points (swings).

Trading Holidays and Expiry CalendarTrading Holiday and Expiry Calendar
This indicator displays calendar for current and next 2 months. Calendar marks ‘CRITICAL DAYS’ on the calendar.
‘CRITICAL DAYS’:
Trading Days
Trading Holidays
Weekends
Expiry Days
Out of these ‘Expiry Days’ are marked based on User input and rest of

Drawdown Distribution Analysis (DDA) ACADEMIC FOUNDATION AND RESEARCH BACKGROUND
The Drawdown Distribution Analysis indicator implements quantitative risk management principles, drawing upon decades of academic research in portfolio theory, behavioral finance, and statistical risk modeling. This tool provides risk assessment capabilit

FunctionADFLibrary "FunctionADF"
Augmented Dickey-Fuller test (ADF), The ADF test is a statistical method used to assess whether a time series is stationary – meaning its statistical properties (like mean and variance) do not change over time. A time series with a unit root is considered non-stationary and

Adaptive Market Profile – Auto Detect & Dynamic Activity ZonesAdaptive Market Profile is an advanced indicator that automatically detects and displays the most relevant trend channel and market profile for any asset and timeframe. Unlike standard regression channel tools, this script uses a fully adaptive approach to identify the optimal period, providing you

Trading Report Generator from CSVMany people use the Trading Panel. Unfortunately, it doesn't have a Performance Report. However, TradingView has strategies, and they have a Performance Report :-D
What if we combine the first and second? It's easy!
This script is a special strategy that parses transactions in csv format from Paper

Smart Money Breakout Channels [AlgoAlpha]🟠 OVERVIEW
This script draws breakout detection zones called “Smart Money Breakout Channels” based on volatility-normalized price movement and visualizes them as dynamic boxes with volume overlays. It identifies temporary accumulation or distribution ranges using a custom normalized volatility me

See all indicators and strategies
Community trends
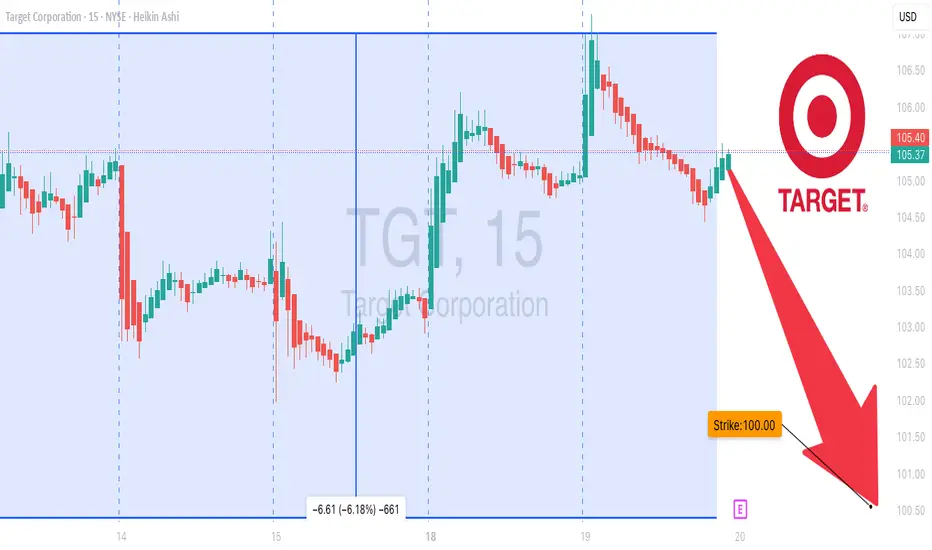
TGT Earnings Play: Strong Bearish Setup – $100 Put🛒💥 TGT Earnings Alert – $100 Put (Aug 22, 2025) 🚨🔥
Earnings Snapshot
📉 Revenue Momentum: -2.8% TTM ❌
📊 Margins: Profit margin 4.0%, Gross margin 28.1% ⚠️
📈 Forward EPS Growth: 15.5% (aggressive) 💡
💵 Debt-to-Equity: 130.21 ⚖️
🏬 Sector Context: Discretionary retail under pressure, consumers shifting
Is the AI Trade Done for Now?AI has been a dominant theme for months, but some traders may think the robots are getting tired.
Today’s idea highlights a few key stocks in the technology sector associated with the trend.
First is Microsoft, which jumped on July 31 after strong results but failed to hold. It subsequently made a
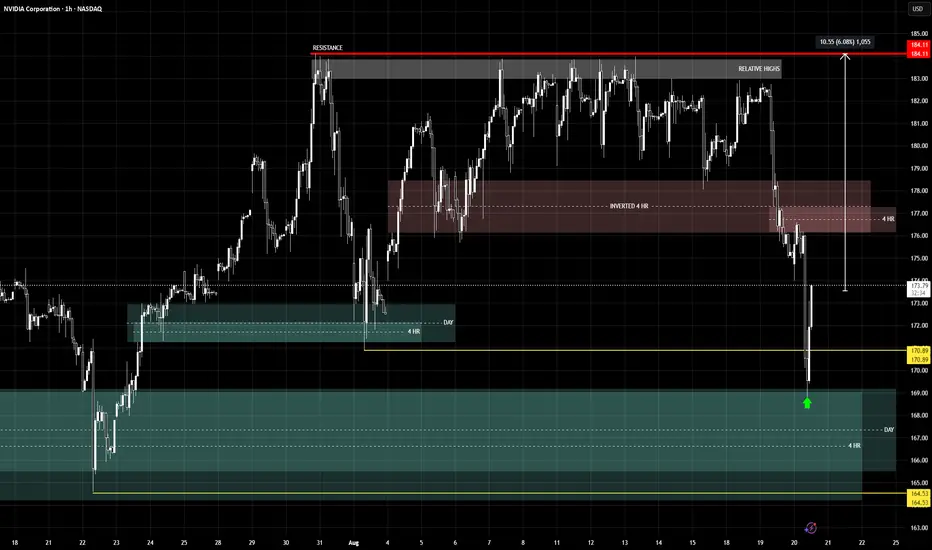
NVDAEVENTS:
1. Relative highs avoided (from July 30 to August 19)
2. Price swept low of August 1 (8% retrace of ATH)
3. Bullish reaction (wick up) from bullish day & 4hr gap
OBJECTIVE:
To Break all time high (ATH)
HISTORY:
Previously, on April 7 2025, price swept low of August 5 2024 (40% retrace o
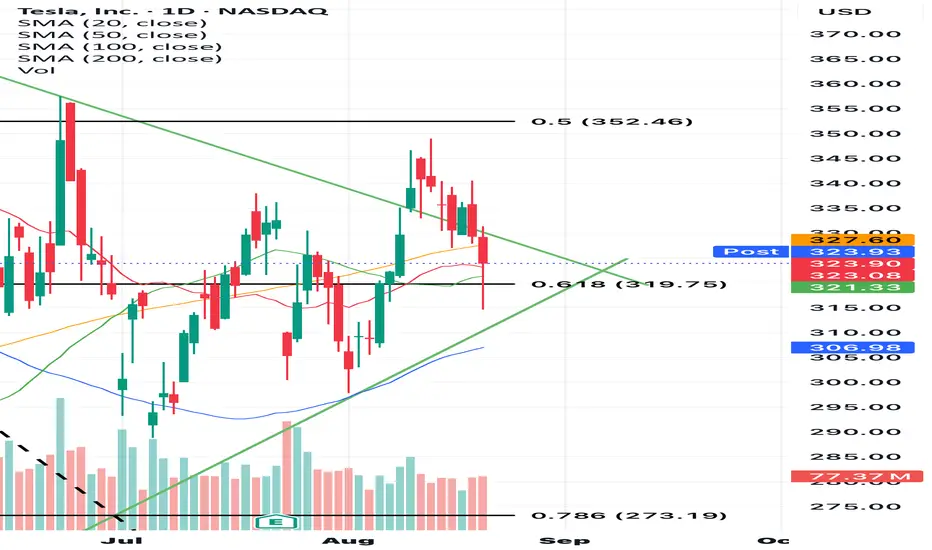
TESLA is going to rise to 420$Based on my analysis, TSLA is going to reach to 420$ from almost 330$.
This is based on the trend that TSLA broke. It broke it upwards, then, retested the price again, and it will soon go up to 360$ after that it will reach 380$ then nothing will stop it until 420$.
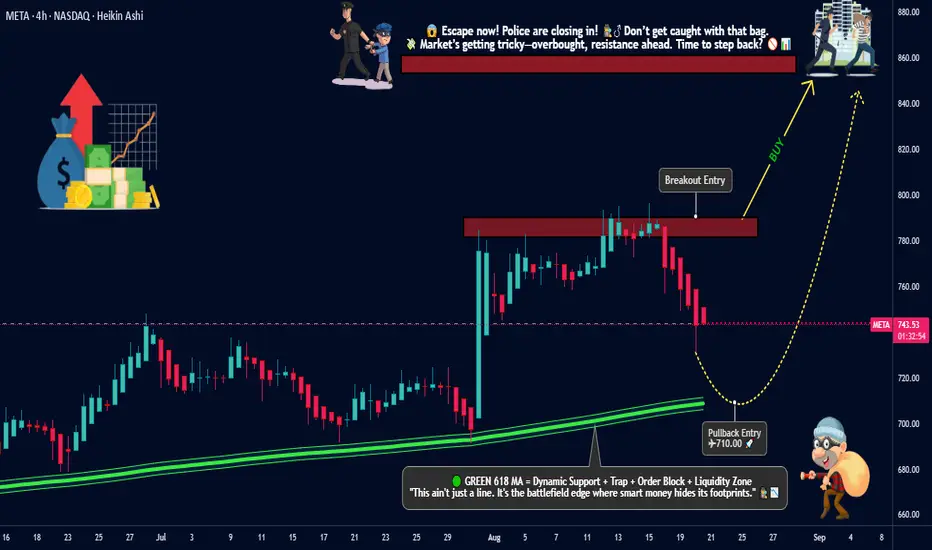
META Platforms Inc. Heist: Breakout Loot vs Pullback Entry🚨META Platforms Inc. Stock Heist Plan🚨
💎Asset: META Platforms Inc. (Swing Trade Robbery)
💎Plan: Bullish Break-In
📈 Breakout Entry: 790.00 (Vault Door Break)
📉 Pullback Entry: 710.00+ (Sweet Spot for the Thieves)
🔑 Any perfect pullback after 710.00, OG thieves may layer orders at chosen levels – st
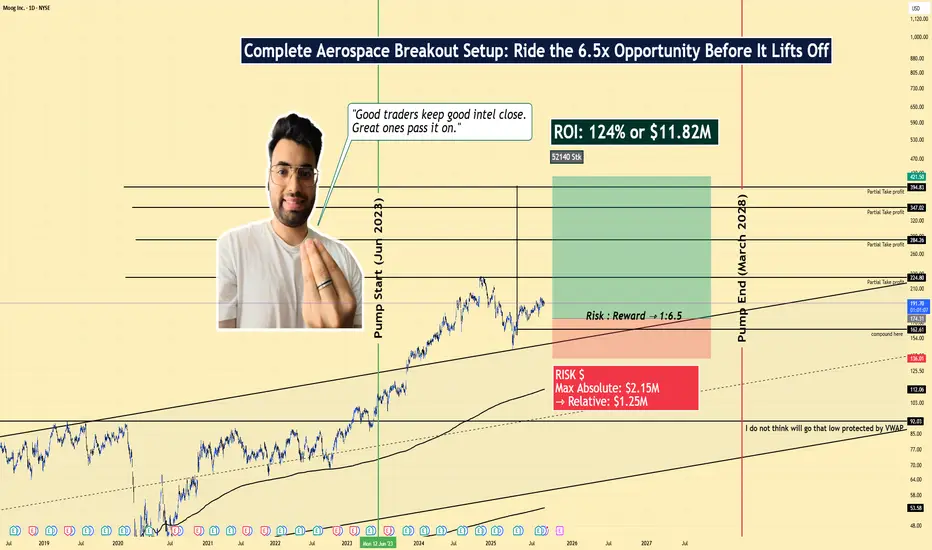
MOG.A | Long Setup | Mid-Cycle Aerospace | Aug 20, 2025📌 MOG.A | Long Setup | Mid-Cycle Aerospace Accumulation Breakout | Aug 20, 2025
🔹 Thesis Summary
Moog Inc. (MOG.A) presents a rare mid-cycle breakout opportunity in the aerospace/defense sector, with strong institutional accumulation since mid-2023 and a clean structural setup offering a 6.5:1 rewa
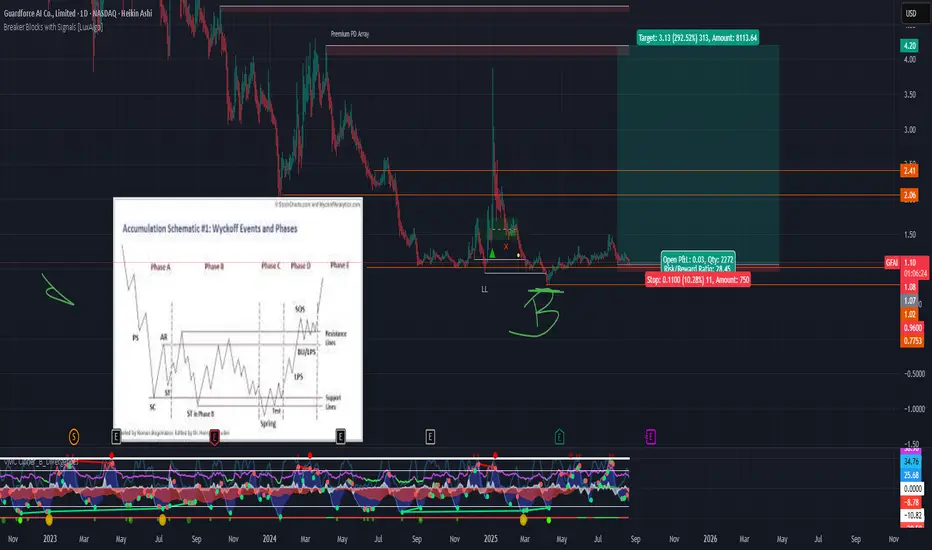
Wick OffI would say its a tipical wick of pattern. I start with the first 20% of position in the lows and I will be adding all the way to resistance where I sell 50% and wait for the bottom where I go more aggressive on the way up . If not I will get stopped .
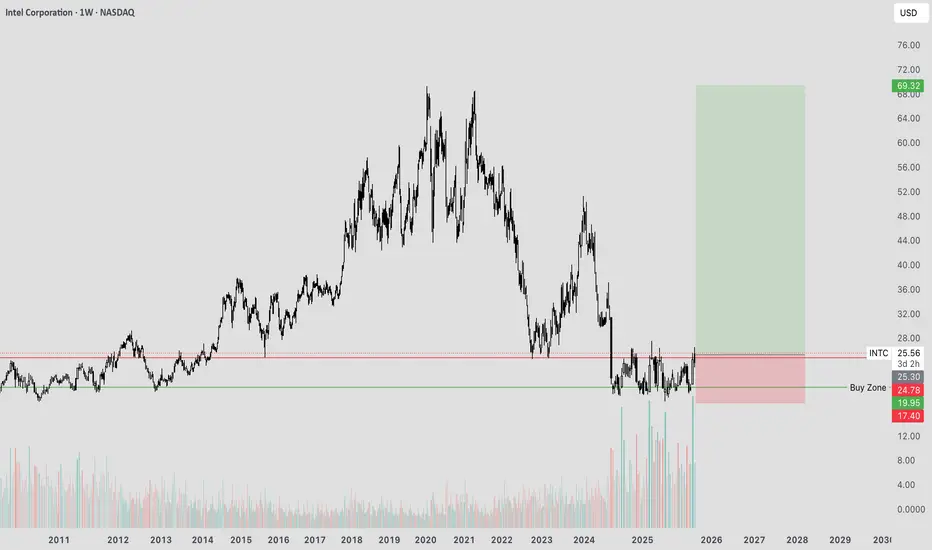
Intel The Next Nvidia? Intel, once synonymous with cutting-edge computing power, has long been recognized for its innovation in processor technology. In the early 2000s and 2010s, the release of Intel’s i5 and i7 chips marked significant milestones in consumer and enterprise computing. These products were benchmarks of pe
Tesla - The triangle is still valid!🚔Tesla ( NASDAQ:TSLA ) remains totally bullish:
🔎Analysis summary:
If we look at the chart of Tesla, we can see a very long term consolidation over the past four years. This, however, does not mean that the bullrun is over but rather preparing for the next bullish move. We just have to wait f

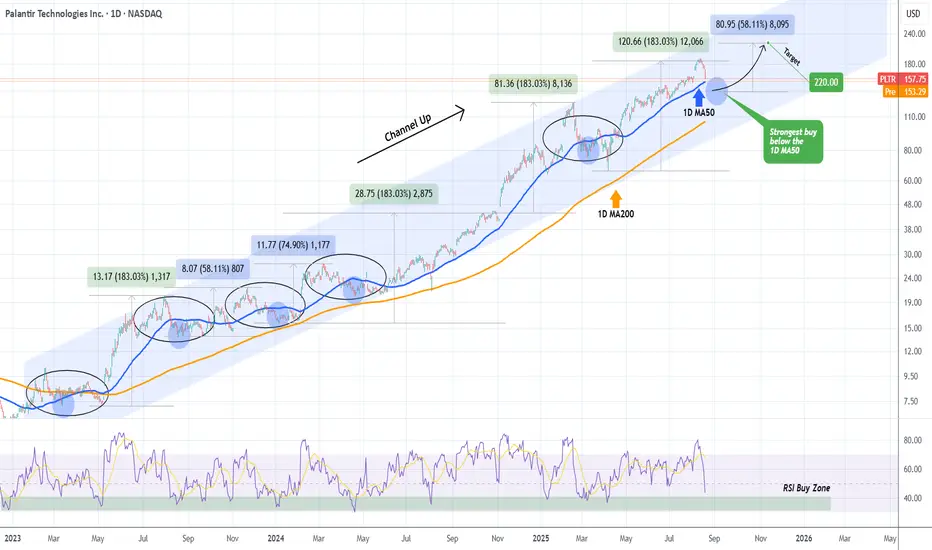
PALANTIR is dropping but below the 1D MA50 lies the best BUYLast time we looked at Palantir (PLTR) was almost 4 months ago (May 06, see chart below), giving a buy signal that gradually but surely hit our $185 Target:
This time, the stock has found itself on a short-term pull-back that is about to hits its 1D MA50 (blue trend-line) for the first time sin
See all stocks ideas
Today
LYTSLSI Industries Inc.
Actual
—
Estimate
0.22
USD
Today
WMTWalmart Inc.
Actual
—
Estimate
0.73
USD
Today
FLFoot Locker, Inc.
Actual
—
Estimate
0.07
USD
Today
PACSPACS Group, Inc.
Actual
—
Estimate
0.39
USD
Today
CATOCato Corporation (The)
Actual
—
Estimate
—
Today
WSMWilliams-Sonoma, Inc.
Actual
—
Estimate
1.78
USD
Today
CODID/B/A Compass Diversified Holdings Shares of Beneficial Interest
Actual
—
Estimate
0.57
USD
Today
GESGuess?, Inc.
Actual
—
Estimate
0.16
USD
See more events
Community trends
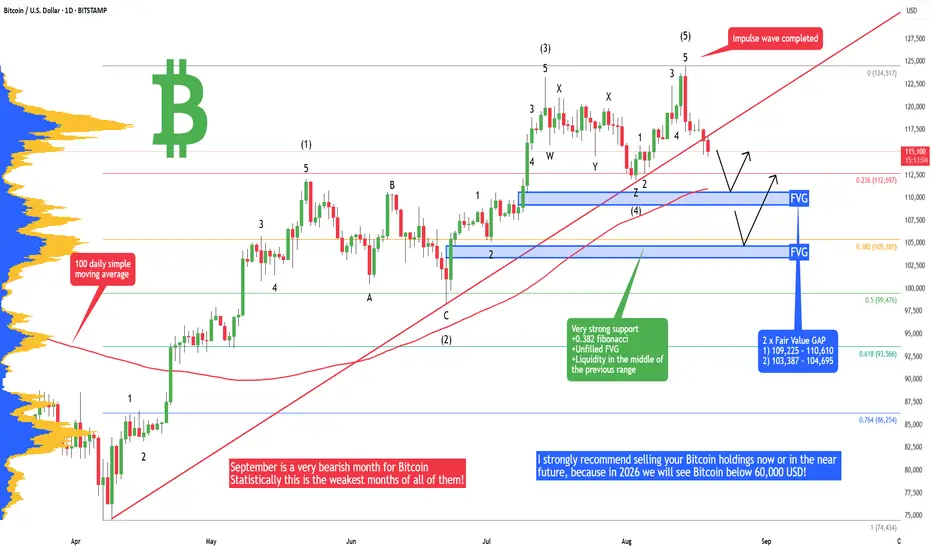
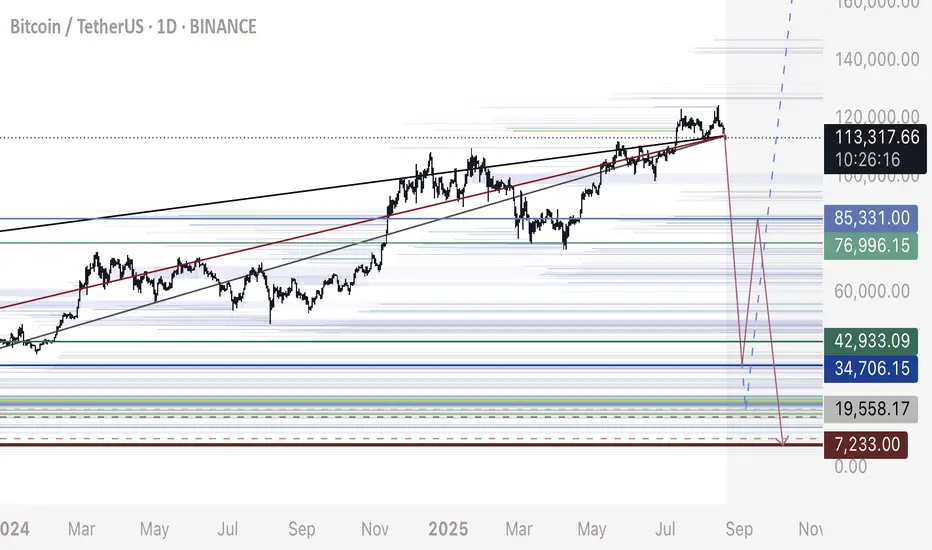
Bitcoin - Avoid BTC at all cost! What is coming will blow you.I strongly recommend selling your Bitcoin holdings now or in the near future, because in 2026 we will see Bitcoin below 60,000 USD! I will tell you why in this analysis.
But first let's look at the local price action on the daily chart and what is going to happen with Bitcoin in the short term. I e
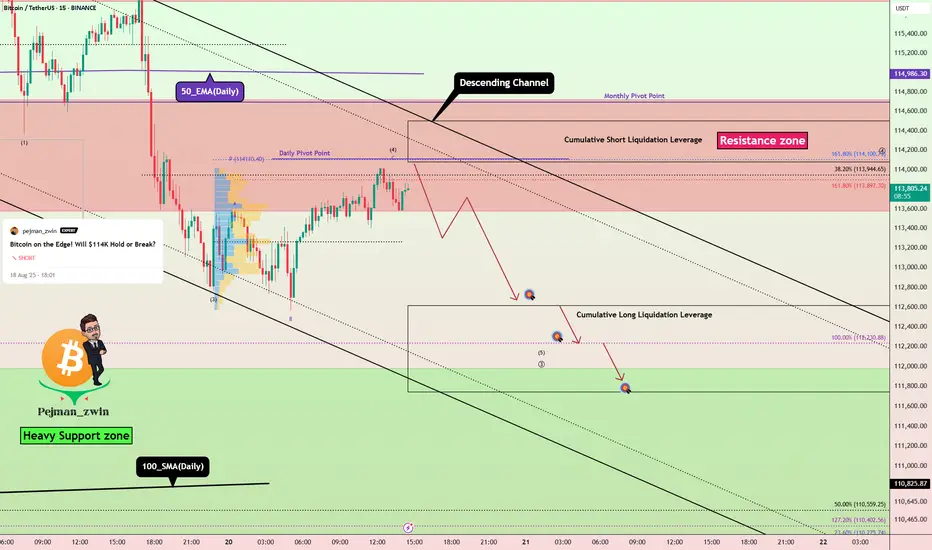
Bitcoin Short Setup _ Short-termBitcoin ( BINANCE:BTCUSDT ) has managed to break the Support zone($114,720-$113,570)/Now=Resistance zone and 50_EMA(Daily) , as I expected in the previous idea . And now it seems that Bitcoin is completing a pullback .
Also, on the 1-hour time frame , if you look closely, Bitcoin seems to
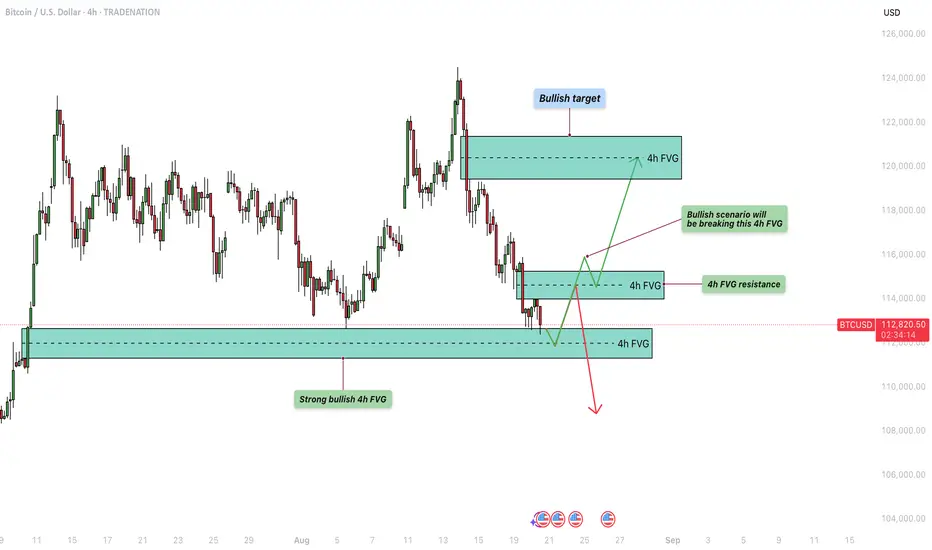
Bitcoin - Can the bulls defend this support?Introduction
After reaching its all-time high, Bitcoin has faced strong rejection, falling from $124.5k down to $113k with notable bearish volume behind the move. On this downward path, several four-hour bearish Fair Value Gaps (FVGs) were left open, signaling areas of inefficiency that the market
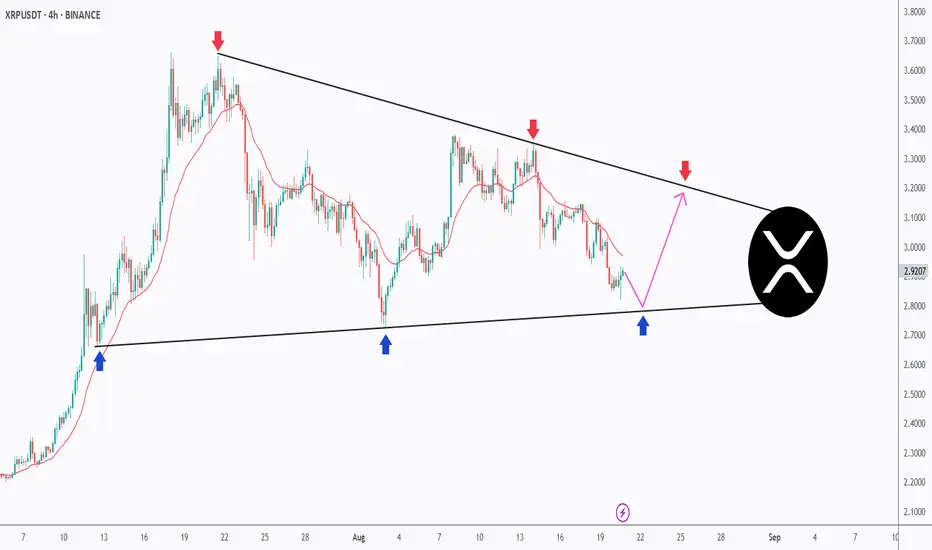
The Perfect Triangle – XRP’s Setup of the Month!XRP has been coiling up inside a textbook symmetrical triangle on the 4H timeframe.
🔻 Sellers are defending the descending trendline (red arrows).
🔹 Buyers keep stepping in at the rising support (blue arrows).
📉 Price is now retesting the lower bound, and as long as this zone holds, we can a
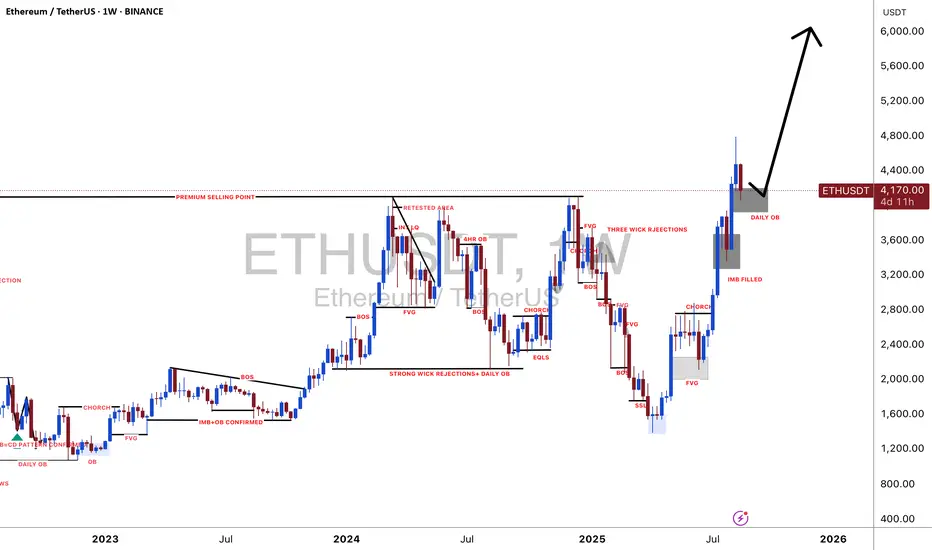
#ETHUSDT: $6000 Is The Next Target!!As we have been predicting since last one year or so, the ETH has reached almost $5000, now we can expect price to continue rising since it already made the correction. Target is $6000 this is swing target. Good luck and trade safe.
Team Setupsfx
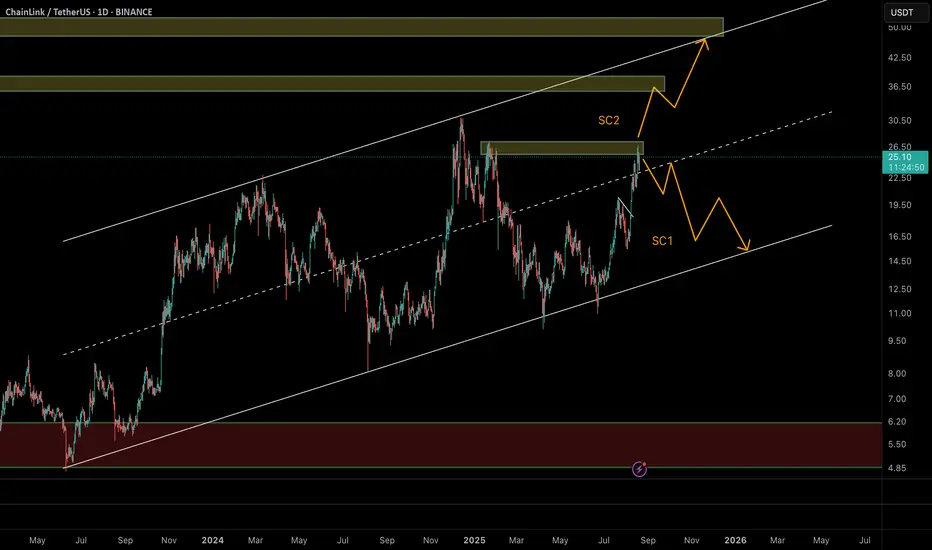
Chainlink (LINK/USDT) – Two Key Scenarios AheadChainlink is currently trading at $24.9, right below a major resistance zone around $27.3. The price has been moving within a long-term ascending channel since mid-2022, and right now it’s at a decisive point.
🔹 Scenario 1 (More Probable – Bearish Rejection)
If LINK fails to break $27.3, we could
Bitcoin, Quick Update · Is The Retrace Over?We are looking at Bitcoin and we are tracking Bitcoin's movements but we trade mainly the altcoins. How Bitcoin behaves affects the altcoins market and how the altcoins market behaves reveals what Bitcoin intends to do next. The chart reveals what is happening and what is about to happen.
Bitcoin p
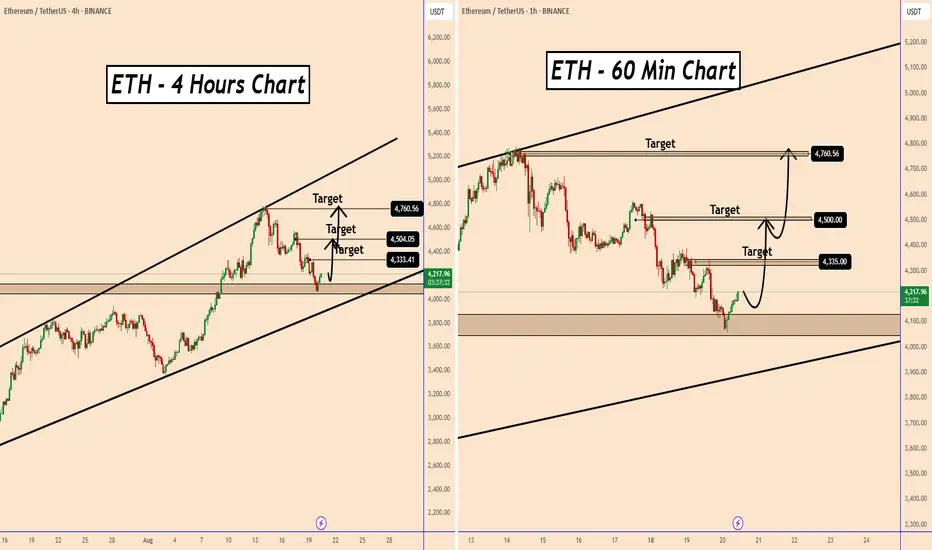
Ethereum Technical OutlookEthereum Technical Outlook
Ethereum remains in a well-defined bullish trend and is currently hovering near the lower boundary of its ascending support zone.
The $4000–$4050 area also aligns with a key structural level from previous price action, increasing the probability of a renewed upward mov
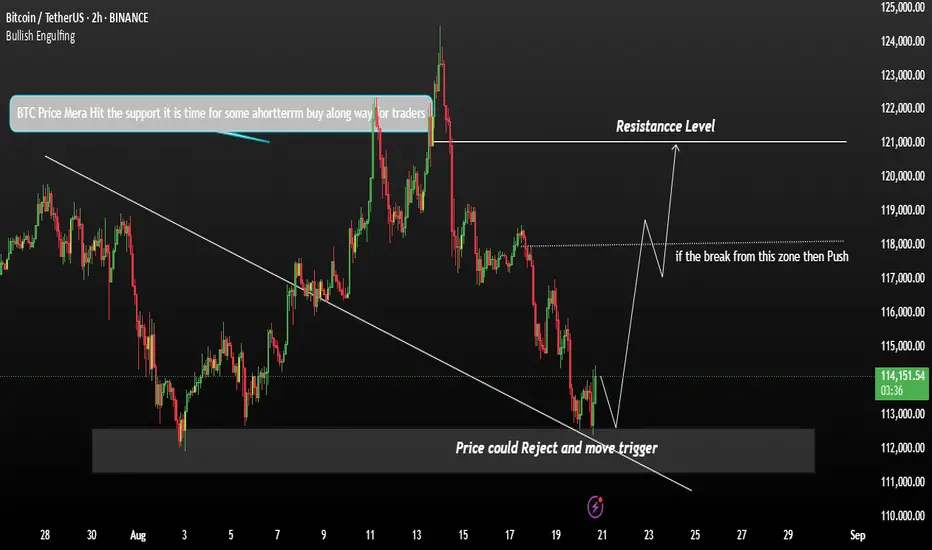
BTC Momentum Reject Bearish move to upside]BTC is showing signs of consolidation after recent growth and correction phases on the lower timeframes The market currently appears bearish, with red candles dominating the charts However, there may be a short-term buying opportunity forming.
Price recently rejected from a support level, indicati
BTC - Following Crash PlanBTC has been following my analysis of predicting a potential crash here.
We can use DXY to anticipate when a significant liquidity grab / flash crash will occur.
Since DXY is retesting a major breakdown on the weekly - monthly, it would be wise to watch for volatility today on Bitcoins price, no
See all crypto ideas
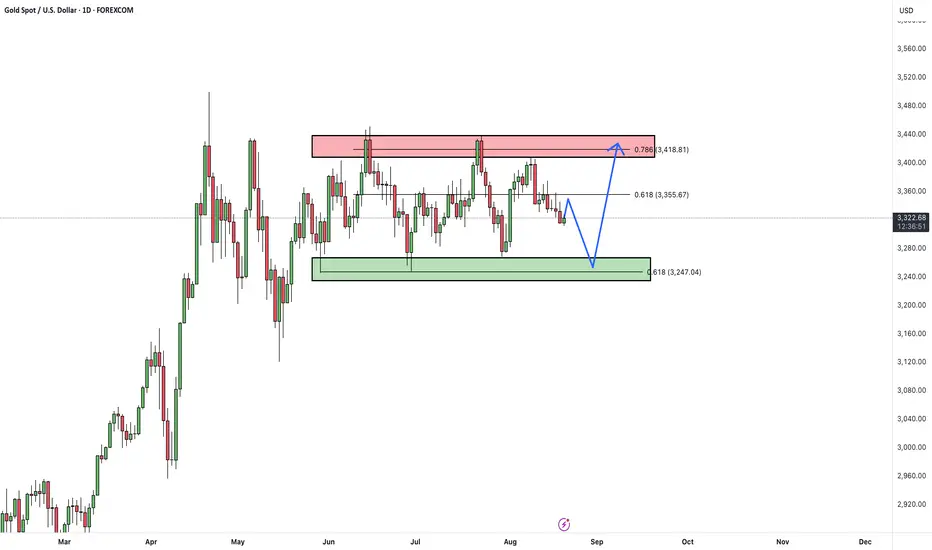
XAUUSDHello Traders! 👋
What are your thoughts on GOLD?
Gold remains trapped in a tight consolidation range between key support and resistance zones.
In the short term, the ongoing decline is expected to extend toward the support area, where a bullish reaction may occur.
As long as price stays within th
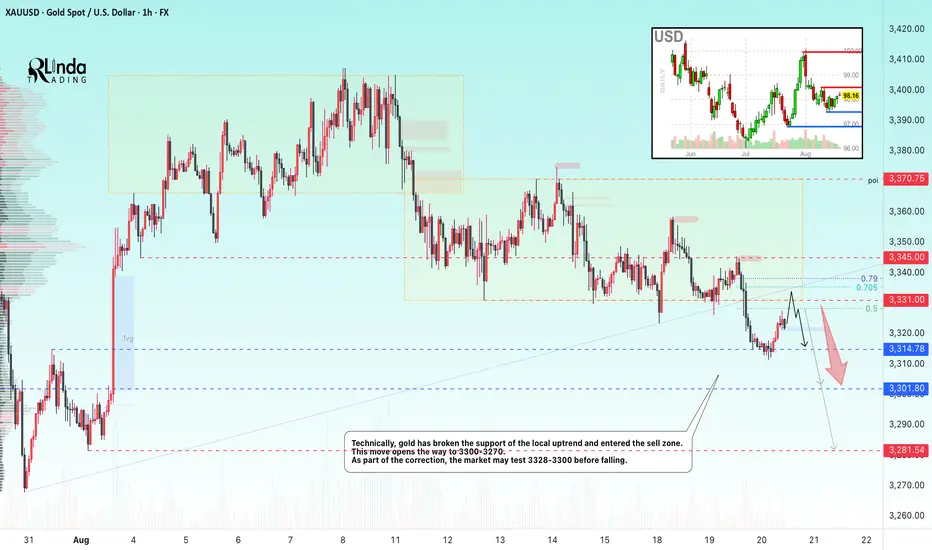
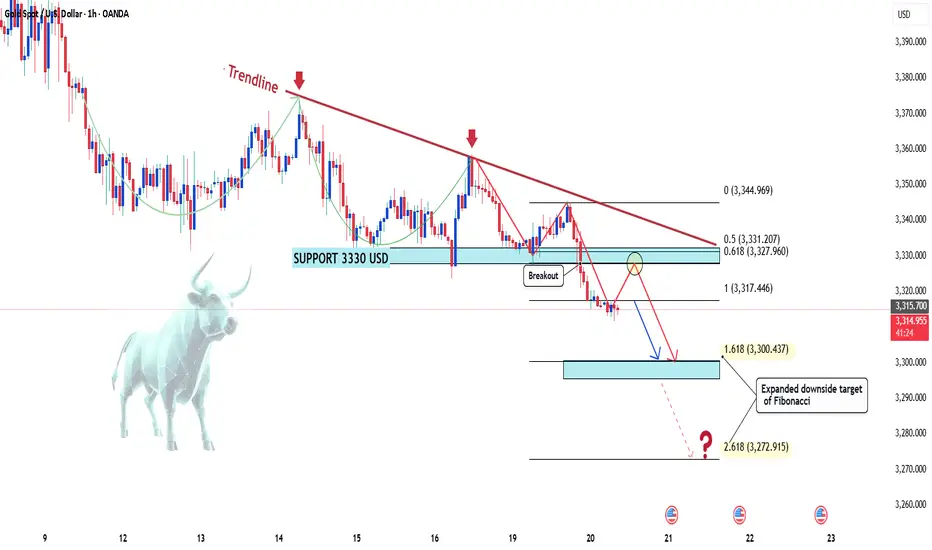
GOLD → Correction and retest of a previously broken level...FX:XAUUSD breaks through the support of the local consolidation “symmetrical triangle” and falls to a minimum of 3311...
Gold remained at a three-week low of around $3,300 in Asian trading on Wednesday as markets awaited the Fed minutes and Powell's speech in Jackson Hole. The dollar is streng
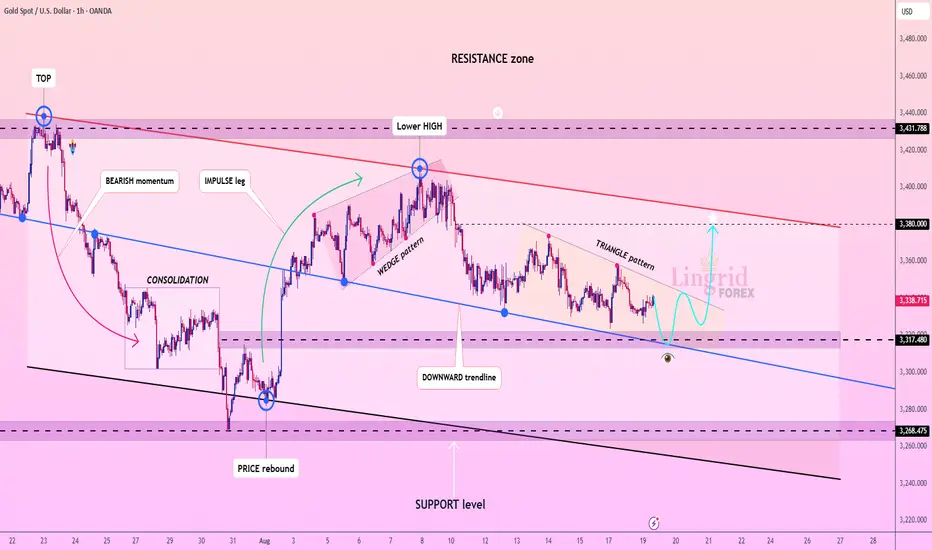
Lingrid | GOLD Clings to Critical Support ZoneOANDA:XAUUSD has been consolidating, moving inside a descending channel after a sharp rejection from resistance. Structure shows a wedge followed by a triangle pattern inside the downward trendline, pointing to compression before a potential breakout. A bullish scenario opens if price bounces from
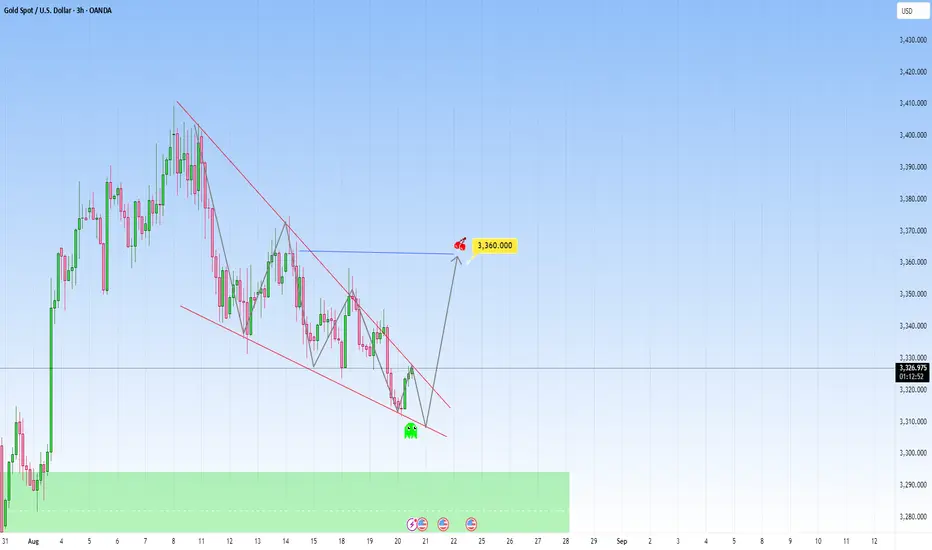
Gold in a falling wedge pattern: Ready for a strong ride upPrice on XAUUSD looks quite interesting right now, this recent has brought a new look to it, as it's forming a more optimistic pattern.
The most recent interaction here is particularly interesting, because it's already showing early signs of recovering and decreased bearish momentum. What may follo
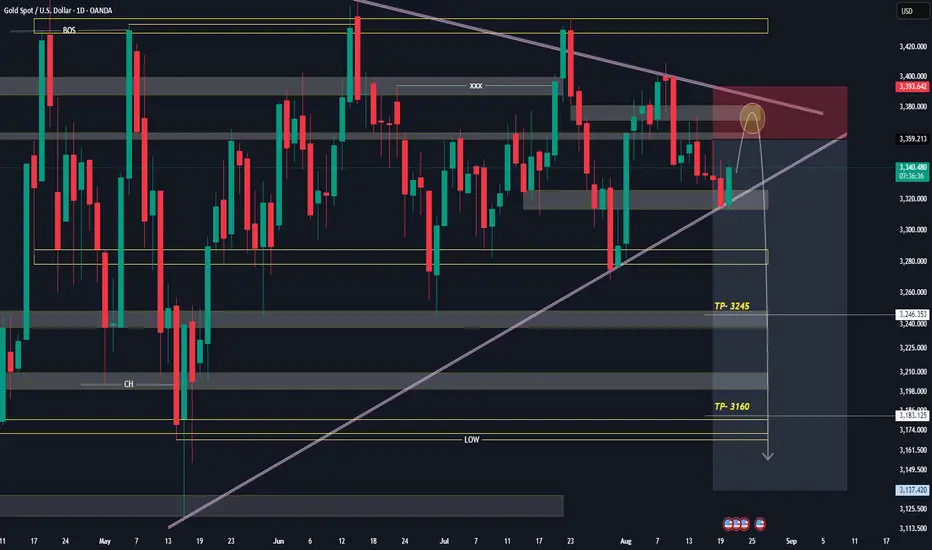
GOLD NEXT MOVE (expecting a bearish move)(mid term)(20-08-2025)Go through the analysis carefully and do trade accordingly.
Anup 'BIAS for the Mid Term
Current price- 3345
BEST Selling area= 3365-70
"if Price stays below 3395, then next target is 3245, 3180 and 3120 and above that 3400 ".
-POSSIBILITY-1
Wait (as geopolitical situation are worsening )
-POSSI
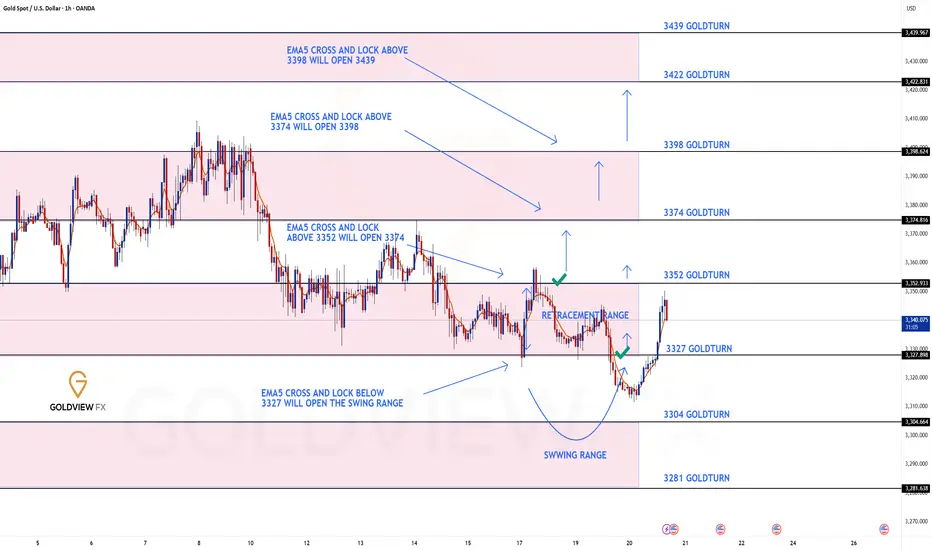
GOLD ROUTE MAP UPDATEHey Everyone,
Quick follow up update on our 1H chart idea:
After completing both our Bullish target at 3352 and Bearish target at 3327, we now have a lock below 3327 which opened the swing range down towards 3304. We did get the drop, but not the full test of 3304 before price turned back up.
Rig
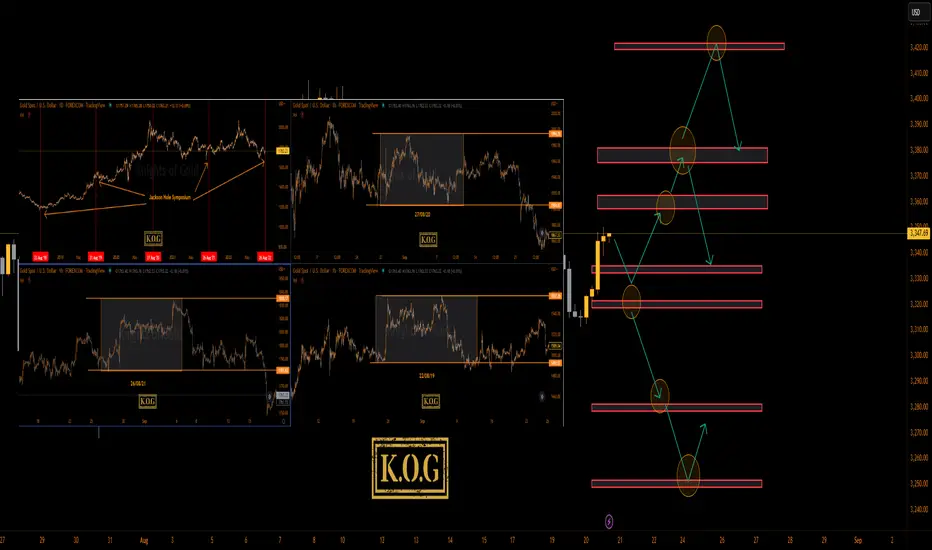
THE KOG REPORT - Jackson Hole Pt 2Jackson Hole 2025:
Here’s what to expect from the 2025 Jackson Hole Economic Policy Symposium, held August 21–23 in Jackson Hole, Wyoming:
Event Overview & Theme
• The 48th annual symposium is hosted by the Federal Reserve Bank of Kansas City from August 21 to 23, 2025.
• The theme is “Labour M
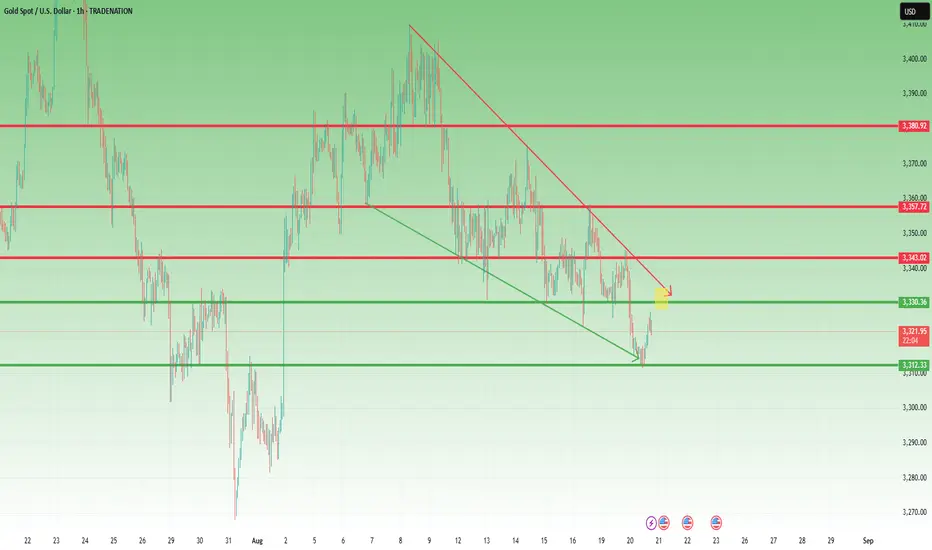
Latest Gold Price Update – Will the Downtrend Continue?Hello everyone, what do you think about OANDA:XAUUSD ? Will it go up or down?
As per our strategy from yesterday , gold has dropped sharply, currently trading around 3,315 USD, and down more than 300 pips from the previous session.
Gold continues to trade within a narrow range as traders await
XAUUSD – Waiting for the Market to Show Its Hand1. Yesterday’s Setup
In my yesterday’s analysis, I mentioned that while I am bullish overall, I could not ignore the pressure Gold was putting on the 3330 support. I also noted that for bulls to regain control, a break above 3345 was needed.
The market reacted with textbook precision: price rallied
Gold 30Min Engaged ( Bullish & Bearish Reversal Entry Detected Time Frame: 30-Minute Warfare
Entry Protocol: Only after volume-verified breakout
🩸Bearish Movemnent from - 3326
🩸Bullish Reversal - 3303
➗ Hanzo Protocol: Volume-Tiered Entry Authority
➕ Zone Activated: Dynamic market pressure detected.
The level isn’t just price — it’s a memory of where they mo
See all futures ideas
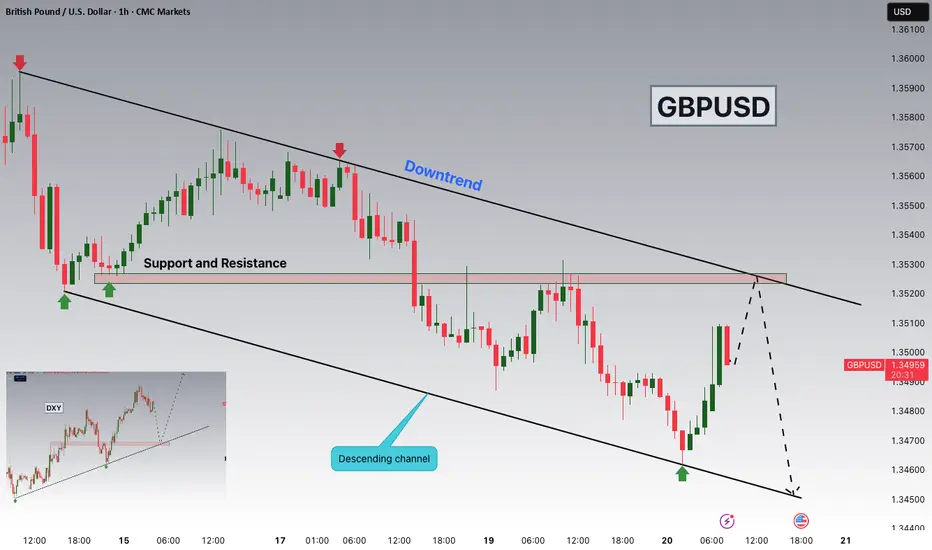
GBPUSD at 1.35250 Resistance as DXY Eyes 98.100 SupportHey Traders, in today's trading session we are monitoring GBPUSD for a selling opportunity around 1.35250 zone, GBPUSD is moving within a descending channel, with price correcting higher toward the 1.35250 resistance zone — an area that previously acted as support.
Meanwhile, the U.S. Dollar Index
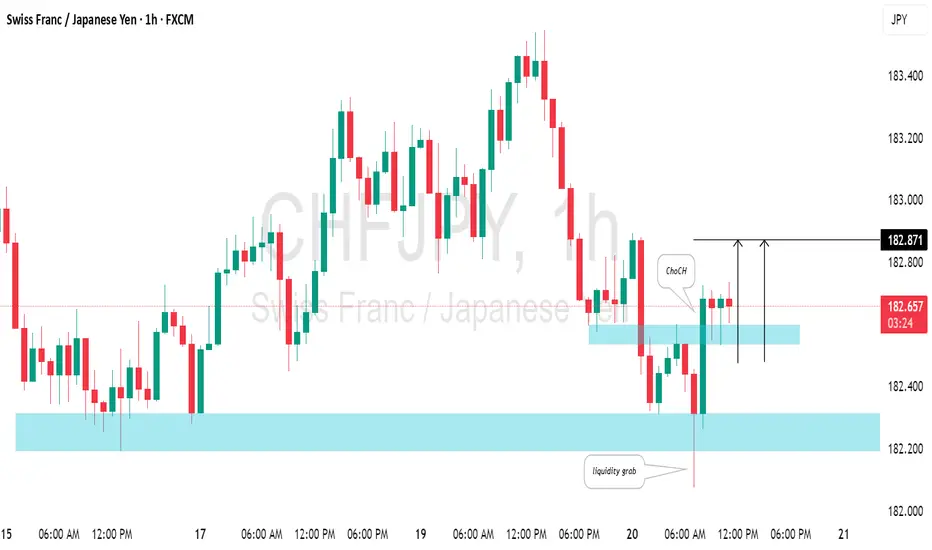
CHFJPY: Move Up Ahead?!The CHFJPY pair exhibits a strong bullish bias this morning.
The price action has generated a high-momentum bullish hourly candle, successfully breaching a minor intraday resistance level.
This movement confirms a Change of Character (CHoCH) pattern, suggesting a high probability of continued bull
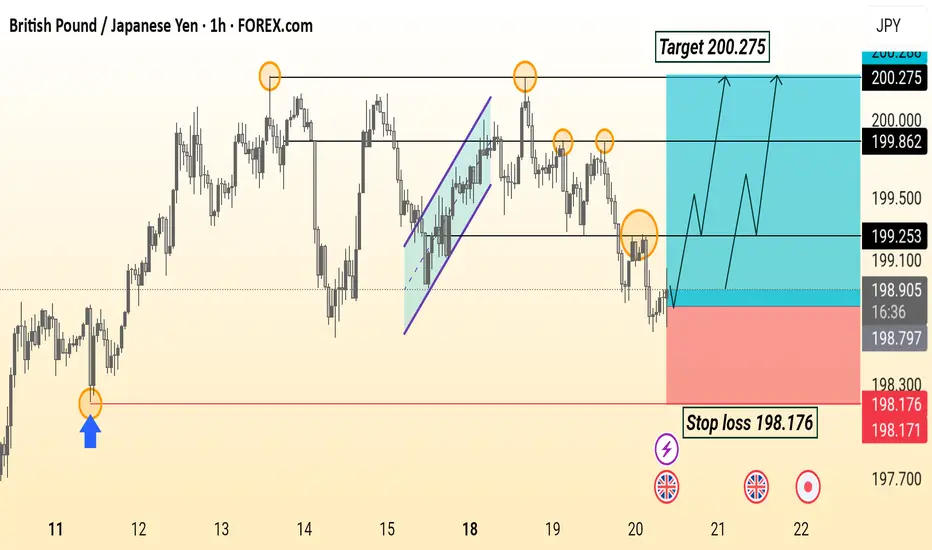
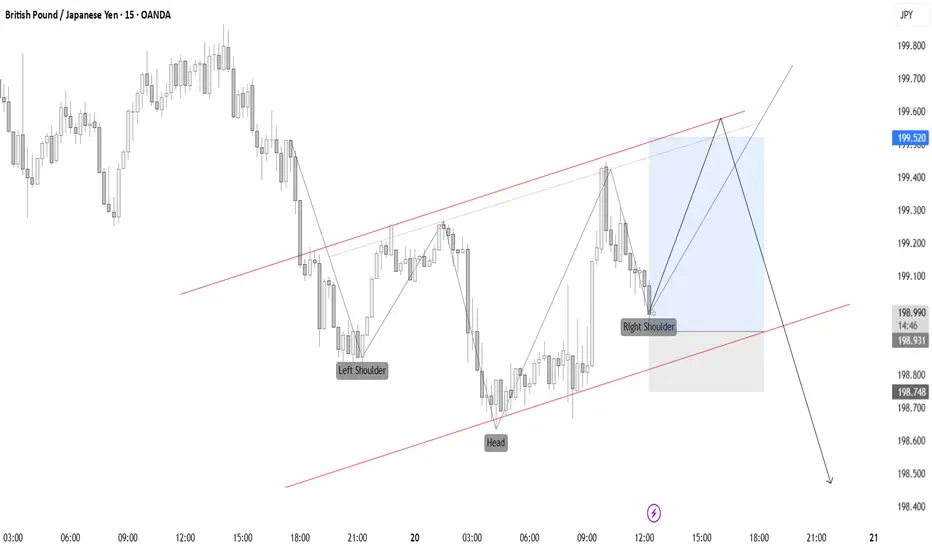
GBP/JPY Setup This GBP/JPY 1H analysis shows a bullish setup with entry around 198.9, targeting 200.275. The price is expected to bounce upward after retesting support, with a stop loss placed at 198.176 for risk management.
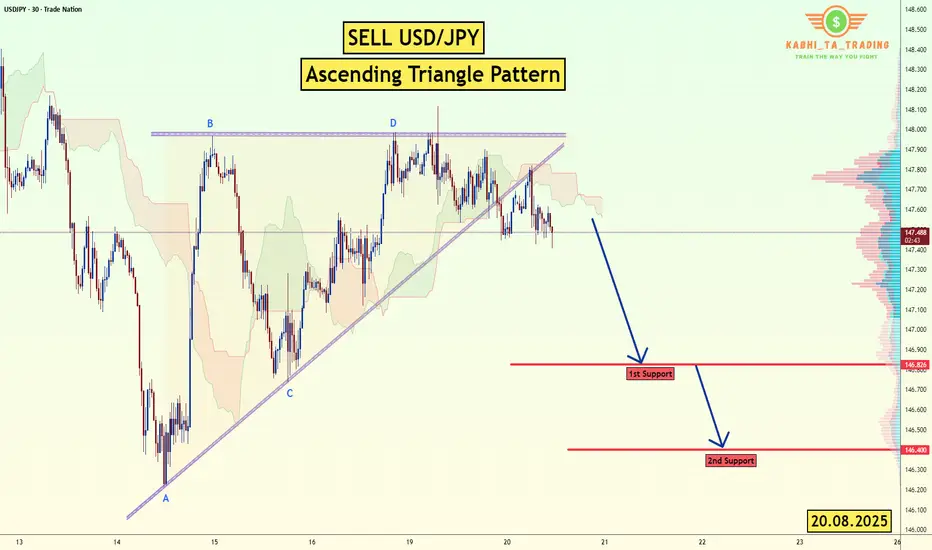
USD/JPY - Triangle Breakout (20.08.2025)The USD/JPY Pair on the M30 timeframe presents a Potential Selling Opportunity due to a recent Formation of a Ascending Triangle Pattern. This suggests a shift in momentum towards the downside in the coming hours.
Possible Short Trade:
Entry: Consider Entering A Short Position around Trendline
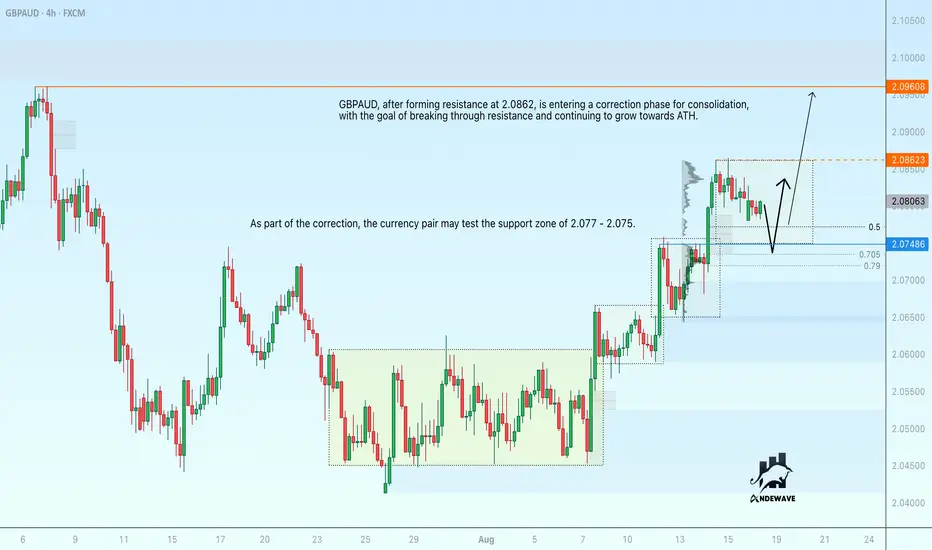
GBPAUD consolidation before growth. Rebound from 2.077After forming resistance at 2.0862, GBPAUD is entering a correction phase for consolidation, with the goal of breaking through resistance and continuing to grow towards ATH.
As part of the correction, the currency pair may test the support zone of 2.077 - 2.075.
The trend is bullish, and there is a
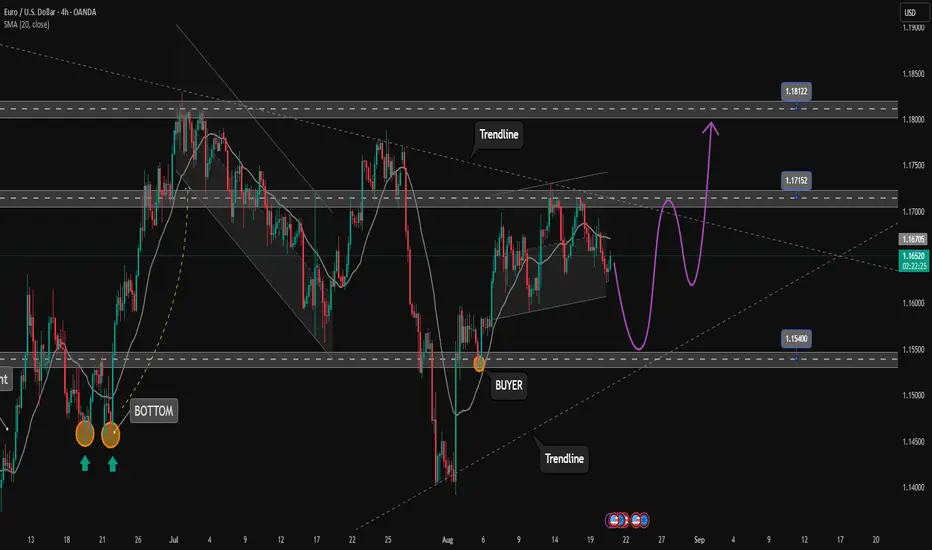
EURUSD is slow moving. Wait for more factors to enter orders✏️ EURUSD is trading in a consolidation range, the trend to trade at the moment is not there. Wait for clearer momentum at resistance or support zones to set up Orders. 1.154 plays an important support role at the moment of the bullish wave structure, it is the confluence point of the Trendline and
Buy GBPJPYGBPJPY is currently negative today. Price should reverse upwards to trigger more sell orders just above the recent high, an inverse head and shoulder confirms the bullish move.
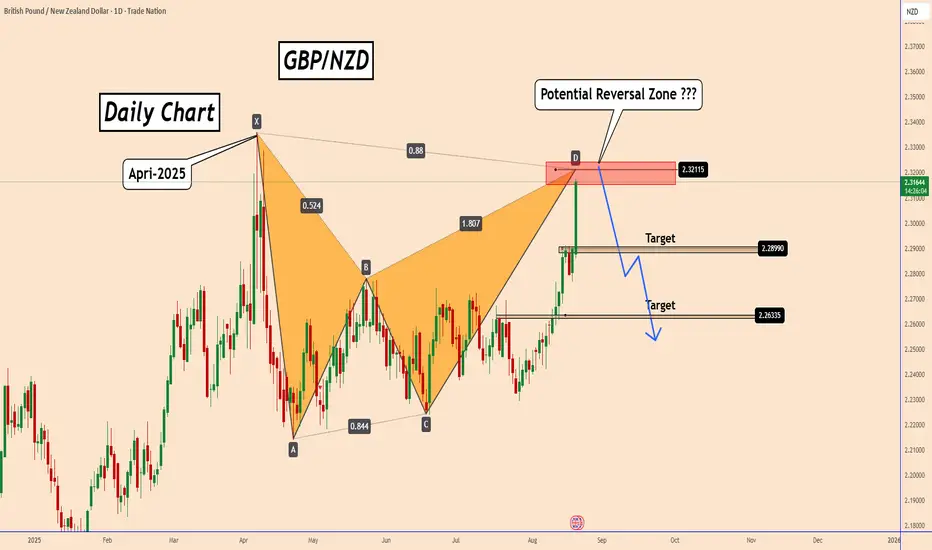
GBPNZD: Rate Cut & Weak Outlook Sink NZD—Is GBPNZD Overextended?GBPNZD: Rate Cut & Weak Outlook Sink NZD—Is GBPNZD Overextended?
The New Zealand Dollar faced aggressive selling after the RBNZ cut its interest rate by 25 basis points from 3.25% to 3%, as widely expected.
From the RBNZ Governor’s press conference, I would single out two comments that I think cr
20.08.25 Morning ForecastPairs on Watch -
FX:GBPUSD
FX:EURUSD
FX:AUDJPY
OANDA:XAGUSD
A short overview of the instruments I am looking at for today, multi-timeframe analysis down to what I will be looking at for an entry. Enjoy!

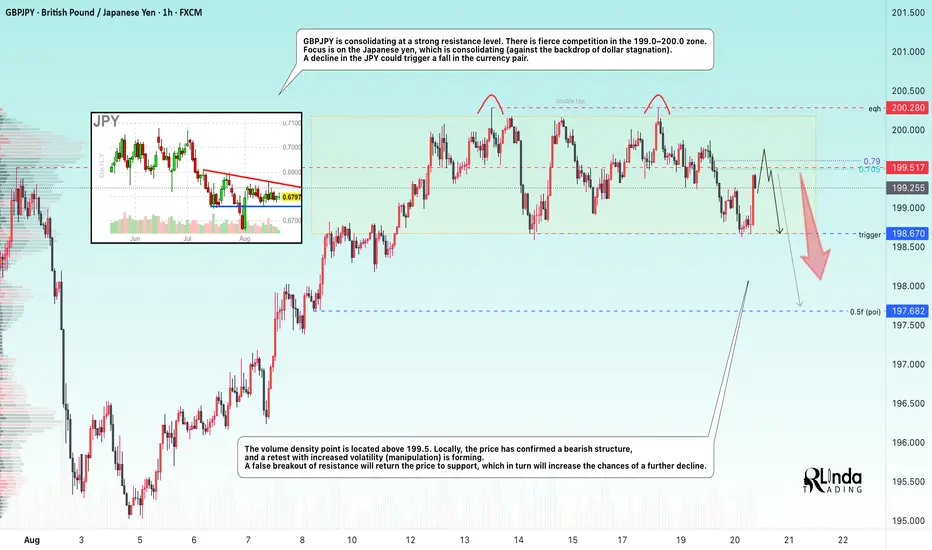
GBPJPY → False breakout and reversal patternFX:GBPJPY is forming a false breakout of strong resistance from D1. A trading range (consolidation) is forming, and market participants are fighting for the 199.0 - 200.0 zone.
GBPJPY is consolidating at strong resistance. A fierce battle is underway for the 199.0-200.0 zone. Focus is on the J
See all forex ideas
| - | - | - | - | - | - | - | ||
| - | - | - | - | - | - | - | ||
| - | - | - | - | - | - | - | ||
| - | - | - | - | - | - | - | ||
| - | - | - | - | - | - | - | ||
| - | - | - | - | - | - | - | ||
| - | - | - | - | - | - | - | ||
| - | - | - | - | - | - | - |
Trade directly on the supercharts through our supported, fully-verified and user-reviewed brokers.


