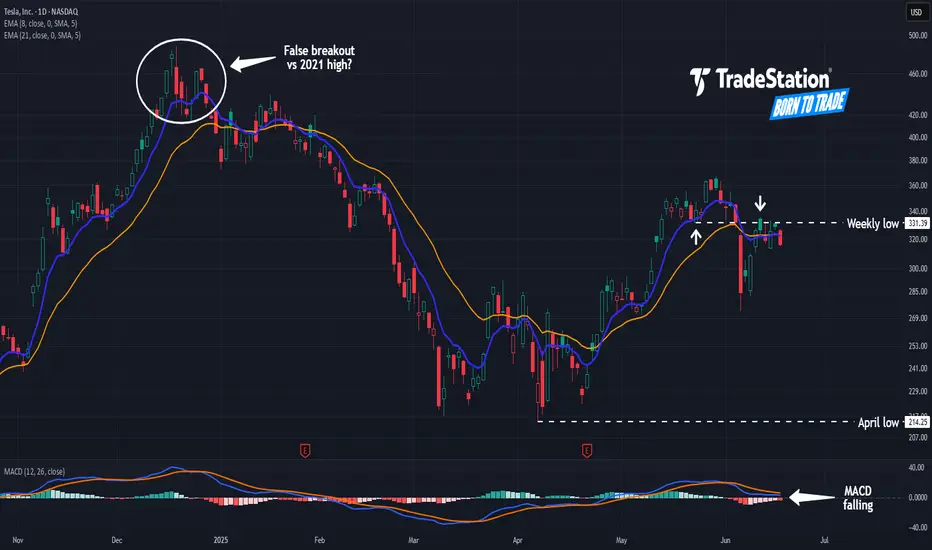
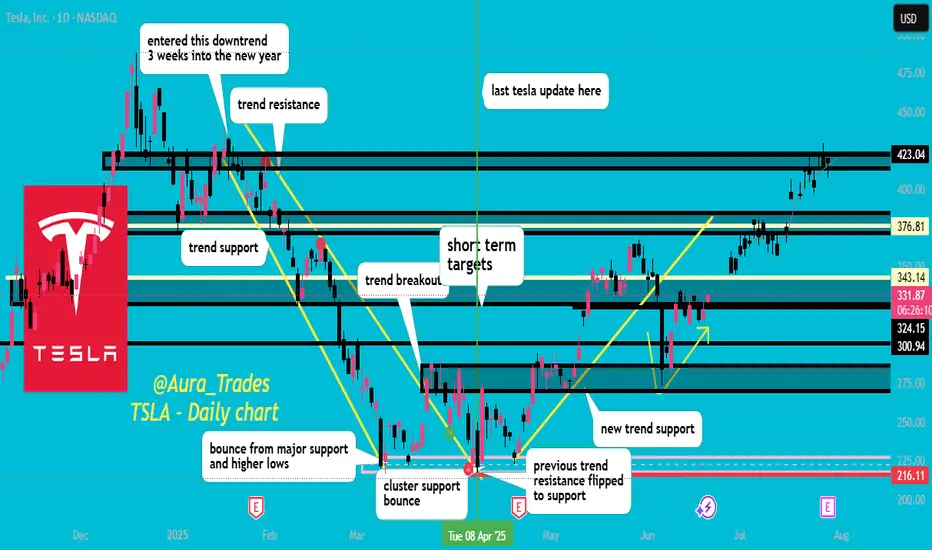
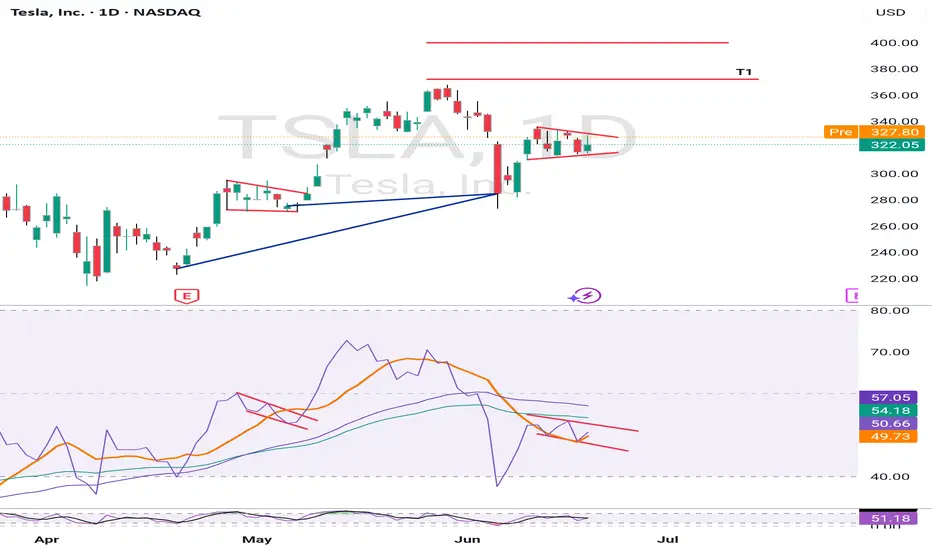
Tesla May Be StallingTesla bounced between early April and late May, but now it may be stalling.
The first pattern on today’s chart is the weekly low of $331.39 from May 22. TSLA fell below that level two weeks ago and was rejected at the same price area last week. Has old support become new resistance?
Second, the st

The best trades require research, then commitment.
Get started for free$0 forever, no credit card needed

Scott "Kidd" PoteetThe unlikely astronaut

Where the world does markets
Join 100 million traders and investors taking the future into their own hands.
German 40 Index – Sentiment Facing a Sterm TestSince hitting its most recent all time high of 24469 on June 5th the Germany 40 index has experienced some downside pressure as traders have moved to lock in profits on a very strong start to the year. This move has the potential to turn June into the worst monthly performance of 2025 so far, althou

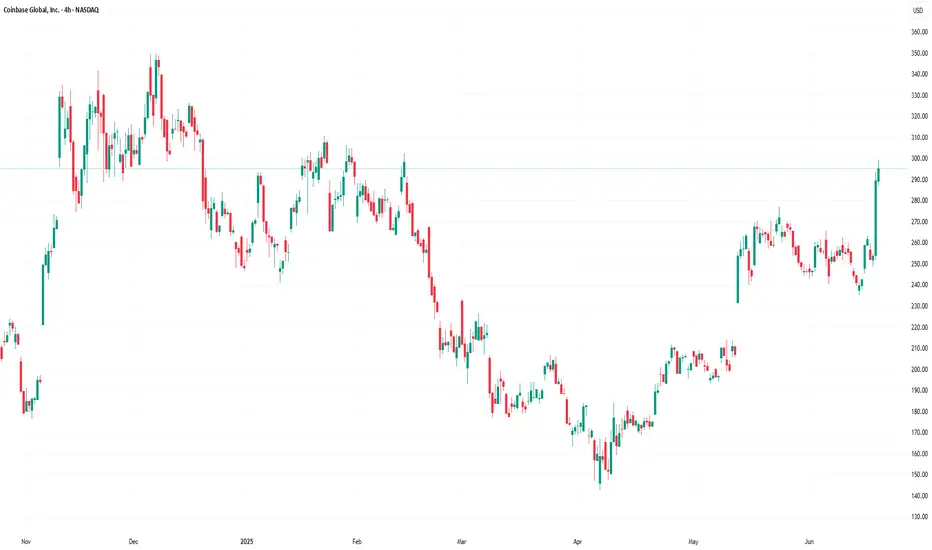
Coinbase Shares Rise Following Stablecoin Legislation ApprovalCoinbase (COIN) Shares Rise Following Stablecoin Legislation Approval
Shares in Coinbase Global (COIN) surged by 11% yesterday, making the company the top performer in the S&P 500 index (US SPX 500 mini on FXOpen).
The sharp rise was driven by news that the US Senate has approved the GENIUS stabl
CRYPTO - Big Smackdown Then AltSeason ?The Crypto Cycle Gurus are telling us that AltSeason is just around the corner since the expected 4 year cycle completion is just a few months away...
But are they correct or is there a twist in the tale ?
Here's a 10 minute video to show a potential twist.
There might just be a DEEP dip buy oppo

TradingView Show: New Trade Ideas and The Leap TradeStationJoin us for a timely TradingView live stream with David Russell, Head of Global Market Strategy at TradeStation, as we break down the latest rebound in the markets and what it could mean for traders and investors. In this session, we’ll dive into:
- The upcoming Fed meeting and what policymakers

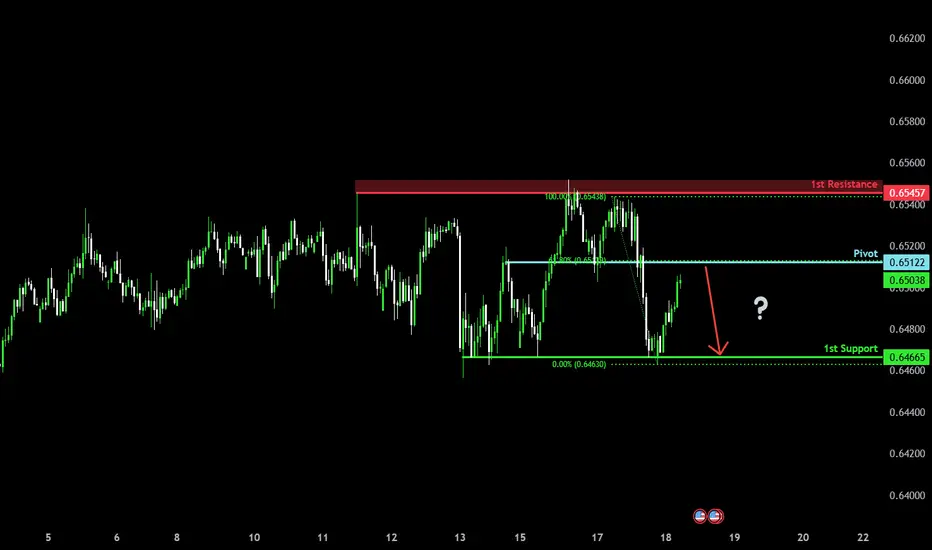
Major resistance ahead?The Aussie (AUD/USD) is rising towards the pivot which has been identified as an overlap resistance and could reverse to the 1st support.
Pivot: 0.6512
1st Support: 0.6466
1st Resistance: 0.6545
Risk Warning:
Trading Forex and CFDs carries a high level of risk to your capital and you should only
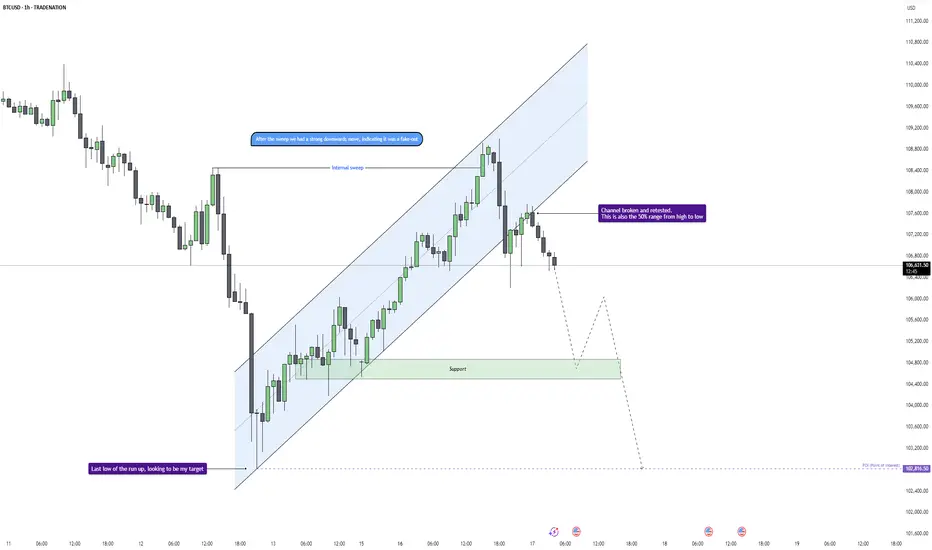
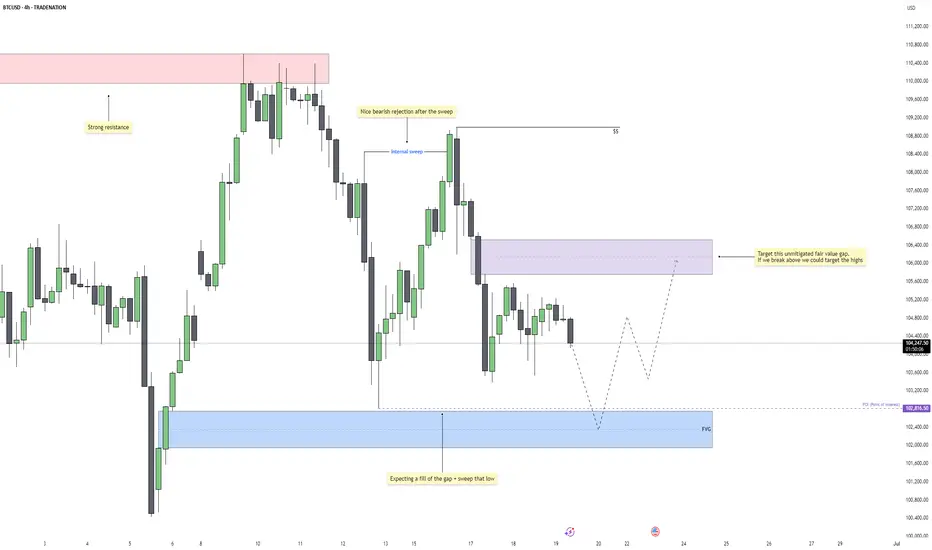
Bitcoin - Trend Shift Confirmed, Eyes on $102.8K LiquidityMarket Context
Bitcoin showed signs of exhaustion after a strong short-term rally within a clean upward channel on the 1H chart. Price action had been respecting the trend structure until a key deviation occurred near $108,500, where we saw an internal liquidity sweep that hinted at potential distr
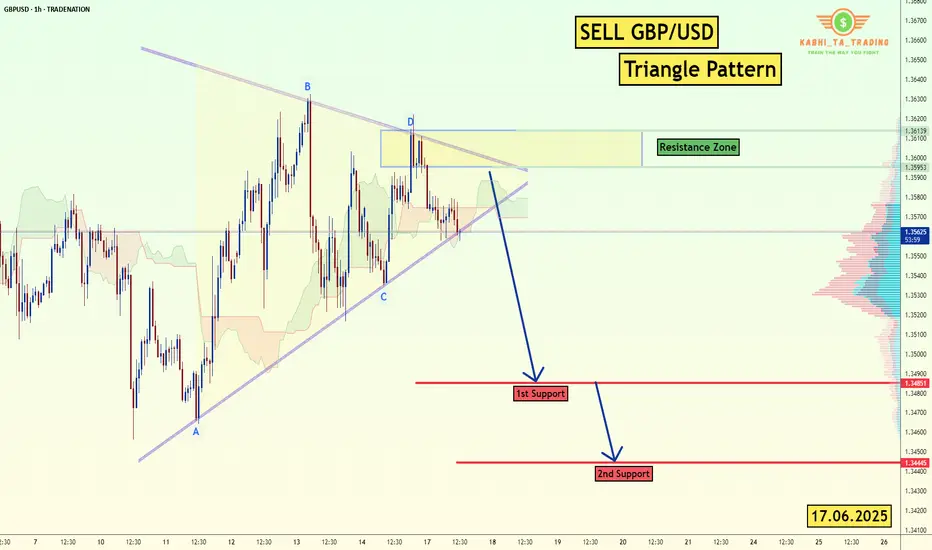
GBP/USD - H1-Triangle Breakout (17.06.2025)The GBP/USD Pair on the H1 timeframe presents a Potential Selling Opportunity due to a recent Formation of a Triangle Breakout Pattern. This suggests a shift in momentum towards the downside in the coming hours.
Possible Short Trade:
Entry: Consider Entering A Short Position around Trendline O
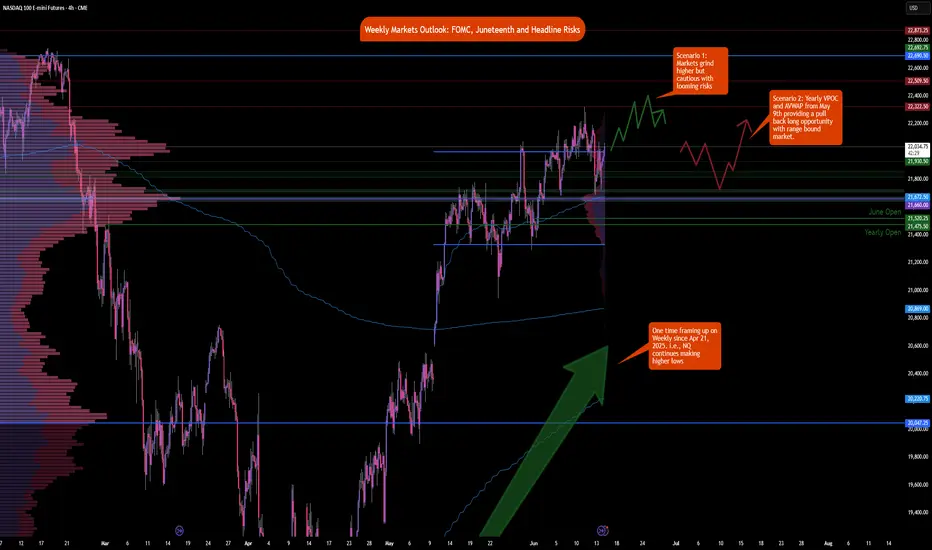
Weekly Market Outlook: FOMC, Trade Deals and GeopoliticsIt is a holiday-shortened week, with the majority of markets halting early on Thursday, June 19, 2025, in observance of Juneteenth. See here for holiday trading schedule
Key Themes to Monitor This Week
Geopolitical Risks
Any outside intervention in the ongoing Israel-Iran conflict will like
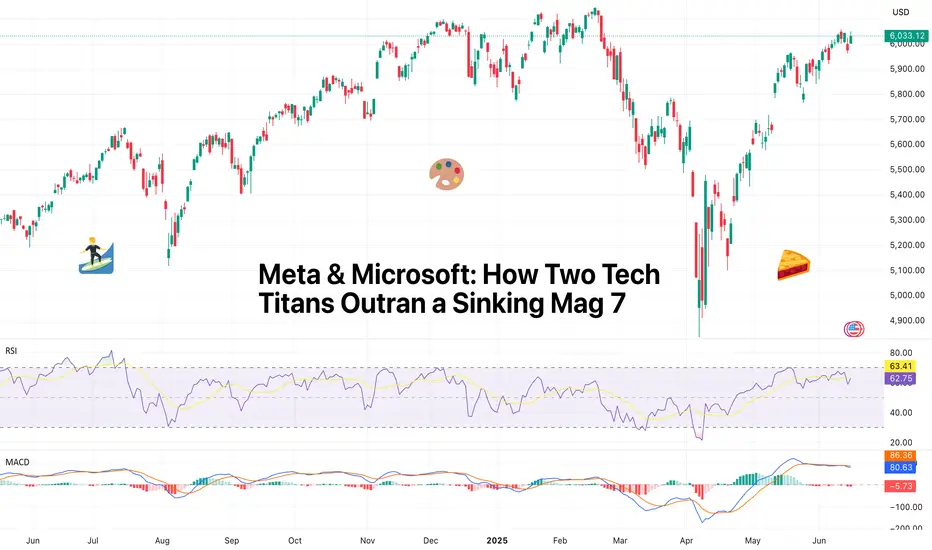
Meta & Microsoft: How Two Tech Titans Outran a Sinking Mag 7Forget about the Magnificent Seven and say hello to M&M — the only two winners of the year so far.
If you blinked during the first half of 2025, you might’ve missed it: the mighty Magnificent Seven are starting to look more like a Scraggly Five. While Tesla NASDAQ:TSLA fumbled its autonomy narra
See all editors' picks ideas
Deviation Trend Profile [BigBeluga]🔵 OVERVIEW
A statistical trend analysis tool that combines moving average dynamics with standard deviation zones and trend-specific price distribution.
This is an experimental indicator designed for educational and learning purposes only.
🔵 CONCEPTS
Trend Detection via SMA Slope: Detect

Rolling Z-Score Trend [QuantAlgo]🟢 Overview
The Rolling Z-Score Trend measures how far the current price deviates from its rolling mean in terms of standard deviations. It transforms price data into standardized scores to identify overbought and oversold conditions while tracking momentum shifts.
The indicator displays a Z-S

Yelober - Sector Rotation Detector# Yelober - Sector Rotation Detector: User Guide
## Overview
The Yelober - Sector Rotation Detector is a TradingView indicator designed to track sector performance and identify market rotations in real-time. It monitors key sector ETFs, calculates performance metrics, and provides actionable stock

TASC 2025.07 Laguerre Filters█ OVERVIEW
This script implements the Laguerre filter and oscillator described by John F. Ehlers in the article "A Tool For Trend Trading, Laguerre Filters" from the July 2025 edition of TASC's Traders' Tips . The new Laguerre filter utilizes the UltimateSmoother filter in place of an exponenti

Trend Impulse Channels (Zeiierman)█ Overview
Trend Impulse Channels (Zeiierman) is a precision-engineered trend-following system that visualizes discrete trend progression using volatility-scaled step logic. It replaces traditional slope-based tracking with clearly defined “trend steps,” capturing directional momentum only when

Magnificent 7 OscillatorThe Magnificent 7 Oscillator is a sophisticated momentum-based technical indicator designed to analyze the collective performance of the seven largest technology companies in the U.S. stock market (Apple, Microsoft, Alphabet, Amazon, NVIDIA, Tesla, and Meta). This indicator incorporates established

SmartPhase Analyzer📝 SmartPhase Analyzer – Composite Market Regime Classifier
SmartPhase Analyzer is an adaptive regime classification tool that scores market conditions using a customizable set of statistical indicators. It blends multiple normalized metrics into a composite score, which is dynamically evaluated

ATR RopeATR Rope is inspired by DonovanWall's "Range Filter". It implements a similar concept of filtering out smaller market movements and adjusting only for larger moves. In addition, this indicator goes one step deeper by producing actionable zones to determine market state. (Trend vs. Consolidation)
>

Langlands-Operadic Möbius Vortex (LOMV)Langlands-Operadic Möbius Vortex (LOMV)
Where Pure Mathematics Meets Market Reality
A Revolutionary Synthesis of Number Theory, Category Theory, and Market Dynamics
🎓 THEORETICAL FOUNDATION
The Langlands-Operadic Möbius Vortex represents a groundbreaking fusion of three profound mathematic

Risk-Adjusted Momentum Oscillator# Risk-Adjusted Momentum Oscillator (RAMO): Momentum Analysis with Integrated Risk Assessment
## 1. Introduction
Momentum indicators have been fundamental tools in technical analysis since the pioneering work of Wilder (1978) and continue to play crucial roles in systematic trading strategies (Jeg

See all indicators and strategies
Community trends
Tesla update, watch 343 level!boost and follow for more ❤️🔥 tsla broke the trend support mentioned in my last analysis, doesn't surprise me too much I did mention it was likely, now look for a daily close above 343, if we can get that then the rally to and past 400+ will come in the blink of an eye 🎯👁️
that is all, I am done p
Micron Technology - Starting the next +80% move!Micron Technology - NASDAQ:MU - perfectly respects structure:
(click chart above to see the in depth analysis👆🏻)
Starting back in mid 2024, Micron Technology created the expected long term top formation. We witnessed a correction of about -60%, which ultimately resulted in a retest of a conflu

CRCL LOOKS OVERBOUGHTAs you can see after a good ride from 102 to 234 now the stock looks overbought. and on shorter time frames the price action shows a classic pattern of double top and breaking the previous support. simply if the stock closes 15 m candle below the support you might see a short retest to the support f

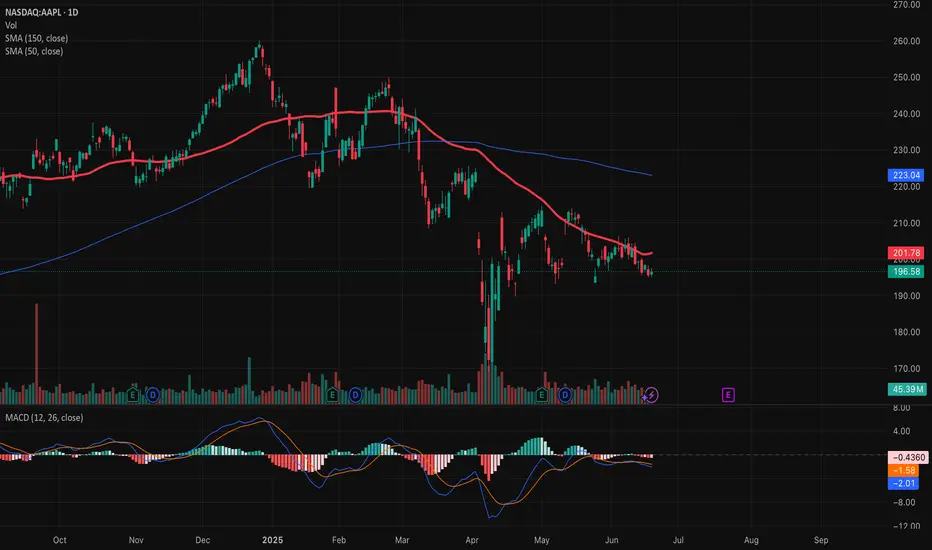
MA chart styleThis is a chart style I need to save. Buy above positive gradient 50 MA and above or close to 150. Confirm with volume and size based on local resistance levels.
Coinbase Shares Rise Following Stablecoin Legislation ApprovalCoinbase (COIN) Shares Rise Following Stablecoin Legislation Approval
Shares in Coinbase Global (COIN) surged by 11% yesterday, making the company the top performer in the S&P 500 index (US SPX 500 mini on FXOpen).
The sharp rise was driven by news that the US Senate has approved the GENIUS stabl
$IREN could be next...100%+ UpsideNext Retail Darling... NASDAQ:IREN TA looks the part! 👀
Breakout 🎯$22 then $31
CupnHandle almost breaking out here with measured moves a lot higher!
Volume shelf acting as a launch pad.
WR% is uptrnding as well!
This one's looking good based on the TA.

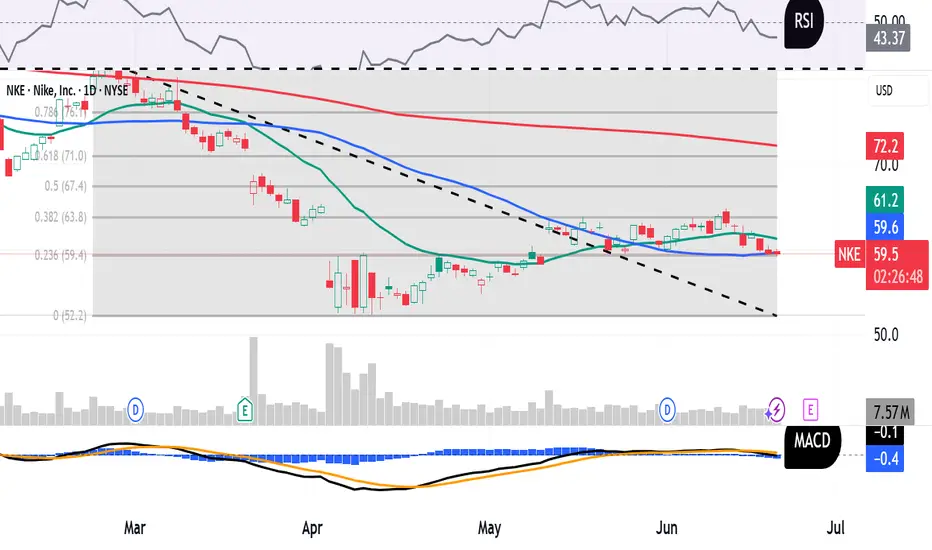
Will Nike’s Upcoming Earnings ‘Just Do It’ for Investors?This hasn’t been the greatest year for Nike NYSE:NKE , which will report earnings next Thursday at a time when the stock is down more than 20% year to date. What does technical and fundamental analysis say might happen to the stock from here?
Let’s take a look:
Nike’s Fundamental Analysis
NKE
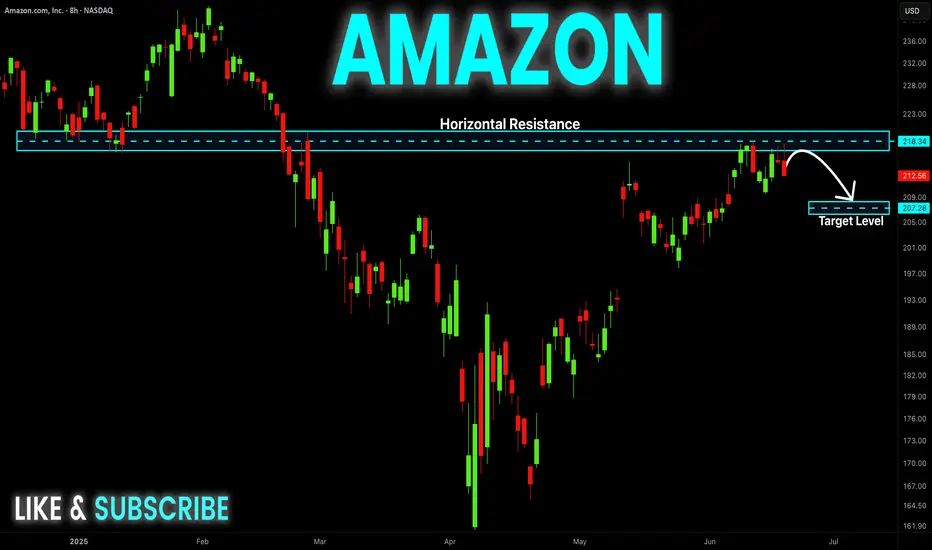
AMAZON Local Short! Sell!
Hello,Traders!
AMAZON made a retest
Of the horizontal resistance
Around 219$ and the stock
Is already making a local
Bearish pullback so a further
Bearish correction
Is to be expected
Sell!
Comment and subscribe to help us grow!
Check out other forecasts below too!
Disclosure: I am part
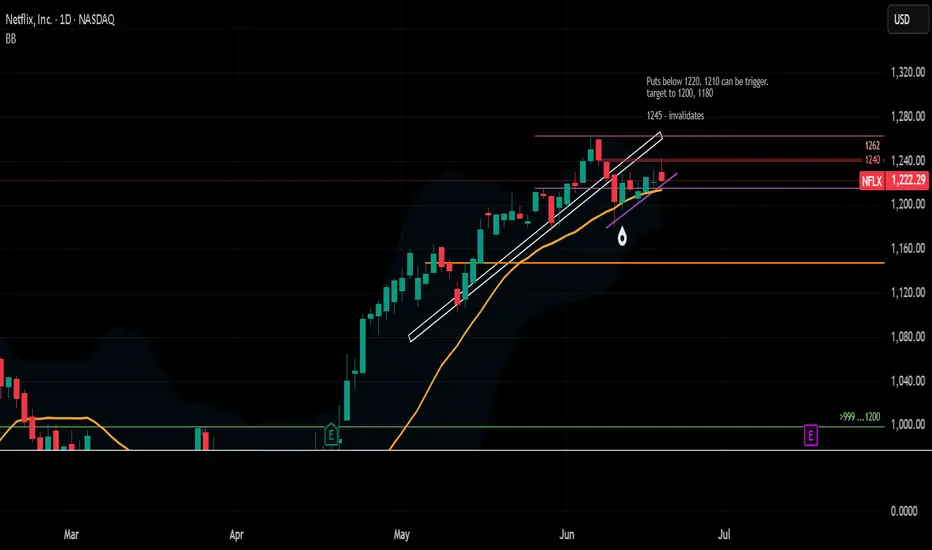
NFLX chop & dropI had a whole video that I created but couldn't manage to post. Nonetheless... I figured it out and will just share my points in this picture.
*below the 21 ema (1220), I believe we can target 1200 down to 1180. I'll be on the lookout for this trade until it happens.
That's it... that's the post.
TSLA JUNE 20 2025 READ NOTESThis is momentum based price targeting & Tesla can easily do $390 but before that 342 is a solid resistance. From there we can get a dip and then price can continue the up move further
ANY NEWS IS TO BE AVOIDED
Now price action which is way superior is clearly suggesting the same up move.
I fact
See all stocks ideas
Today
ACNAccenture plc
Actual
3.49
USD
Estimate
3.32
USD
Today
KMXCarMax Inc
Actual
1.38
USD
Estimate
1.16
USD
Today
DRIDarden Restaurants, Inc.
Actual
2.98
USD
Estimate
2.96
USD
Today
IGCIGC Pharma, Inc.
Actual
—
Estimate
−0.02
USD
Today
QMCOQuantum Corporation
Actual
—
Estimate
−1.17
USD
Jun 23
EBFEnnis, Inc.
Actual
—
Estimate
0.37
USD
Jun 23
JRSHJerash Holdings (US), Inc.
Actual
—
Estimate
0.01
USD
Jun 23
FDSFactSet Research Systems Inc.
Actual
—
Estimate
4.30
USD
See more events
Community trends
Bitcoin - Expecting Liquidity Grab at 102.8k Before Relief MoveMarket Context
After a strong rejection from resistance, price has shown clear signs of internal weakness. We recently got an internal liquidity sweep followed by a sharp move down, confirming a shift in momentum. The market is currently compressing just below a key fair value gap, hinting at furth
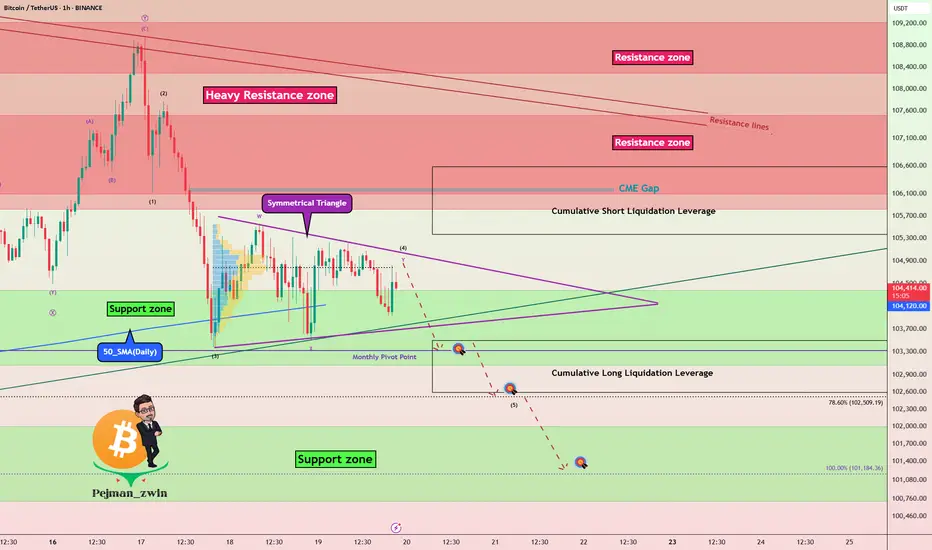
BTC - Key Battle Between Bulls and Bears – Symmetrical TriangleBitcoin ( BINANCE:BTCUSDT ) is currently consolidating within a Symmetrical Triangle , showing indecision among Bulls and Bears around the Support zone($104,380-$103,060) and just above the 50_SMA (Daily) .
From an Elliott Wave perspective, the current range may represent a WXY corrective
Dogecoin - This is the key structure!Dogecoin - CRYPTO:DOGEUSD - has to reverse now:
(click chart above to see the in depth analysis👆🏻)
A couple of months ago Dogecoin retested the previous all time high. We have been seeing a harsh correction of about -65% thereafter. However Dogecoin still remains in a bullish market with bull

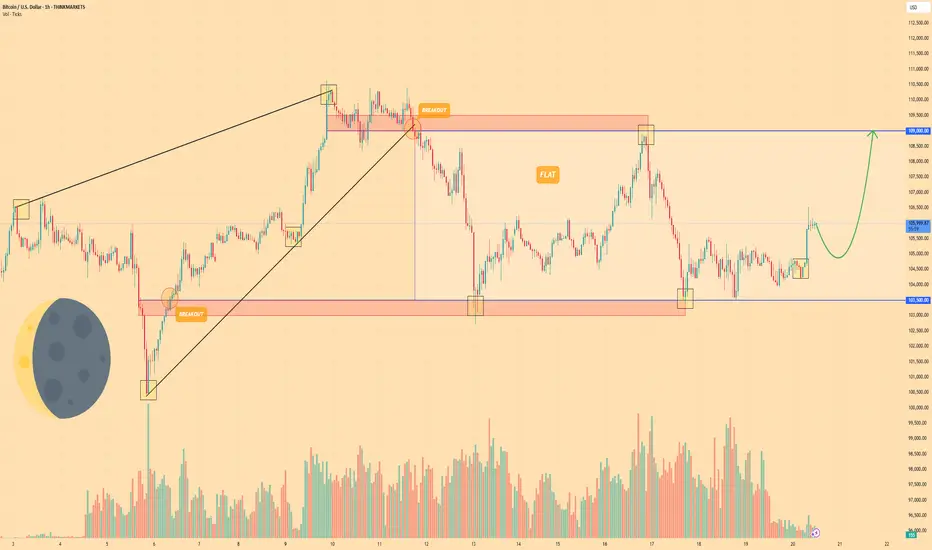
BITCOIN - Price can continue grow inside flat to $109000 levelHi guys, this is my overview for BTCUSD, feel free to check it and write your feedback in comments👊
A few days ago, the price entered a wedge, declining below the $103500 level and then making a strong impulse up.
Next, price broke $103500 level one more time and rose to resistance line of wedge,
Bitcoin may rebound from support line of wedge and start to growHello traders, I want share with you my opinion about Bitcoin. Initially, the price was trading inside a well-defined range, moving sideways with repeated rejections from both support and resistance. After several attempts to stay above the support zone, BTC finally broke down and sharply declined b

Bitcoin Cash BCH: $495 | Breaking out back to FRESH HiGHS a fork or spin off from original Bitcoin
created for scale more txn lower fees and faster
nice consistent volume
supply under the custody of big 3
could be best performing among OG coins
with less fanfare promotion and founder being distant from it
Time fixes everything
and this may just be

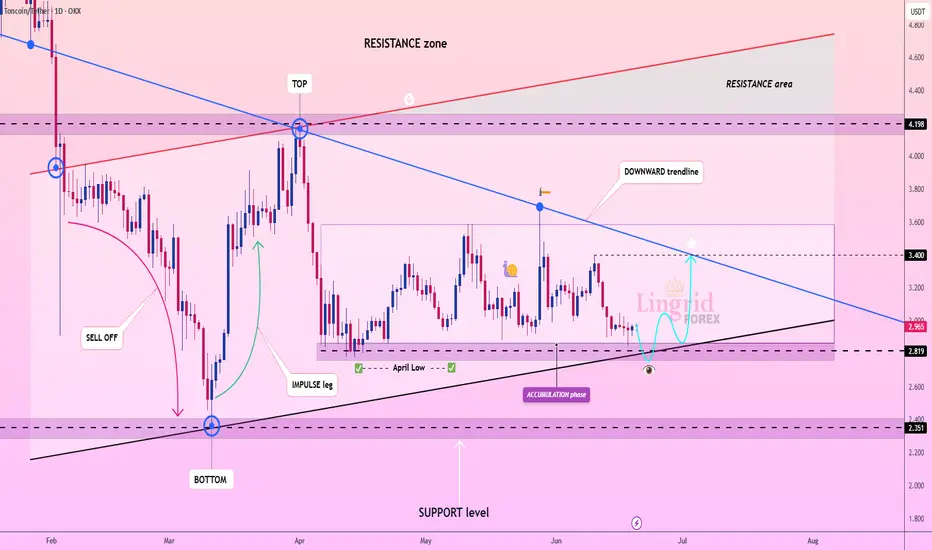
Lingrid | TONUSDT Mid-Term Market Structure AnalysisOKX:TONUSDT is holding just above the 2.82 support level while compressing into the apex of the downtrend and ascending support. Price action remains locked within a long accumulation range, but the bullish reaction near the black trendline hints at a potential reversal. A breakout above the downwa
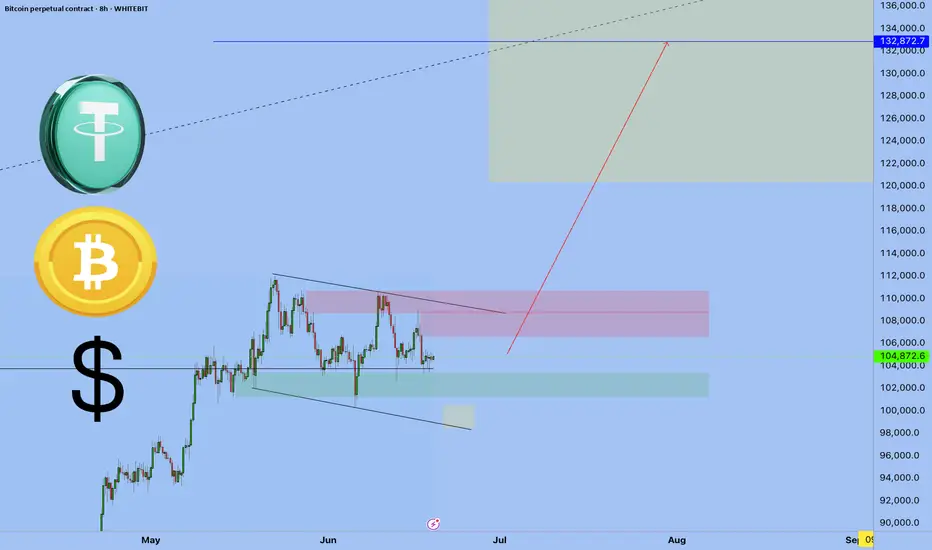
Bitcoin Triangle Pattern, Bullish or Bearish ?We can see LTF bitcoin create mini triangle pattern after downtrend, basically its called bearish triangle continuation. but lets see what is the side will be break
100k vs 107k

Dollar's Decline: Global Economic ShiftsYou're probably wondering why I'm talking about the dollar on the Bitcoin chart. It's because I want you to look a few steps ahead.
That's why this post is for people like that.
1. Global Economic Transformations: Collapse of the Jamaican Monetary System
Insights and Logic:
We are witnessin
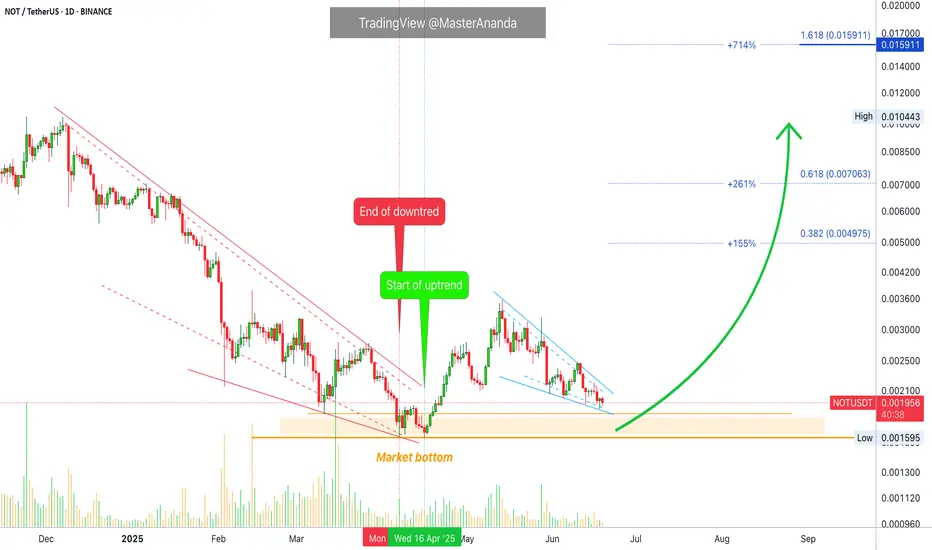
Notcoin, Get Ready For A New Bullish Wave; Never Give Up!You know these two tend to move together, Dogs and Notcoin. Also notice the strong similarities between the two charts.
Just for reference, DOGSUSDT I shared just a few minutes ago.
Past action
NOTUSDT (Notcoin) grew 125% as the initial bullish breakout in less than 1 month, 28 days. After the
See all crypto ideas
Gold - Pump to a new all-time high, buy here!GOLD is super bullish, and this trend should continue until around 7000 USD, so another few years! In one of my next analyses, I will tell you why. In this short-term analysis, we want to buy GOLD at the strong support of this blue ascending channel.
On the chart we can see that GOLD has been movin
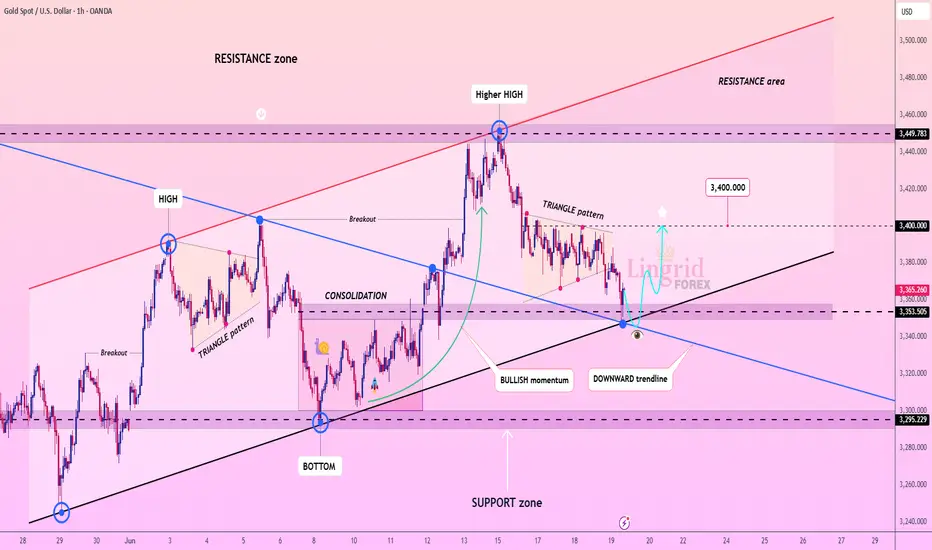
Lingrid | GOLD Post-FOMC Price Creates Trading OpportunityOANDA:XAUUSD is pulling back into the confluence zone between the black trendline and the 3,353–3,355 support, aligning with the breakout zone of a previous triangle pattern. Despite the drop, the overall structure remains bullish, especially if this retest holds. A bounce here would confirm the u
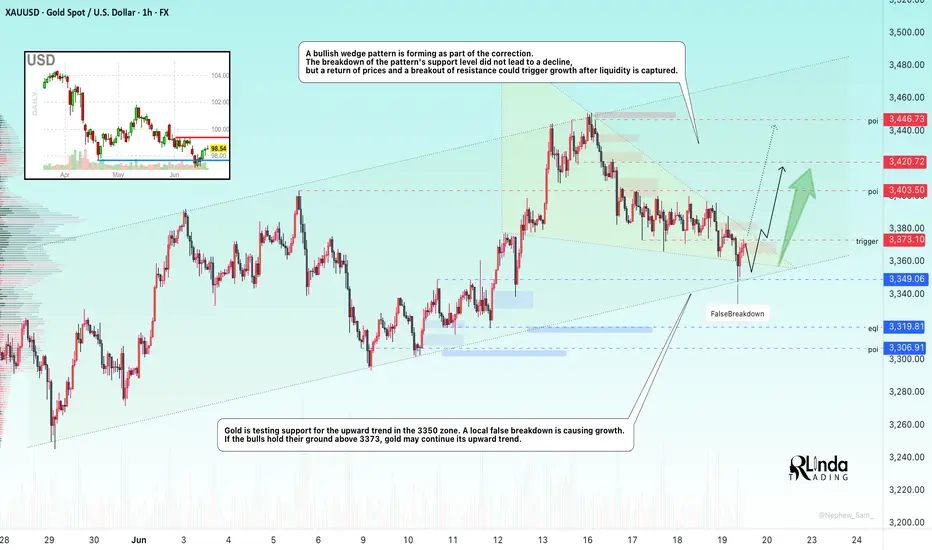
GOLD → Continuation of the global trend... To 3350?FX:XAUUSD is testing trend support within a correction. Against a complex fundamental backdrop (the Middle East, Fed comments, Trump's desire to lower rates), the price may continue to rise.
The price of gold rose from a weekly low of $3,363 on Thursday thanks to increased demand for safe-have
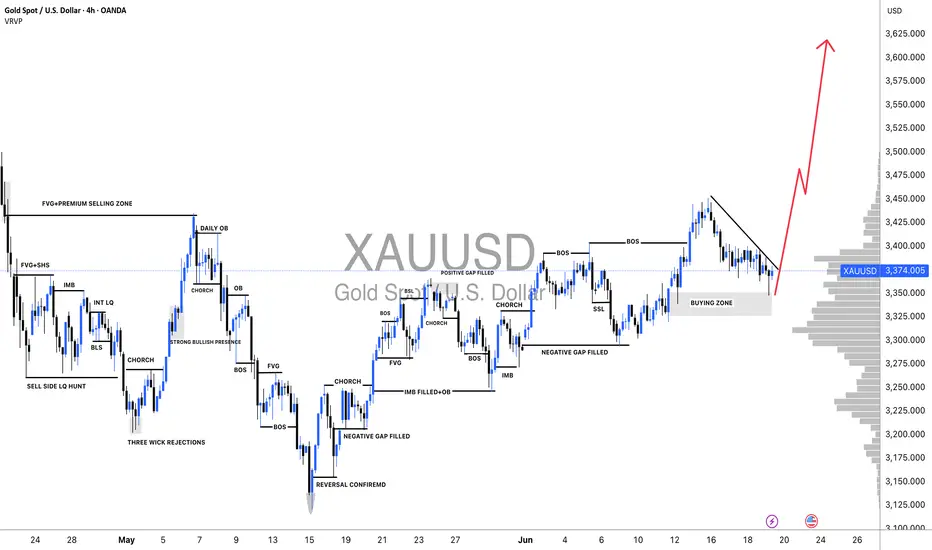
XAUUSD: Is Bullish Trend Ended? Or It is just beginning big moveAs we previously stated that price can reverse between 3340 to 3350 region, which was a pivotal point for bulls. Price smoothly moved currently trading at 3376 and possibly bullish move continuing towards 3400,3450 and ultimately reaching 3600.
Following the price’s all-time high at $3500, it expe
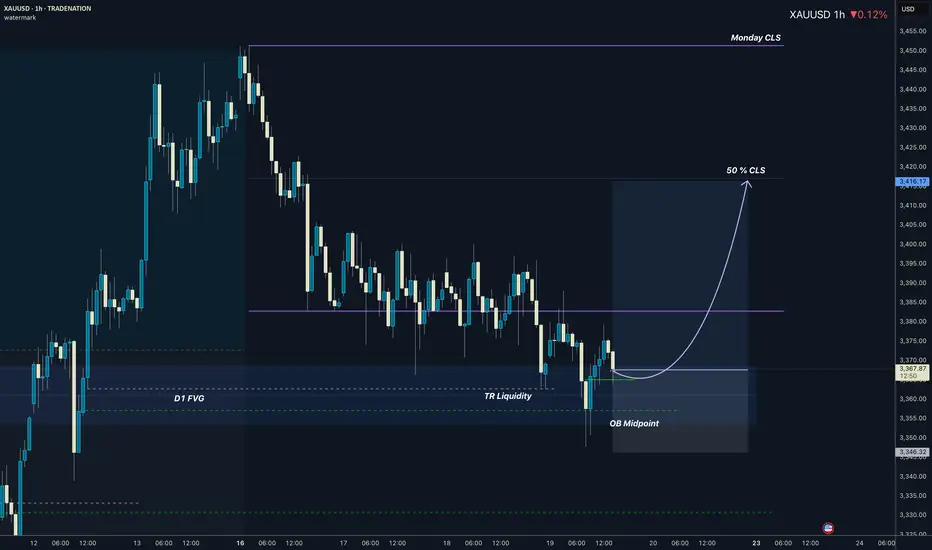
XAUUSD I Daily CLS I D1 FVG / OB Midpoint confluenceHey, Market Warriors, here is another outlook on this instrument
If you’ve been following me, you already know every setup you see is built around a CLS Footprint, a Key Level, Liquidity and a specific execution model.
If you haven't followed me yet, start now.
My trading system is completely
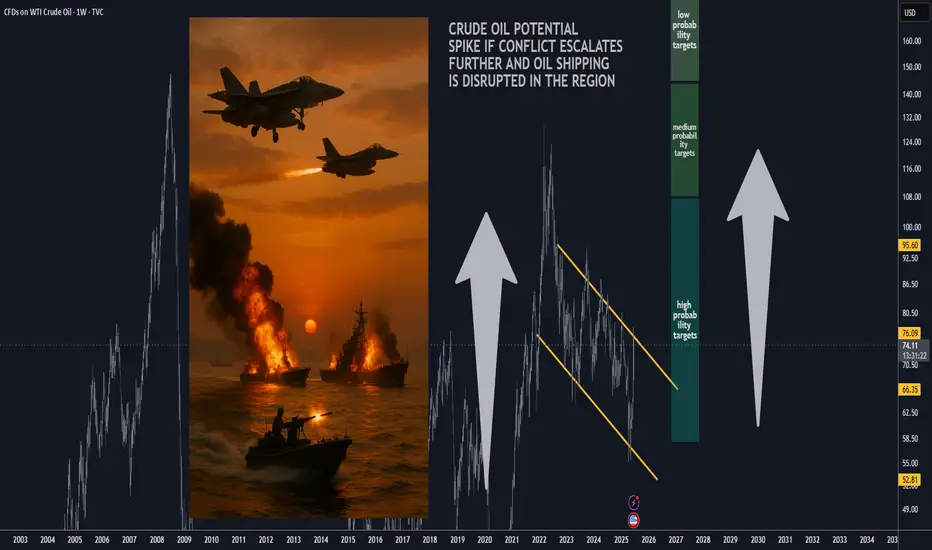
Can Crude Oil Spike to 150 USD / bbl ? Scenario Analysis.With Mid East tensions rising and overall unpredictable
situation around Strait of Hormuz, let's review potential
scenarios for the Crude Oil Prices. I've outlined three
scenarios with projected oil prices for each scenario below.
🚨 Market Alert: Israel-Iran Conflict Impact Forecast 📈
🔴 Worst-
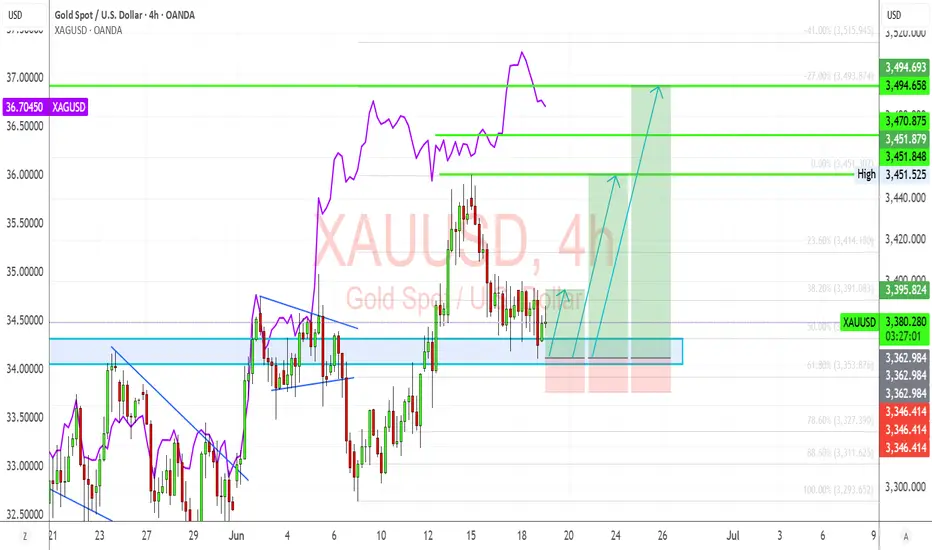
Gold Ready to Shine Again? Watch This Battle Zone Closely!Gold is consolidating above the 50% retracement (3372) after defending key structure at 3368–3378. Bullish momentum is building as Silver continues to lead, and the US Dollar (DXY) weakens post-FOMC. If buyers step in here, we could see a clean breakout toward 3415–3450 and beyond. But if 3368 break
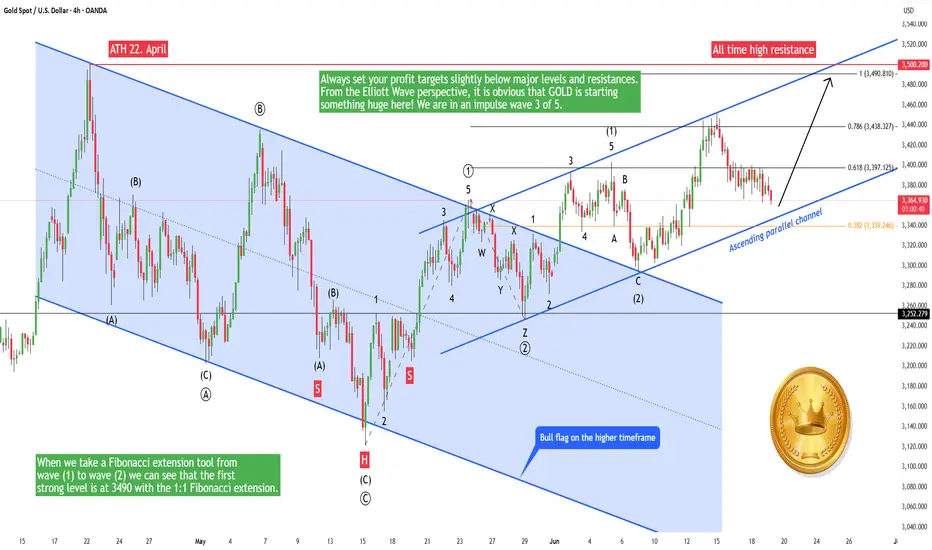
Hellena | GOLD (4H): LONG to resistance area of 3500 (Wave 3).Colleagues, the correction did take place and was quite deep, as I wrote earlier.
However, I am leaving my target unchanged—the resistance area and the maximum of wave “3” of the higher order at 3500.
The waves remain in their previous places, because none of the rules of wave analysis have been vio

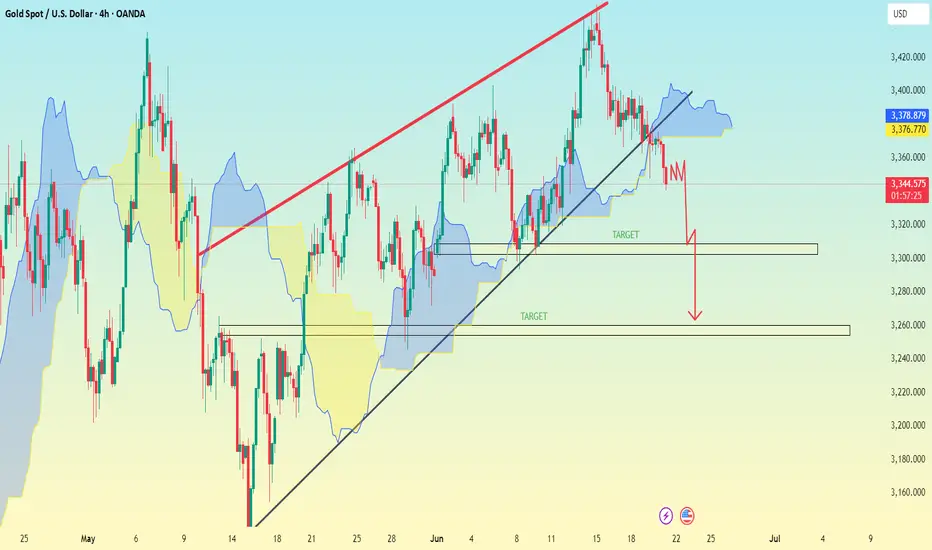
XAU/USD.4h chart pattern.XAU/USD (Gold vs US Dollar) on the 4-hour timeframe, and it indicates a bearish breakdown from an ascending triangle or wedge pattern. The trendline has been broken, and the price has moved below the Ichimoku cloud, supporting a bearish outlook.
📉 Bearish Targets Identified:
1. First Target Zone (
GOLD DAILY CHART UPDATEHey Everyone,
Great finish to the week across all our multi timeframe analysis.
We updated our 1H chart throughout the week catching the buys from the dips using our levels and ema5 cross and lock allowed us to track the movement with confirmation.
This is now an end of week update on our daily

See all futures ideas
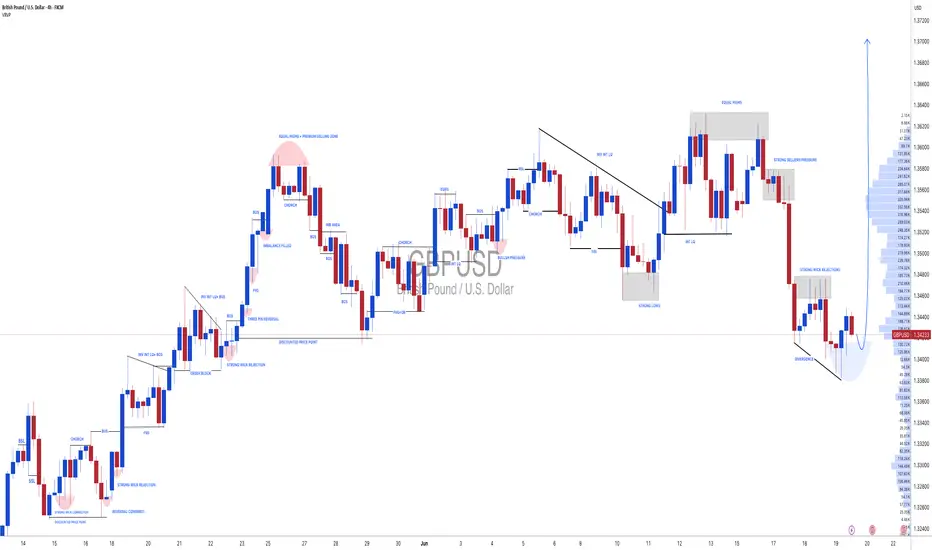
#GBPUSD: A strong bullish move incoming, comment your views The price has shown a possible price divergence, which could lead to a long-term move to 1.37. We expect the US dollar to weaken, which will likely push the price of GBPUSD to our target. Key economic data will be released later today and tomorrow, which could shape the price pattern.
Good luck and
EURUSD heads towards resistance, short-term reversal expectedEURUSD has been in a strong uptrend, and we’re currently observing price action is reaching a notable resistance zone. I am watching for a reversal here as marked on my chart, not expecting a major move, but rather a short-term rejection with a downside target at around 1.13670 , which also aligns

GBPJPY I Weekly CLS I Model 2 I H4 OB entry Hey, Market Warriors, here is another outlook on this instrument
If you’ve been following me, you already know every setup you see is built around a CLS Footprint, a Key Level, Liquidity and a specific execution model.
If you haven't followed me yet, start now.
My trading system is completely

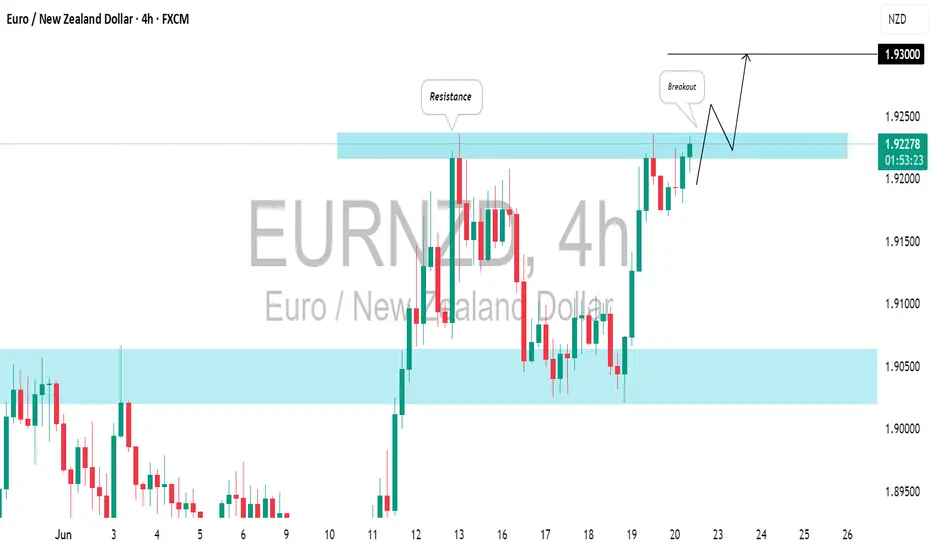
EURNZD: Waiting For Another BreakoutBased on the current trend, I believe you would concur that ⚠️EURNZD is likely to keep rising.
A bullish breakout above the highlighted blue resistance and a 4H candle closing above 1.9240 would
serve as a key confirmation, potentially driving prices up to 1.9300.
20.06.25 Morning ForecastPairs on Watch -
FX:EURJPY
FX:EURNZD
FX:EURUSD
A short overview of the instruments I am looking at for today, multi-timeframe analysis down to what I will be looking at for an entry. Enjoy!

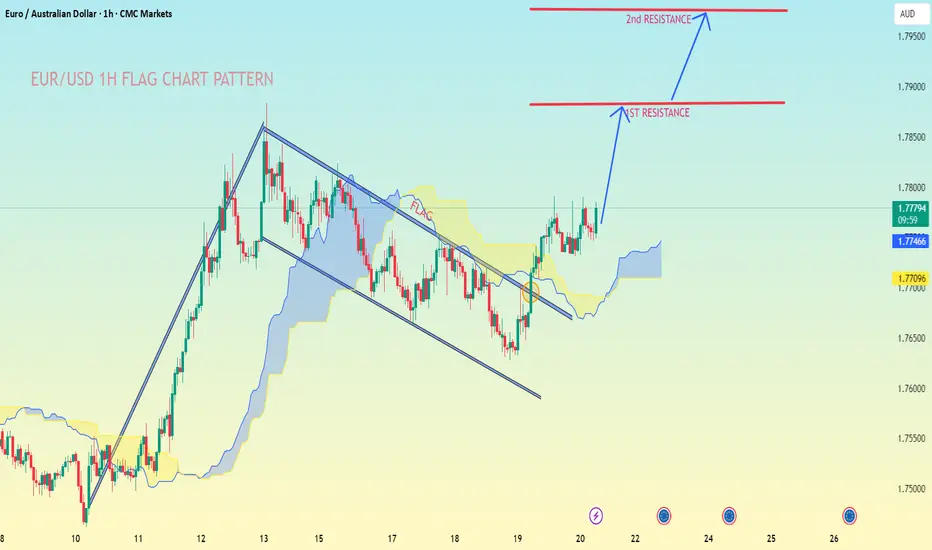
EUR/USD 1H FLAG CHART PATTERNEUR/AUD 1H (Euro/Australian Dollar), MY analyzing a bullish flag chart pattern, which is a continuation pattern following a strong uptrend. The price has broken out of the flag to the upside, indicating a potential continuation of the bullish move.
📈 Targets Based on the Chart:
1. First Resistanc
AUDUSD Analysis – Falling from the Rising WedgeAUDUSD pair broke below an ascending wedge, a bearish reversal pattern.
Clean rejection from 0.6518, with lower highs and new lower lows confirming bearish momentum.
Price is now sitting below former trendline support, retested and respected as resistance.
Bearish target points toward 0.6400–0.63

GBP/USD - For FOMC & Fed Interest RateThe GBP/USD pair on the M30 timeframe presents a Potential Buying Opportunity due to a recent Formation of a Channel Pattern. This suggests a shift in momentum towards the upside and a higher likelihood of further advances in the coming hours.
Possible Long Trade:
Entry: Consider Entering A Long

USD/JPY) Bearish reversal analysis Read The captionSMC trading point update
Technical analysis of USD/JPY 3-hour chart suggests a bearish reversal setup, based on smart money concepts (SMC), resistance rejection, and price action structure. Here's a full breakdown:
Technical Breakdown – USD/JPY
Big Resistance Zone (~145.800–146.300):
Pric

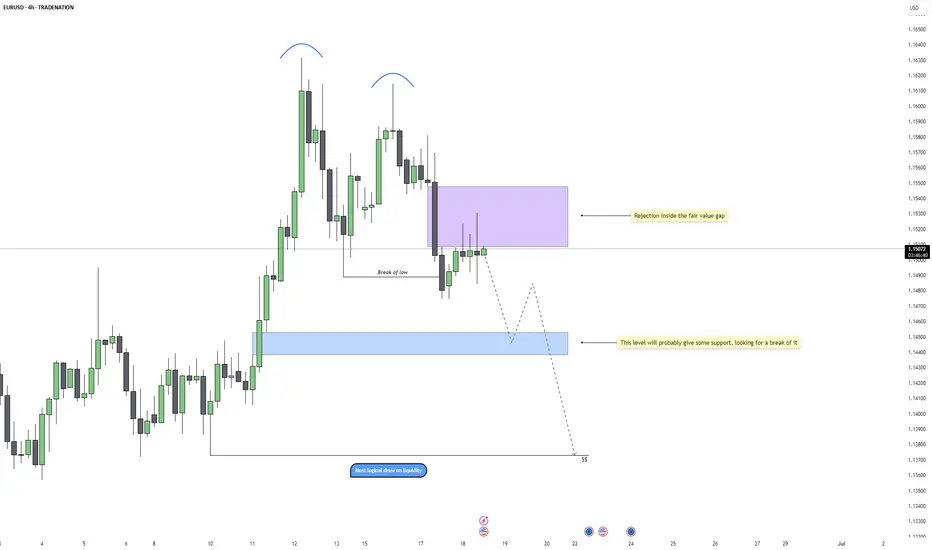
EURUSD - FVG Rejection and Bearish Continuation PlayEURUSD has been showing consistent bearish pressure on the 4H chart, with a clear shift in momentum after forming a double top near 1.162. That marked the beginning of a structural change, which was confirmed once price broke the most recent higher low. Since then, the market has transitioned into a
See all forex ideas
| - | - | - | - | - | - | - | ||
| - | - | - | - | - | - | - | ||
| - | - | - | - | - | - | - | ||
| - | - | - | - | - | - | - | ||
| - | - | - | - | - | - | - | ||
| - | - | - | - | - | - | - | ||
| - | - | - | - | - | - | - | ||
| - | - | - | - | - | - | - |
Trade directly on the supercharts through our supported, fully-verified and user-reviewed brokers.


