CRYPTO - Big Smackdown Then AltSeason ?The Crypto Cycle Gurus are telling us that AltSeason is just around the corner since the expected 4 year cycle completion is just a few months away...
But are they correct or is there a twist in the tale ?
Here's a 10 minute video to show a potential twist.
There might just be a DEEP dip buy oppo

The best trades require research, then commitment.
Get started for free$0 forever, no credit card needed

Scott "Kidd" PoteetThe unlikely astronaut

Where the world does markets
Join 100 million traders and investors taking the future into their own hands.

TradingView Show: New Trade Ideas and The Leap TradeStationJoin us for a timely TradingView live stream with David Russell, Head of Global Market Strategy at TradeStation, as we break down the latest rebound in the markets and what it could mean for traders and investors. In this session, we’ll dive into:
- The upcoming Fed meeting and what policymakers

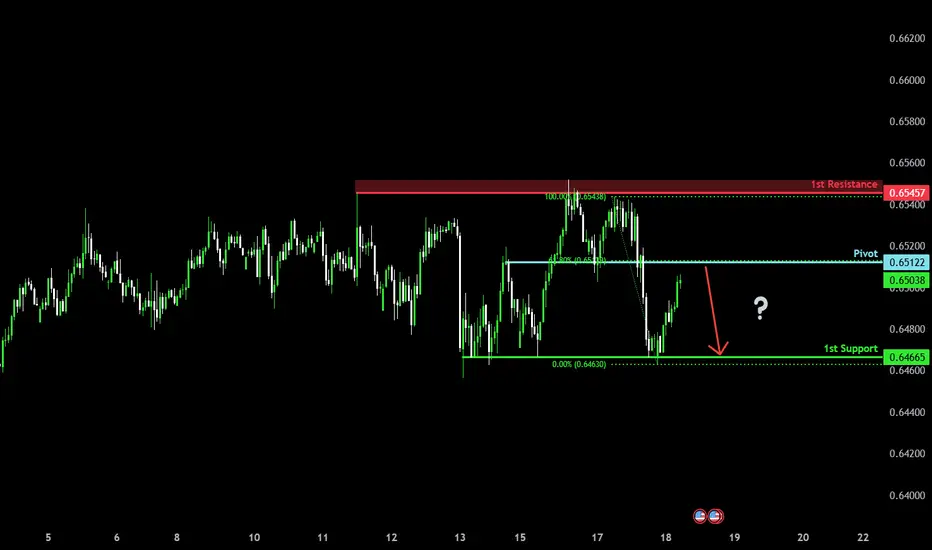
Major resistance ahead?The Aussie (AUD/USD) is rising towards the pivot which has been identified as an overlap resistance and could reverse to the 1st support.
Pivot: 0.6512
1st Support: 0.6466
1st Resistance: 0.6545
Risk Warning:
Trading Forex and CFDs carries a high level of risk to your capital and you should only
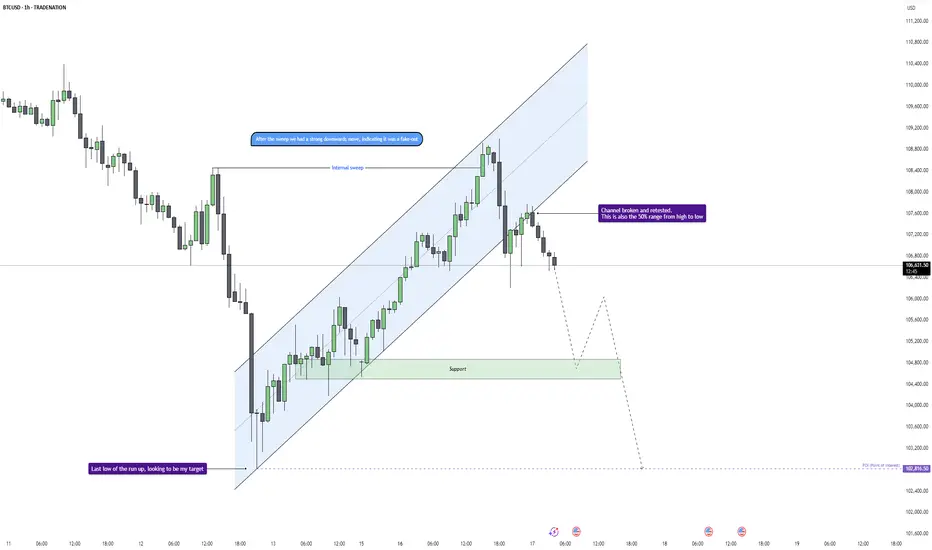
Bitcoin - Trend Shift Confirmed, Eyes on $102.8K LiquidityMarket Context
Bitcoin showed signs of exhaustion after a strong short-term rally within a clean upward channel on the 1H chart. Price action had been respecting the trend structure until a key deviation occurred near $108,500, where we saw an internal liquidity sweep that hinted at potential distr
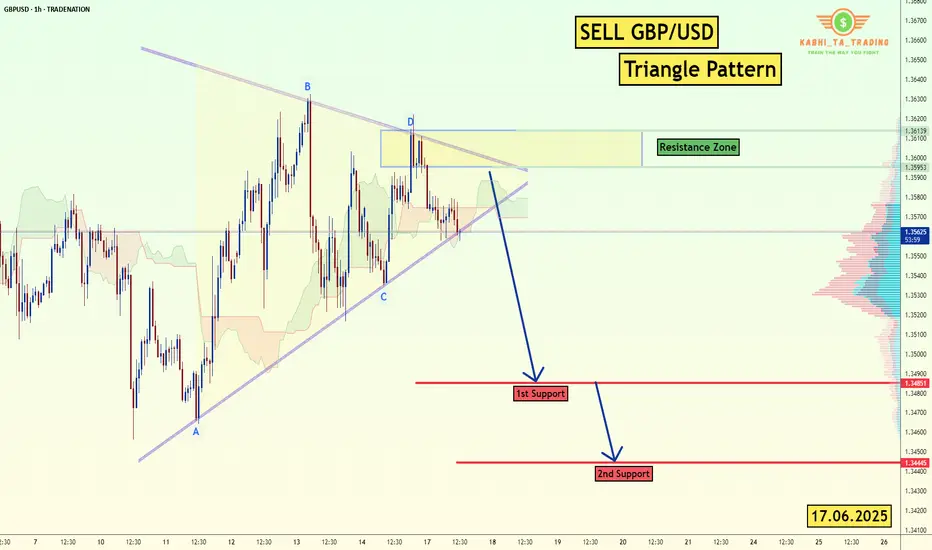
GBP/USD - H1-Triangle Breakout (17.06.2025)The GBP/USD Pair on the H1 timeframe presents a Potential Selling Opportunity due to a recent Formation of a Triangle Breakout Pattern. This suggests a shift in momentum towards the downside in the coming hours.
Possible Short Trade:
Entry: Consider Entering A Short Position around Trendline O
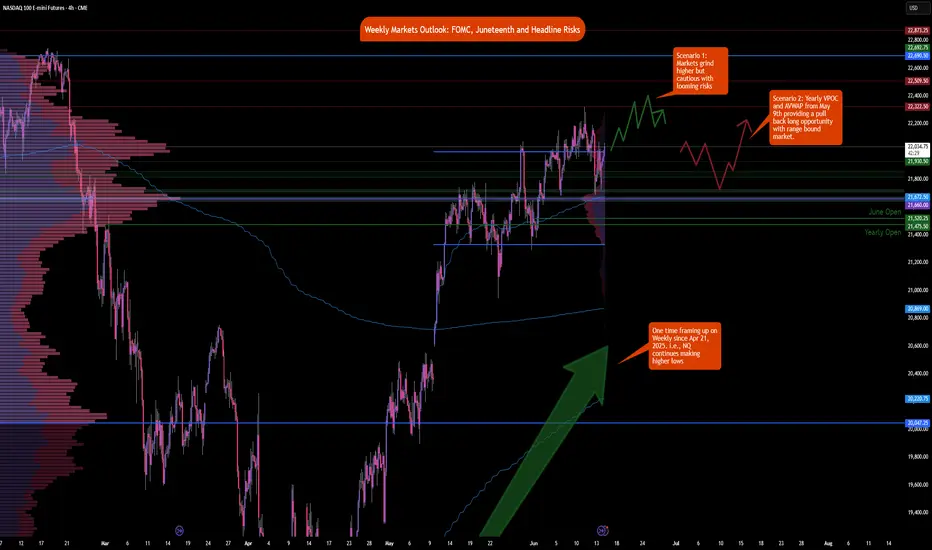
Weekly Market Outlook: FOMC, Trade Deals and GeopoliticsIt is a holiday-shortened week, with the majority of markets halting early on Thursday, June 19, 2025, in observance of Juneteenth. See here for holiday trading schedule
Key Themes to Monitor This Week
Geopolitical Risks
Any outside intervention in the ongoing Israel-Iran conflict will like
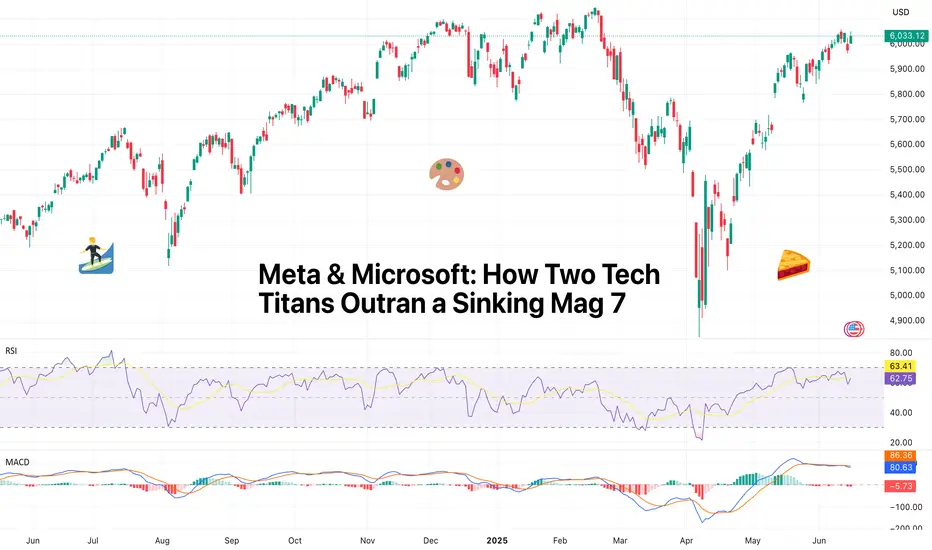
Meta & Microsoft: How Two Tech Titans Outran a Sinking Mag 7Forget about the Magnificent Seven and say hello to M&M — the only two winners of the year so far.
If you blinked during the first half of 2025, you might’ve missed it: the mighty Magnificent Seven are starting to look more like a Scraggly Five. While Tesla NASDAQ:TSLA fumbled its autonomy narra
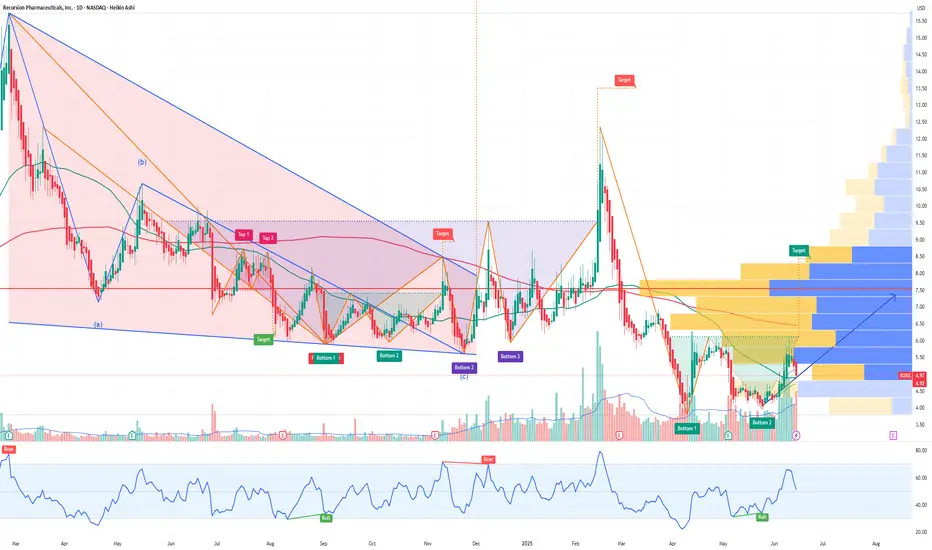
Why Recursion Pharmaceuticals RXRX Could Be the NVDA of BiotechRecursion Pharmaceuticals RXRX is rapidly emerging as a transformative force in drug discovery, leveraging cutting-edge artificial intelligence and automation to industrialize and accelerate the development of new medicines. Here’s why RXRX could be the next NVIDIA (NVDA) of biotechnology and why it
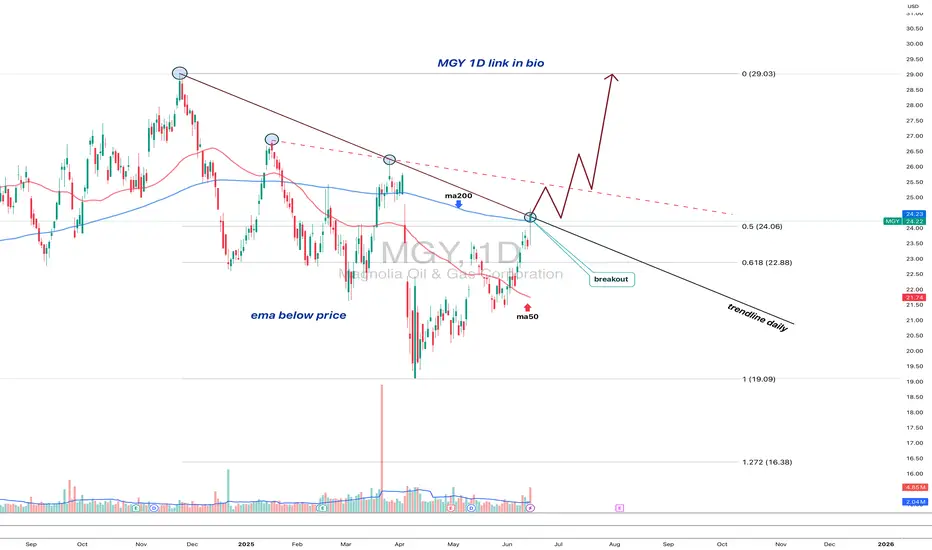
MGY: Technical Breakout + Fundamental Momentum = Quiet Winner?Magnolia Oil & Gas (MGY) is showing one of the cleanest technical breakouts in the energy sector — and the market hasn’t priced it in yet. After months of pressure, price has broken above both the 50-day and 200-day moving averages with rising volume, signaling a clear phase shift from distribution
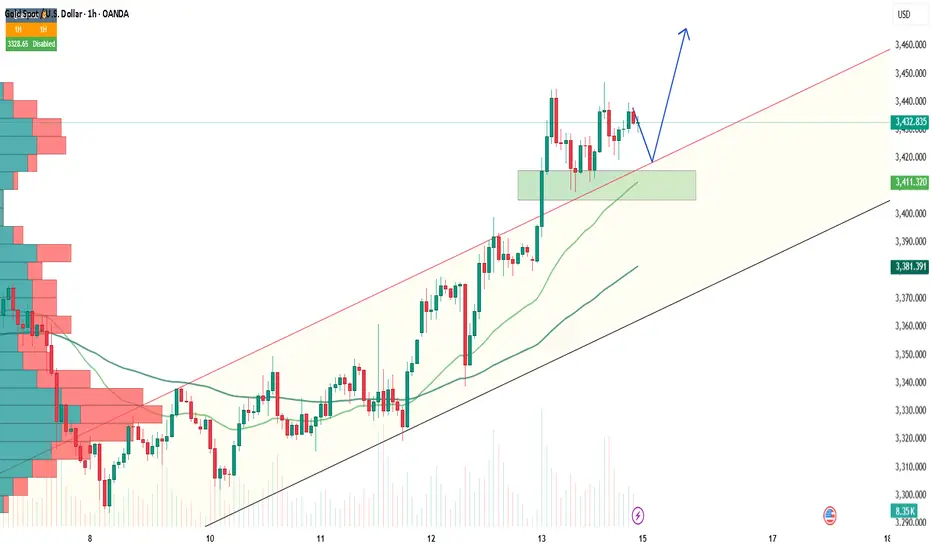
Gold Takes the Throne as Safe Haven AgainThe recent escalation in the Middle East — particularly Israel’s surprise strike on Iran — has stirred up significant volatility in global financial markets. Oil prices surged, stock markets around the world turned red, just as many had predicted. However, in a surprising twist, capital did not rush
See all editors' picks ideas
Trend Impulse Channels (Zeiierman)█ Overview
Trend Impulse Channels (Zeiierman) is a precision-engineered trend-following system that visualizes discrete trend progression using volatility-scaled step logic. It replaces traditional slope-based tracking with clearly defined “trend steps,” capturing directional momentum only when

Magnificent 7 OscillatorThe Magnificent 7 Oscillator is a sophisticated momentum-based technical indicator designed to analyze the collective performance of the seven largest technology companies in the U.S. stock market (Apple, Microsoft, Alphabet, Amazon, NVIDIA, Tesla, and Meta). This indicator incorporates established

SmartPhase Analyzer📝 SmartPhase Analyzer – Composite Market Regime Classifier
SmartPhase Analyzer is an adaptive regime classification tool that scores market conditions using a customizable set of statistical indicators. It blends multiple normalized metrics into a composite score, which is dynamically evaluated

ATR RopeATR Rope is inspired by DonovanWall's "Range Filter". It implements a similar concept of filtering out smaller market movements and adjusting only for larger moves. In addition, this indicator goes one step deeper by producing actionable zones to determine market state. (Trend vs. Consolidation)
>

Langlands-Operadic Möbius Vortex (LOMV)Langlands-Operadic Möbius Vortex (LOMV)
Where Pure Mathematics Meets Market Reality
A Revolutionary Synthesis of Number Theory, Category Theory, and Market Dynamics
🎓 THEORETICAL FOUNDATION
The Langlands-Operadic Möbius Vortex represents a groundbreaking fusion of three profound mathematic

Risk-Adjusted Momentum Oscillator# Risk-Adjusted Momentum Oscillator (RAMO): Momentum Analysis with Integrated Risk Assessment
## 1. Introduction
Momentum indicators have been fundamental tools in technical analysis since the pioneering work of Wilder (1978) and continue to play crucial roles in systematic trading strategies (Jeg

TrendMaster Pro 2.3 with Alerts
Hello friends,
A member of the community approached me and asked me how to write an indicator that would achieve a particular set of goals involving comprehensive trend analysis, risk management, and session-based trading controls. Here is one example method of how to create such a system:
Core

Support and Resistance Logistic Regression | Flux Charts💎 GENERAL OVERVIEW
Introducing our new Logistic Regression Support / Resistance indicator! This tool leverages advanced statistical modeling "Logistic Regressions" to identify and project key price levels where the market is likely to find support or resistance. For more information about the proc

Mandelbrot-Fibonacci Cascade Vortex (MFCV)Mandelbrot-Fibonacci Cascade Vortex (MFCV) - Where Chaos Theory Meets Sacred Geometry
A Revolutionary Synthesis of Fractal Mathematics and Golden Ratio Dynamics
What began as an exploration into Benoit Mandelbrot's fractal market hypothesis and the mysterious appearance of Fibonacci sequences i

EMD Trend [InvestorUnknown]EMD Trend is a dynamic trend-following indicator that utilizes Exponential Moving Deviation (EMD) to build adaptive channels around a selected moving average. Designed for traders who value responsive trend signals with built-in volatility sensitivity, this tool highlights directional bias, market

See all indicators and strategies
Community trends
Intel - The rally starts!Intel - NASDAQ:INTC - creates a major bottom:
(click chart above to see the in depth analysis👆🏻)
For approximately a full year, Intel has not been moving anywhere. Furthermore Intel now trades at the exact same level as it was a decade ago. However price is forming a solid bottom formation at

Short CRCLDon't normally play shorts, but this one is extremely over-valued here and I fancy a shot...
Circle pay Coinbase about 50% of their revenue, it's just a stablecoin which does not even keep all it's profits, yet it's market cap is not all that far off COIN's marketcap now.

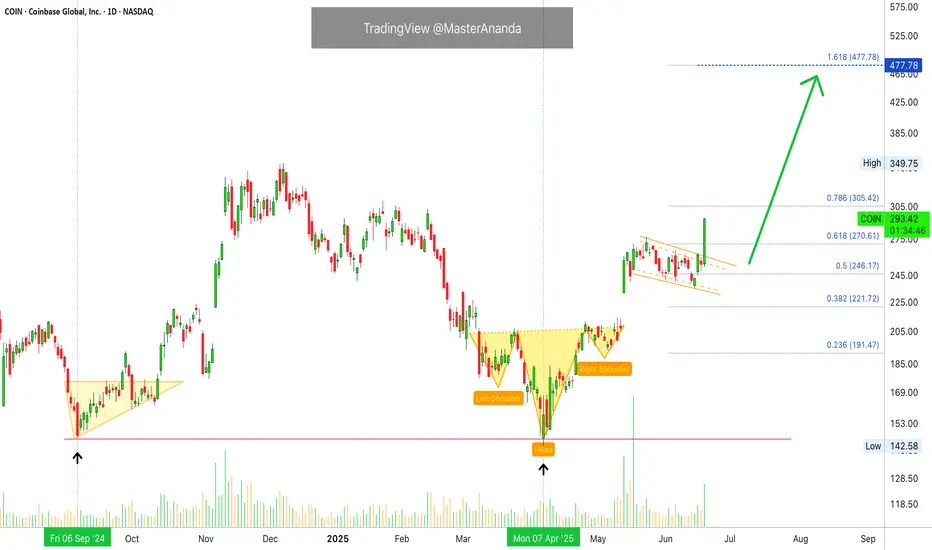
Coinbase Global Inc. Bullish Confirmed Confirms Bullish BitcoinCOIN's chart looks very similar to Ethereum. Today's action reveals something great; bullish confirmed.
Always, since this stock started trading, it has been moving as a unit together with Bitcoin and the entire Cryptocurrency market.
When Bitcoin is bullish, Coinbase is bullish.
When Bitcoin is b
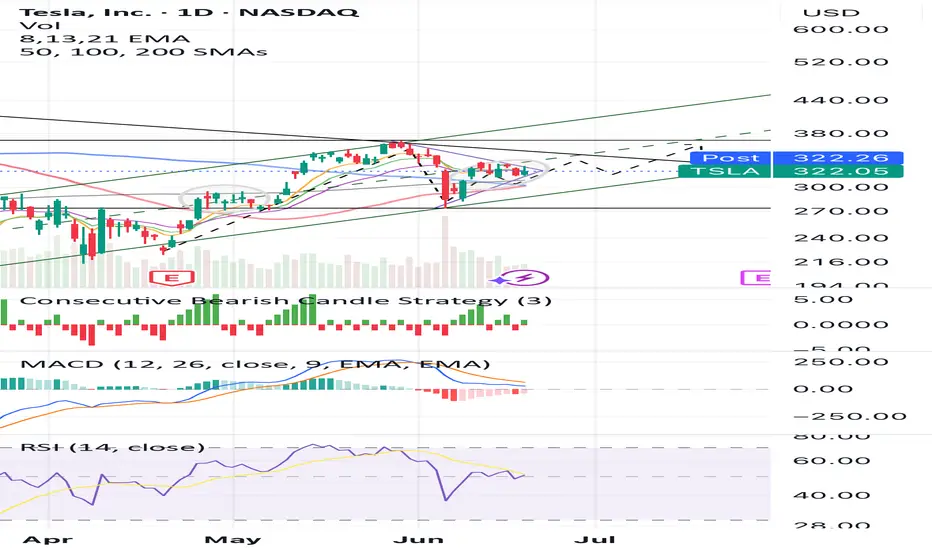
On the edge of bullish breakdownCurrent price is in a falling wedge and consolidating in 310-330 above 100 SMA within a long-term uptrend channel. Two grey circles mark previous & current consolidation zones - a clear attempt to highlight a repeating pattern that may lead to a breakout, just like in late April. MACD/RSI show signs
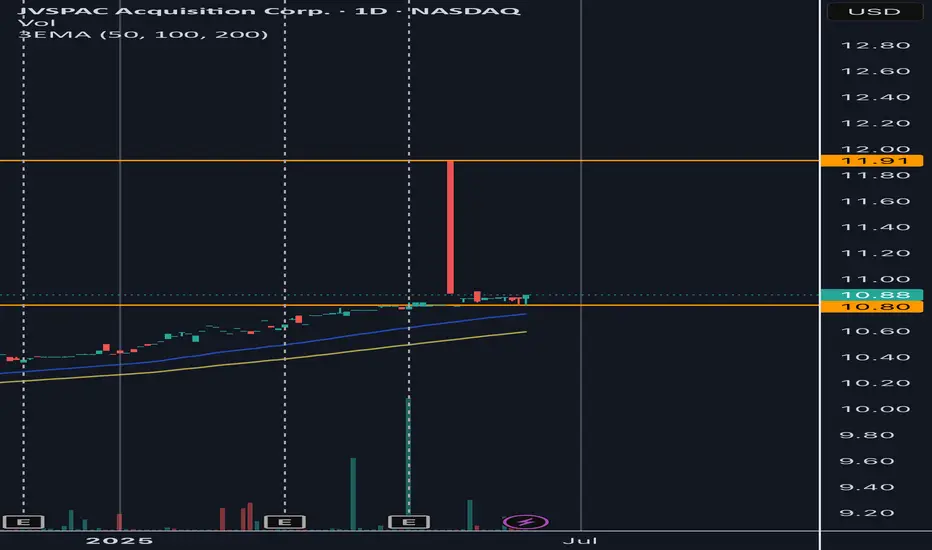
IPO soon…Spac may launch the price higher soon. At least 10-70% higher. But trade at your own risk. Sometimes prices drop as well because of market sentiments and price taking/ profit taking of founders/ early investors.
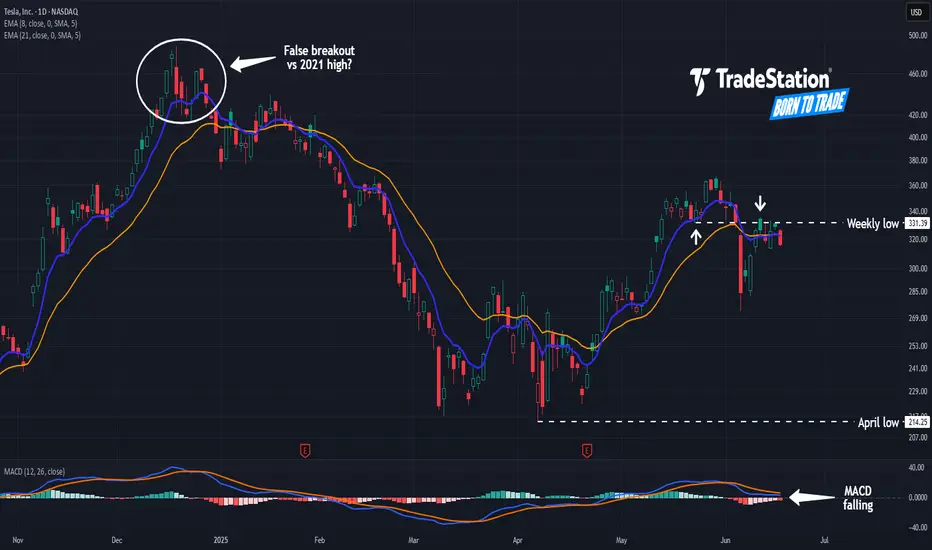
Tesla May Be StallingTesla bounced between early April and late May, but now it may be stalling.
The first pattern on today’s chart is the weekly low of $331.39 from May 22. TSLA fell below that level two weeks ago and was rejected at the same price area last week. Has old support become new resistance?
Second, the st
CLSK Going to $27There is always a downside, but I believe Risk vs Reward is here. It's not if, it's when. If we breakout to the downside of the triangle then we will test the support and the bottom of the wedge. If we break to the top of the triangle then we go for the breakout of the wedge and on the way to $27. I

Could Microstrategy be a 1 Trillion dollar mcap company?!Microstrategy and Michael Saylor evoke a spectrum of opinions, with analysts offering a diverse range of potential future valuations.
High risk, high reward!
The destiny of Microstrategy’s market capitalization is clearly linked to Bitcoin’s performance. The company has been utilizing debt to acqu

Will FedEx See a Big Swing Following Next Week’s Earnings?Shares of FedEx NYSE:FDX have often swung quite violently following release of the delivery-service giant's quarterly earnings. What does FDX’s chart and fundamental analysis say might happen after the firm reports results next Tuesday (June 24)?
Let’s check:
A History of Big Swings
Looking a

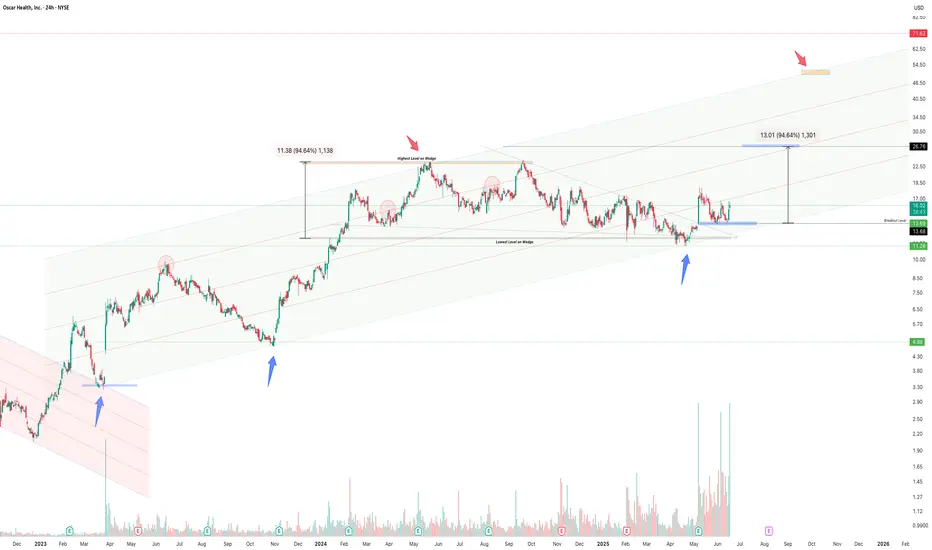
Oscar Health Bullish Continuation Oscar Health has broken out of a long descending wedge and is now resuming its broader bullish channel trend. With volume surging and smart money signals appearing near key supports, the chart targets a 94% measured move to $26.76, with the possibility of continuation toward $50.00 if trend strength
See all stocks ideas
Today
QMCOQuantum Corporation
Actual
—
Estimate
−1.16
USD
Today
MEIMethode Electronics, Inc.
Actual
—
Estimate
0.00
USD
Tomorrow
ACNAccenture plc
Actual
—
Estimate
3.32
USD
Tomorrow
KMXCarMax Inc
Actual
—
Estimate
1.16
USD
Tomorrow
DRIDarden Restaurants, Inc.
Actual
—
Estimate
2.97
USD
Tomorrow
KRKroger Company (The)
Actual
—
Estimate
1.46
USD
Jun 23
EBFEnnis, Inc.
Actual
—
Estimate
0.37
USD
Jun 23
JRSHJerash Holdings (US), Inc.
Actual
—
Estimate
0.01
USD
See more events
Community trends
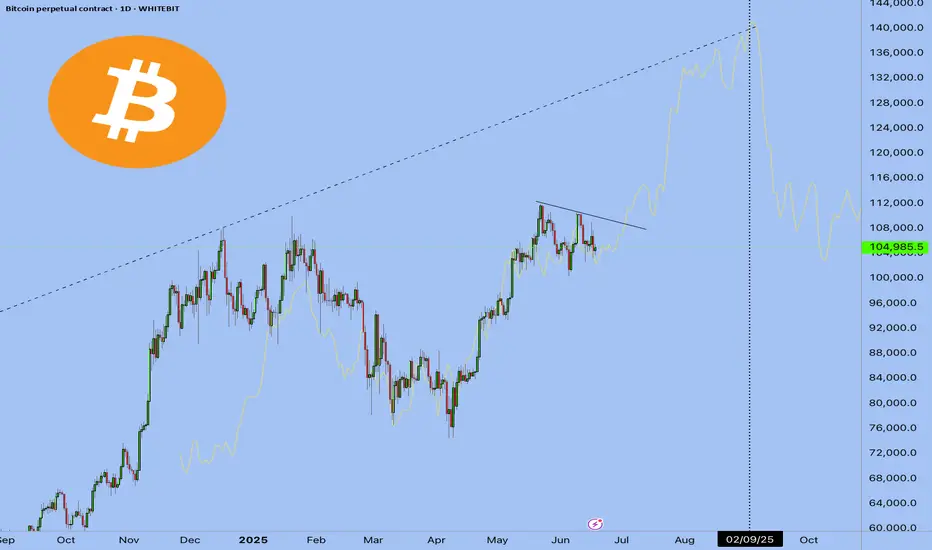
It's an Evacuation Through Green Candles💥 "One Last Leap of Faith?" - What Bitcoin Might Be Hiding Before September
The world’s on fire: Israel, Iran, Strait of Hormuz, oil, elections, the dollar, rates, black swan whispers.
And someone’s out here saying Bitcoin might still go up?
Yes. We are. Not because we believe - but because we see.
BTCUSD Analysis Today: Technical and On-Chain !In this video, I will share my BTCUSD analysis by providing my complete technical and on-chain insights, so you can watch it to improve your crypto trading skillset. The video is structured in 4 parts, first I will be performing my complete technical analysis, then I will be moving to the on-chain d

Bitcoin may rebound from support line of wedge and start to growHello traders, I want share with you my opinion about Bitcoin. Initially, the price was trading inside a well-defined range, moving sideways with repeated rejections from both support and resistance. After several attempts to stay above the support zone, BTC finally broke down and sharply declined b

CRYPTO - Big Smackdown Then AltSeason ?The Crypto Cycle Gurus are telling us that AltSeason is just around the corner since the expected 4 year cycle completion is just a few months away...
But are they correct or is there a twist in the tale ?
Here's a 10 minute video to show a potential twist.
There might just be a DEEP dip buy oppo
Bitcoin - Trend Shift Confirmed, Eyes on $102.8K LiquidityMarket Context
Bitcoin showed signs of exhaustion after a strong short-term rally within a clean upward channel on the 1H chart. Price action had been respecting the trend structure until a key deviation occurred near $108,500, where we saw an internal liquidity sweep that hinted at potential distr
Bitcoin Short-Term 1H Timeframe, Next Target ConfirmedWe have two drops on this chart. The one of the left is more extended and long lasting compared to the one on the right. When a move is sudden with major force, it tends to end suddenly as well.
The recent drop was very steep and the force needed to keep pushing prices lower cannot be maintained, i
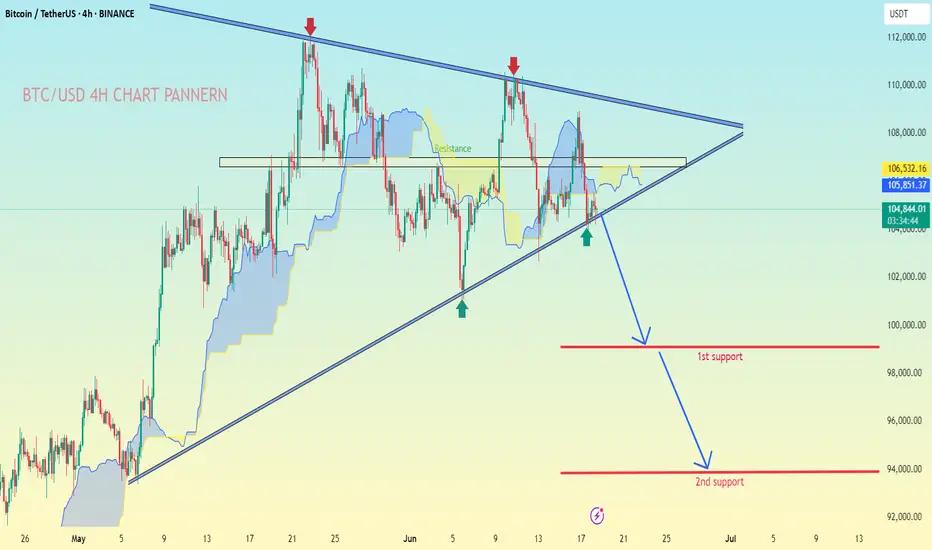
BTC/USD.4H CHART PATTERN.Based on MY BTC/USDT 4H chart the following analysis and price targets apply:
---
📉 Chart Pattern:
A symmetrical triangle pattern is visible, with price nearing a potential breakdown.
You’ve marked a breakdown scenario, supported by the Ichimoku cloud turning bearish and resistance rejection.
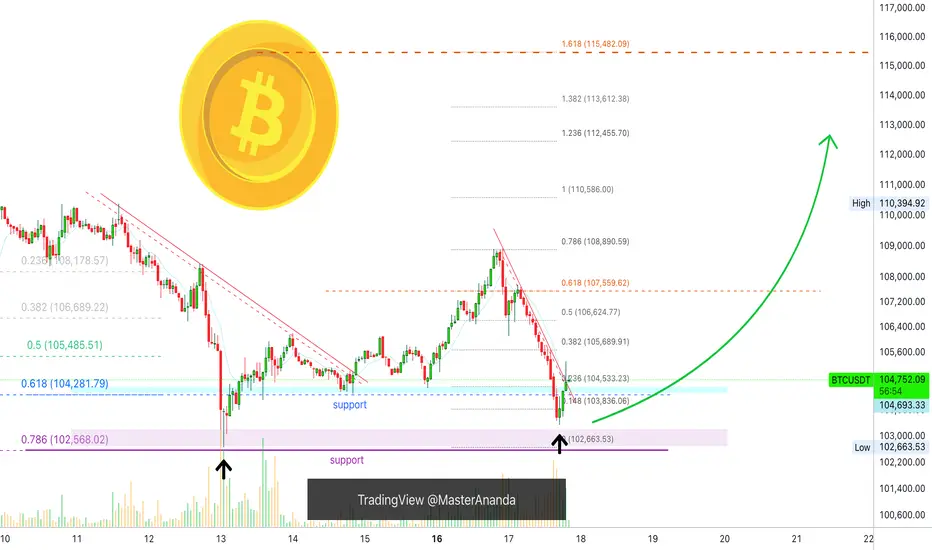
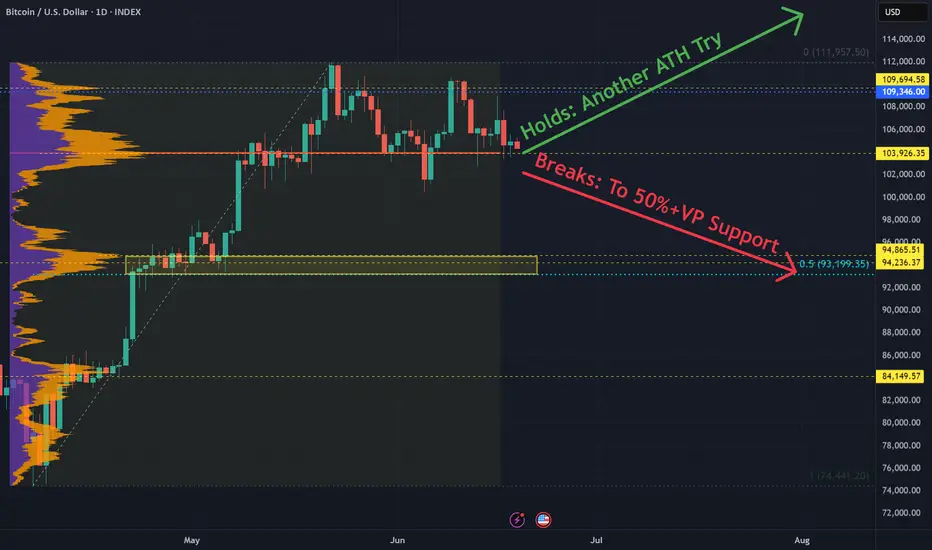
Will Bitcoin Try New All Time High?Bitcoin's Volume Profile Support at 103,900 is holding.
Hold here (again) and likely another test for new ATH.
Breaking it means retrace down to the 94k-93k 50% Retracement + Volume Profile region.
Then, time comes into play with the tried and tested Bitcoin Daily Ichimoku Cloud Strategy. If
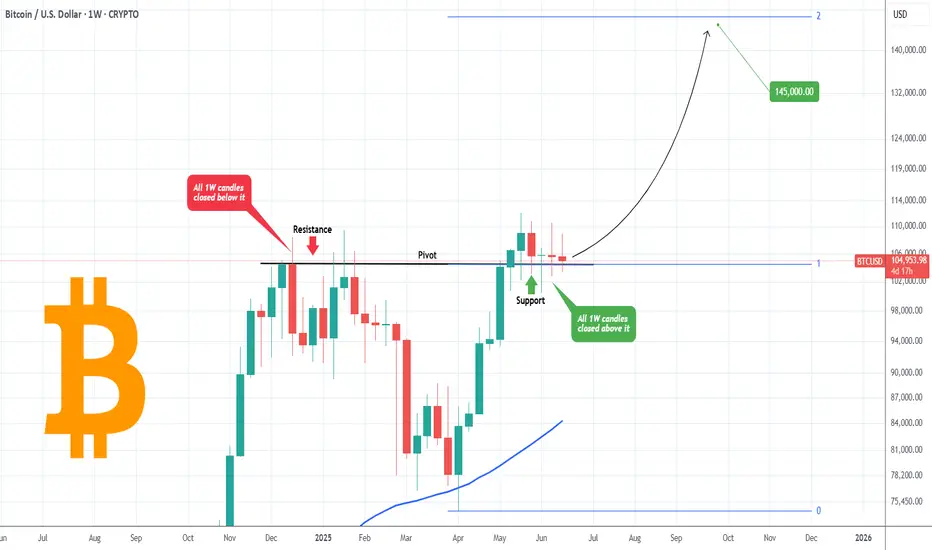
BITCOIN The secret trend-line that no one notices..Bitcoin (BTCUSD) was under heavy selling pressure yesterday and even the 1D time-frame turned marginally bearish. What most seem to ignore however is the larger picture. On the 1W time-frame, BTC has managed to close the last 5 weeks above the Pivot trend-line.
What that trend-line is? It is the le
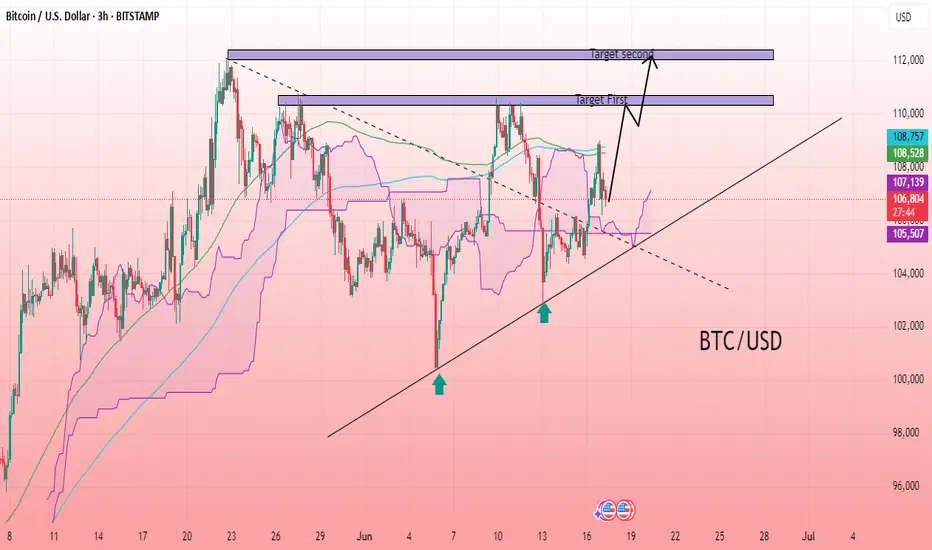
BTC/USD 3H CHART PATTERNThe BTC/USD 3-hour chart shows a bullish reversal forming from a higher low structure along a rising trendline, indicating increasing buyer strength. Price action has broken above the Ichimoku cloud and is now testing resistance levels, suggesting bullish momentum. The chart also highlights confluen
See all crypto ideas
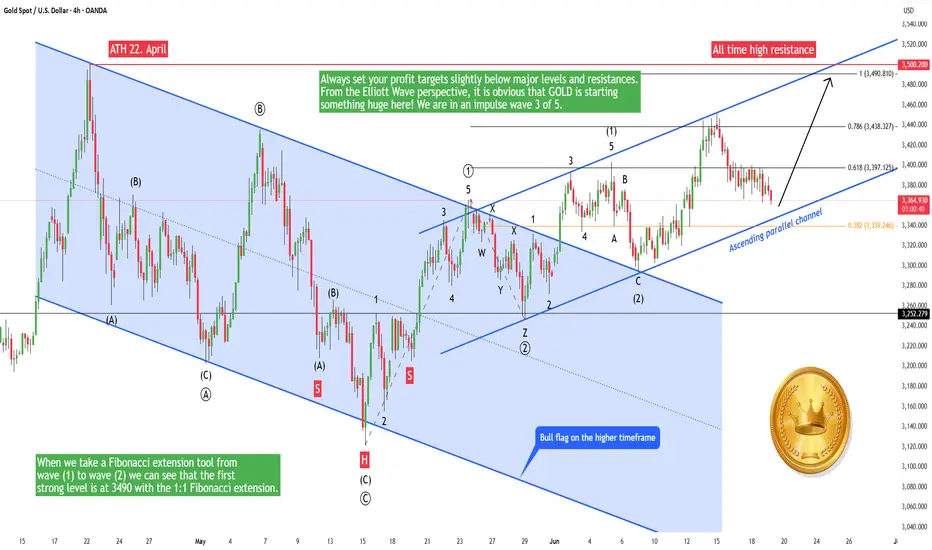
Gold - Pump to a new all-time high, buy here!GOLD is super bullish, and this trend should continue until around 7000 USD, so another few years! In one of my next analyses, I will tell you why. In this short-term analysis, we want to buy GOLD at the strong support of this blue ascending channel.
On the chart we can see that GOLD has been movin
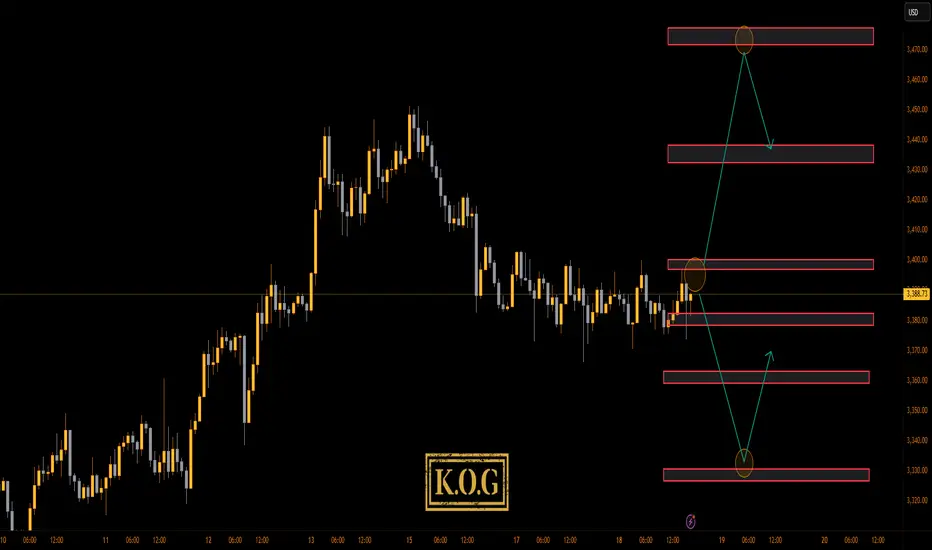
THE KOG REPORT - FOMCTHE KOG REPORT – FOMC
This is our view for FOMC, please do your own research and analysis to make an informed decision on the markets. It is not recommended you try to trade the event if you have less than 6 months trading experience and have a trusted risk strategy in place. The markets are extr
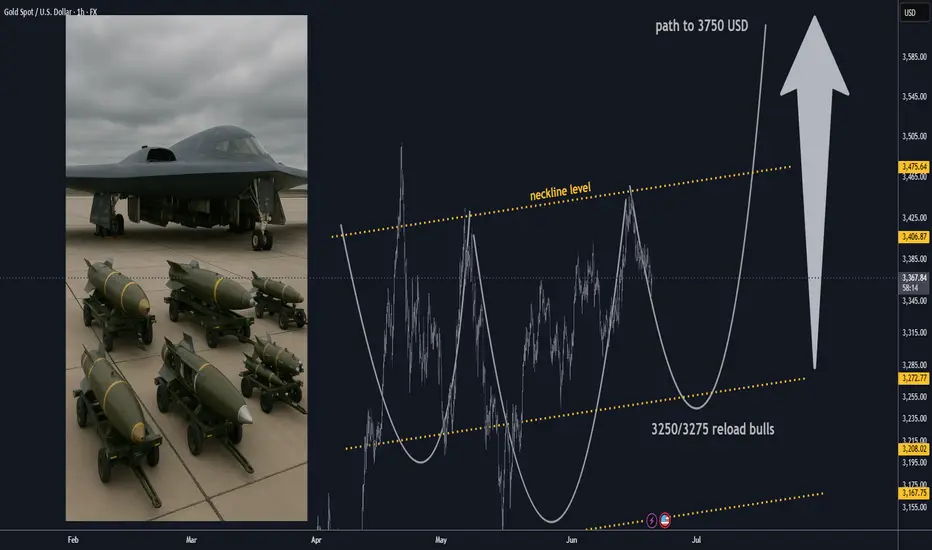
Gold Market Update: Bulls Will target 3750 USD after 3500 USD🏆 Gold Market Mid-Term Update (June 19, 2025)
📊 Price & Technical Outlook
Current Spot Price: ~$3,365
Technical Setup
Inverted H&S pattern forming/completed on higher timeframes — confirms bullish reversal structure.
Reload (buy) zone: $3,250–$3,275 (ideal accumulation range for bulls if price pu
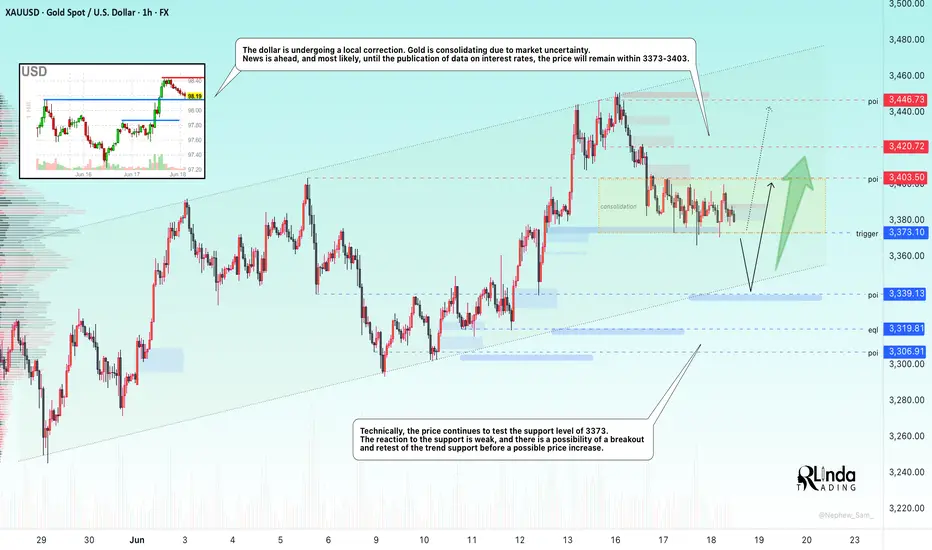
GOLD → Consolidation. Awaiting the FOMC meetingFX:XAUUSD is consolidating in the range of 3403 - 3373. The problem is that there is news ahead. FOMC and interest rate meeting. The market may react in any unpredictable way...
On Wednesday, the price of gold retreated from $3,400 as sentiment stabilized and investors focused on the upcoming
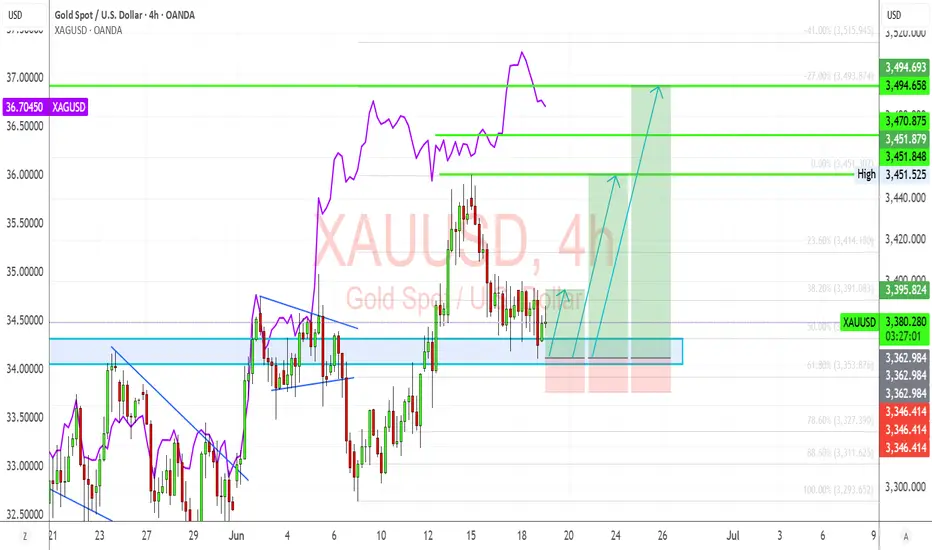
Hellena | GOLD (4H): LONG to resistance area of 3500 (Wave 3).Colleagues, the correction did take place and was quite deep, as I wrote earlier.
However, I am leaving my target unchanged—the resistance area and the maximum of wave “3” of the higher order at 3500.
The waves remain in their previous places, because none of the rules of wave analysis have been vio

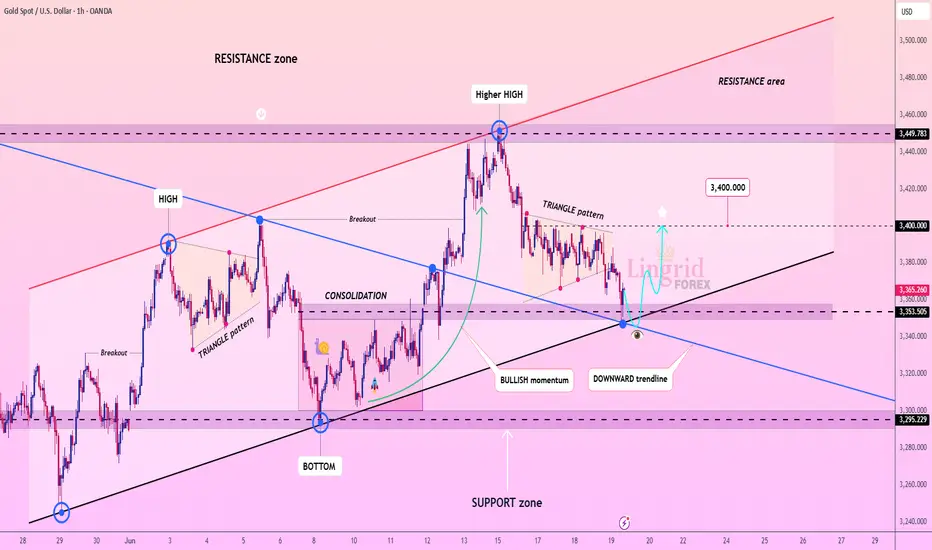
Lingrid | GOLD Post-FOMC Price Creates Trading OpportunityOANDA:XAUUSD is pulling back into the confluence zone between the black trendline and the 3,353–3,355 support, aligning with the breakout zone of a previous triangle pattern. Despite the drop, the overall structure remains bullish, especially if this retest holds. A bounce here would confirm the u
XAU/USD) Back Bullish trand Read The captionSMC Trading point update
Technical analysis of Gold (XAU/USD) on the 3-hour timeframe based on a price action setup within a rising channel and a key support zone. Here's a breakdown of the analysis:
---
Technical Overview:
Trend Structure:
The price is moving within a rising channel (marke

Gold Ready to Shine Again? Watch This Battle Zone Closely!Gold is consolidating above the 50% retracement (3372) after defending key structure at 3368–3378. Bullish momentum is building as Silver continues to lead, and the US Dollar (DXY) weakens post-FOMC. If buyers step in here, we could see a clean breakout toward 3415–3450 and beyond. But if 3368 break
HelenP. I Gold can rise to resistance level and drop to $3325Hi folks today I'm prepared for you Gold analytics. After a steady climb, the price began to lose momentum and eventually corrected back to the trend line. This zone acted as dynamic support and initiated a new wave of upward movement. However, unlike the previous impulse, the price started consolid

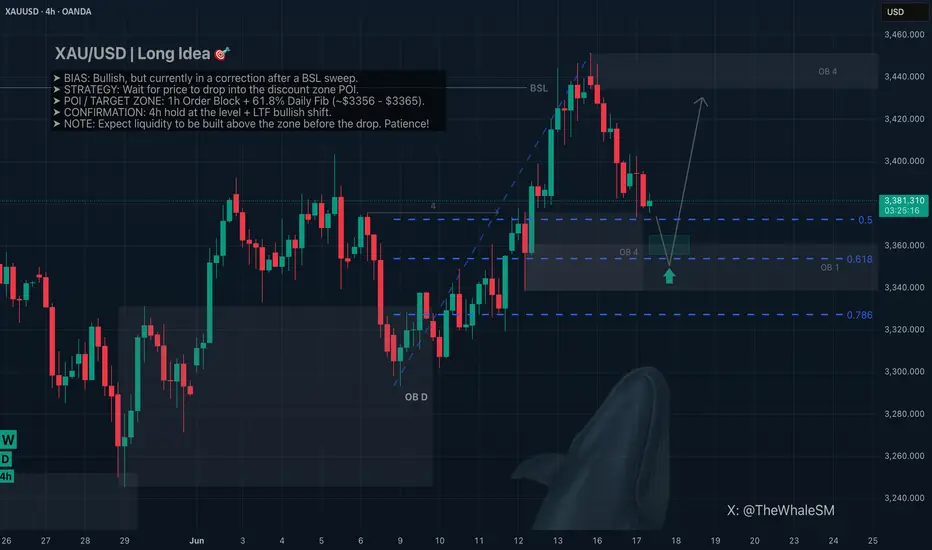
Gold's Next Move Up: Why I'm Waiting for This 1H Order Block.Hello, traders! 👋 Let's take a look at the current price action on Gold (XAU/USD).
📉 Current Situation: Correction Phase
After a strong impulse that swept the Buy Side Liquidity (BSL), Gold has entered a correction. This corrective move has a clear target below: a key 1-hour order block that ali
See all futures ideas
GBP/USD - For FOMC & Fed Interest RateThe GBP/USD pair on the M30 timeframe presents a Potential Buying Opportunity due to a recent Formation of a Channel Pattern. This suggests a shift in momentum towards the upside and a higher likelihood of further advances in the coming hours.
Possible Long Trade:
Entry: Consider Entering A Long

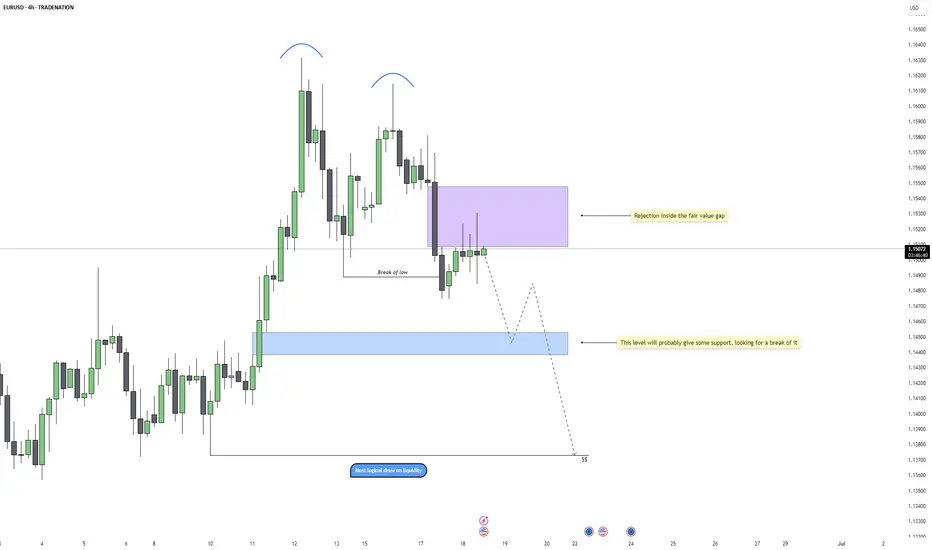
EURUSD - FVG Rejection and Bearish Continuation PlayEURUSD has been showing consistent bearish pressure on the 4H chart, with a clear shift in momentum after forming a double top near 1.162. That marked the beginning of a structural change, which was confirmed once price broke the most recent higher low. Since then, the market has transitioned into a
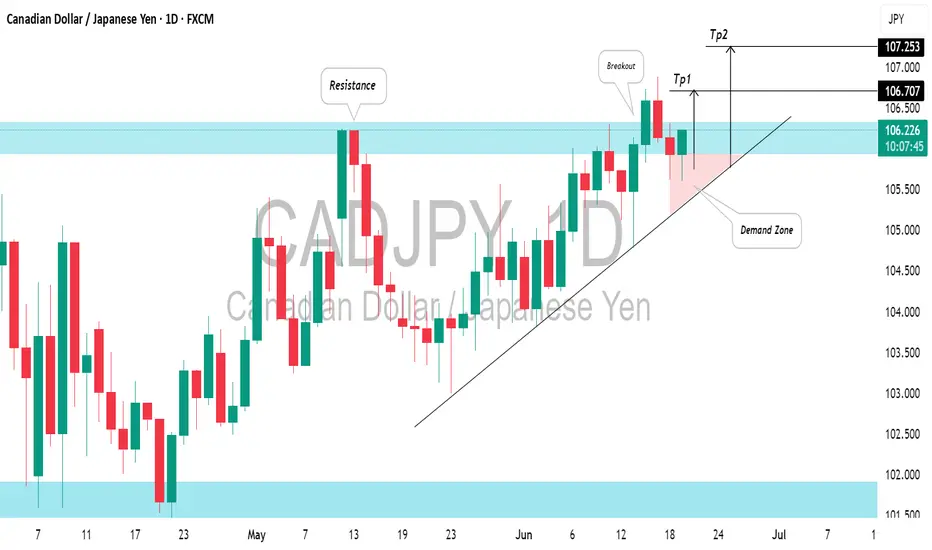
CADJPY: More Growth Ahead?!📈CADJPY broke above a key daily horizontal resistance yesterday.
The combination of this broken structure and an upward trend line creates a solid demand zone.
This area will be an ideal point to consider buying following a pullback, with the next target for buyers set at 107.27.
EUR/USD - Eyes on the major resistance at 1.1540!Introduction
The EUR/USD currency pair has been trending downward on the 1-hour timeframe, indicating that bearish momentum is firmly in control. In this analysis, I will outline what to expect from the pair moving forward, and highlight the high-confluence zone that could offer a potential short s
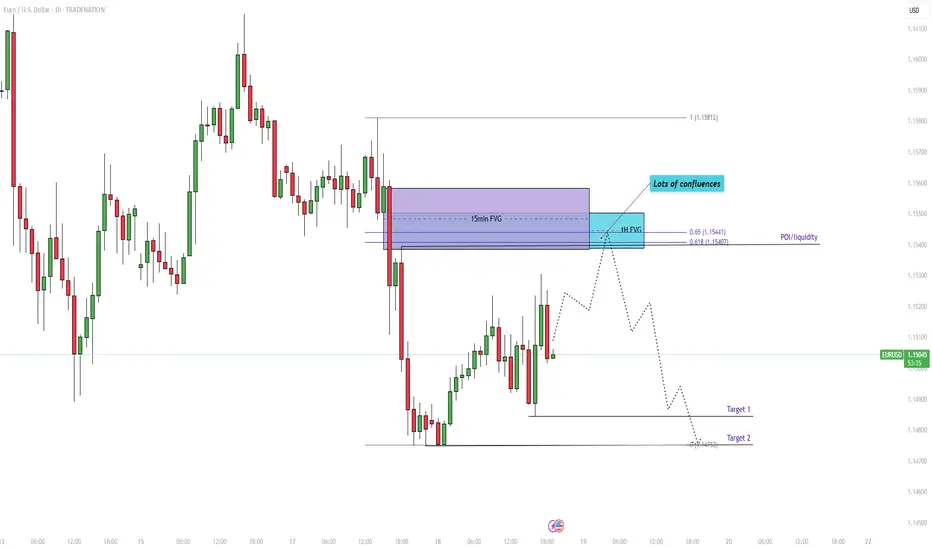
EURUSD trades turn their eyes towards upcoming Fed Interest rateEUR/USD has been trading sideways after peaking above 1.1600 last week, as traders adopt a wait and see approach ahead of the Fed's interest rate decision due tomorrow morning (AEST). The pair is consolidating within a tight range, with the top end of the recent rally now being questioned amid growi
19.06.25 Morning ForecastPairs on Watch -
FX:EURGBP
FX:EURAUD
FX:AUDNZD
A short overview of the instruments I am looking at for today, multi-timeframe analysis down to what I will be looking at for an entry. Enjoy!

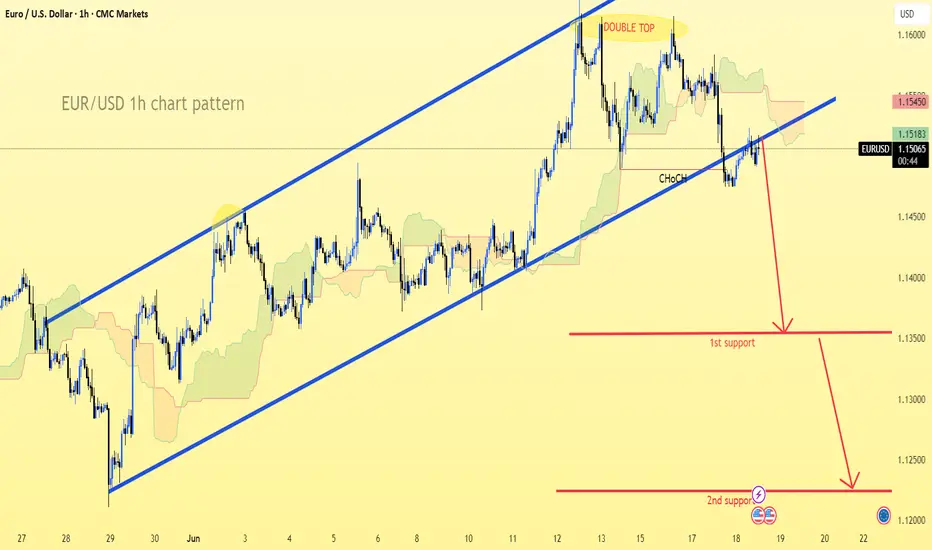
EUR/USD.1h chart pattern.Based on My target EUR/USD 1H, the price has broken down from the ascending channel and formed a Double Top, confirming a bearish structure. Here's the analysis based on the marked zones:
Bearish Targets:
1. First Support / Target 1: Around 1.13500
This aligns with a previous structure level and
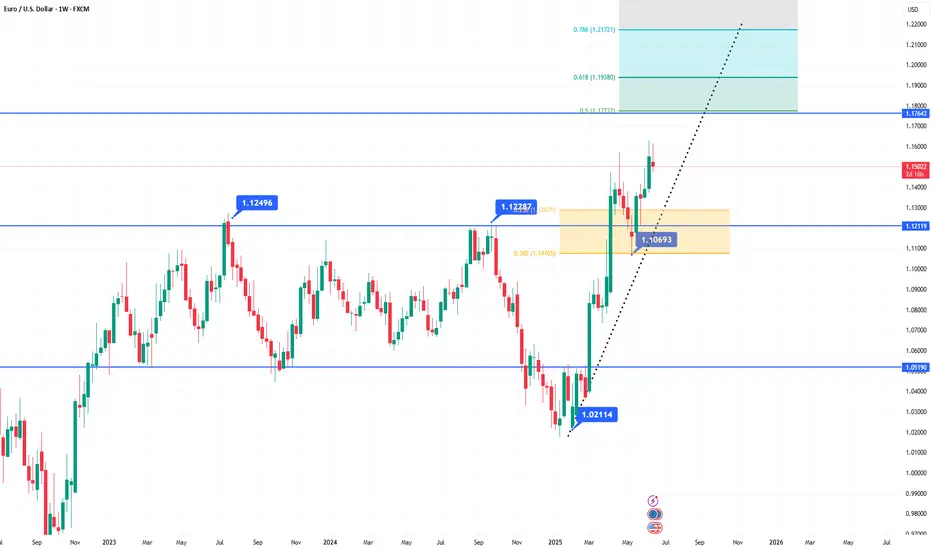
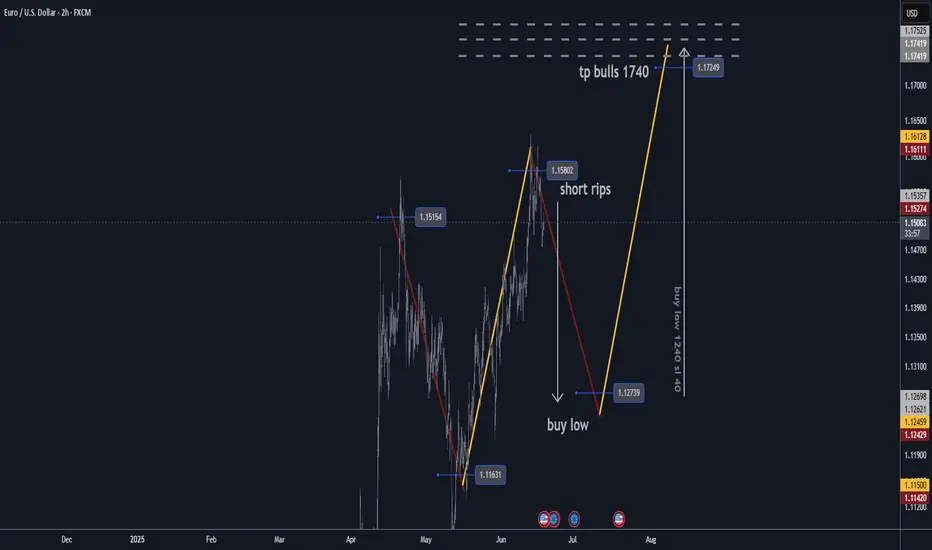
EURUSD H2 Best Levels to BUY/SELL and Market Update🏆 EURUSD Market Update m20 short-term trade
📊 Technical Outlook
🔸Short-term: BEARS 1275
🔸1500/1540 short sell rips/rallies
🔸Mid-Term outlook: BULLS 1750
🔸bulls buy low 1250/1275 reload
🔸bulls exit at 1750 swing trade
🔸Price Target Bears: 1250/1275
🔸Price Target Bulls: 1750
🌍 Macro & Political Driv
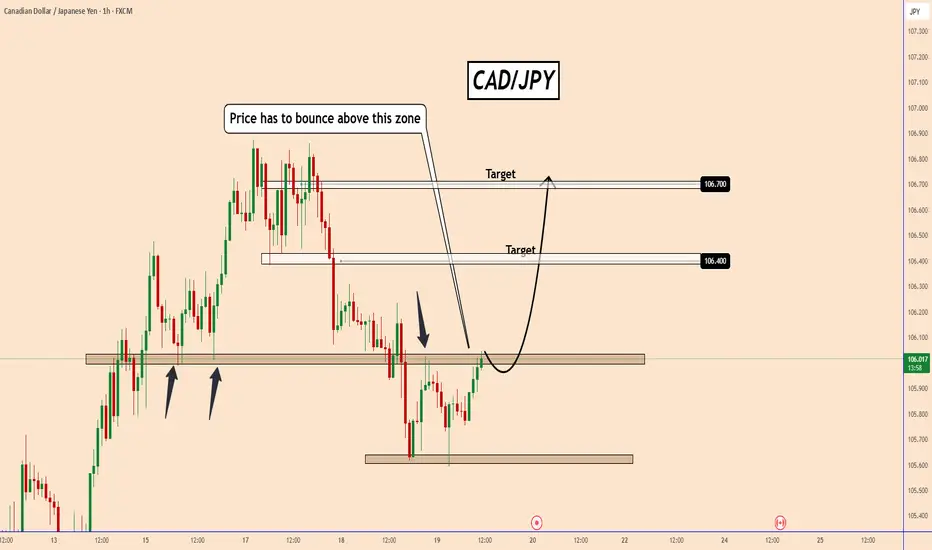
CADJPY Eyes Key Breakout Zone at 106.00CADJPY Eyes Key Breakout Zone at 106.00 🔍
CADJPY is approaching a well-tested resistance area, with price reacting multiple times to this zone in the past, as visible on the left side of the chart.
To confirm a potential bullish wave, the pair needs to decisively break above the 106.00 level.
W
GBPJPY I Weekly CLS I Model 2 I H4 OB entry Hey, Market Warriors, here is another outlook on this instrument
If you’ve been following me, you already know every setup you see is built around a CLS Footprint, a Key Level, Liquidity and a specific execution model.
If you haven't followed me yet, start now.
My trading system is completely

See all forex ideas
| - | - | - | - | - | - | - | ||
| - | - | - | - | - | - | - | ||
| - | - | - | - | - | - | - | ||
| - | - | - | - | - | - | - | ||
| - | - | - | - | - | - | - | ||
| - | - | - | - | - | - | - | ||
| - | - | - | - | - | - | - | ||
| - | - | - | - | - | - | - |
Trade directly on the supercharts through our supported, fully-verified and user-reviewed brokers.


