Market analysis from City Index
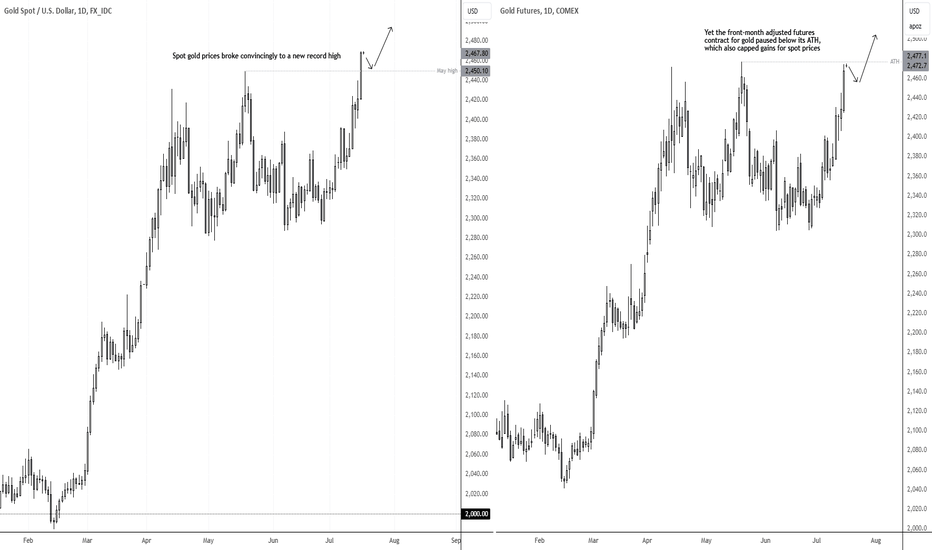
The combination of dovish Fed comments and a softer inflation report from Canada excited gold bulls enough to send spot prices convincingly to a record high on Tuesday. It was gold's best day in 4 months and closed near the high of the day. Yet it couldn't quite stretch to $2370. And here is why... The front-month adjusted futures contract for gold rallied in...
A prominent bearish candle formed on Monday, and despite rising over the next two days gold has failed to recapture Monday's losses. The fact that over half of Wednesday's range was upper wick also suggests bulls lack the adequate enthusiasm to extend gold's rally, for now at least. Furthermore, the 4-hour chart shows that the previous 3 high-volume spikes landed...
It is a quiet start to a busy week, but USD/JPY is trying to rise above a key support level. The 1990 high and MOF intervention level from May reside around 161.16/21, the daily RSI (2) has reached its most oversold level since the June low, so perhaps a swing low could be due on the daily chart. The market has been rising for the past couple of hours, although...
The euro has posted a solid rally from its June low. A small consolidation formed above the 200-day averages, and momentum is turning higher. With US data rolling over and the likelihood that the ECB are in no position to signal a cut next week, the path of least resistance could be higher for the euro. Today's US inflation report is a key event for the pair,...
Another day, another handle for USD/JPY which tapped the 162 level for the first time in over 37 years on Monday. The daily chart clearly shows a strong uptrend although a bearish divergence has formed on the RSI indicator in the overboard zone. This brings the potential for a pullback although this seems unlikely unless the ministry of Finance intervenes. The...
The Aussie posted a strong rally from the April low to may high. It has predominantly traded in the sideways range since then, but more recently we've seen two higher lows form within the range. And over the past two-and-a-bit weeks, intraday breaks me 64 cents have resulted in closes above it. I'm a bullish pressure appease to be building in that range. The...
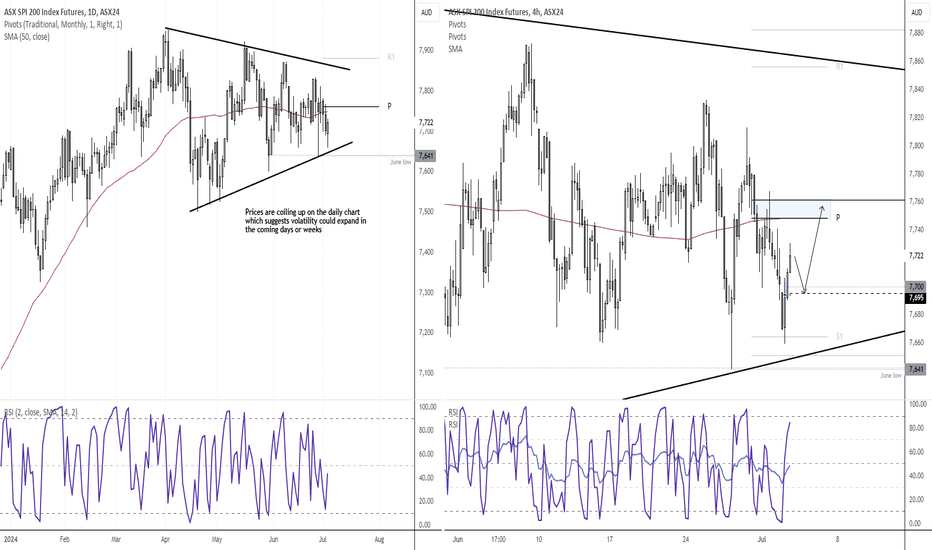
A strong lead from Wall Street on Wednesday ahead of Independence Day could bode well for Asian indices such as the ASX 200. The daily chart shows that prices are coiling which could indicate the volatility is set to increase in the coming days or weeks. Take note that over the past couple of weeks, each dip beneath 7700 has been bought Which shows demand above...
The ASX 200 cash market enjoyed its most bullish day in seven on Thursday. But like the SPI 200 futures contract, it met resistance before pausing. The daily chart shows that a double top formed around the June 26 high and trend resistance. And as it's not unusual to see a market retrace against a strong move, and we have an NFP report looming which could...
The China 50 row traced over 7% from a high to the June low. But a triple bottom formed at the 12,000 level, just above the 200 day average. A Bullish divergence also formed on the two-period RSI whilst the triple bottom formed. On Tuesday we saw clear range expansion to the upside and a daily close above the 200 day exponential moving average. This suggests an...
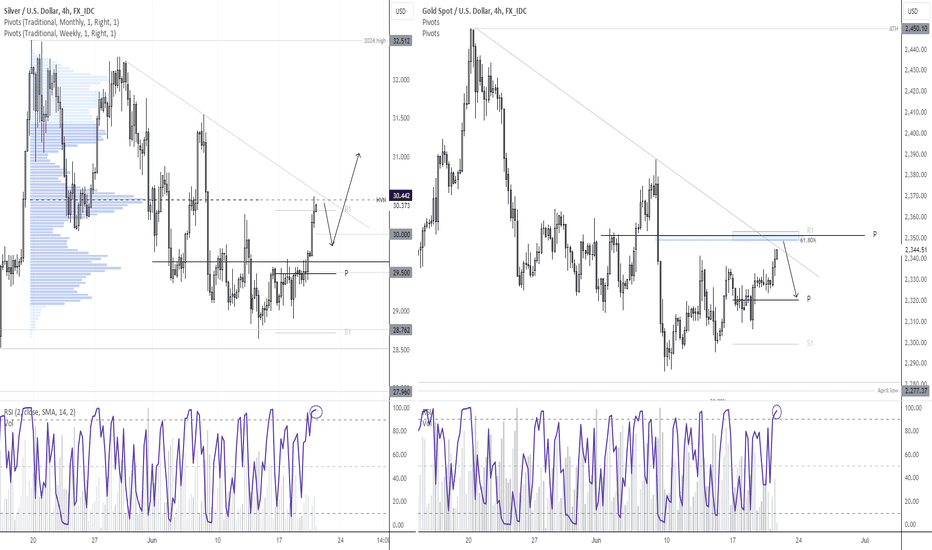
Silver rose over 2% in Thursday’s Asian session, eventually prompting gold to try and catch up. Yet gold’s ‘rally’ was lacklustre in comparison, and with silver pausing near a resistance cluster, we’d prefer to fade fold below $2350 for a move lower. Silver has stalled around a high-volume node (HVN) and trend resistance. RSI (2) is overbought and prices have...
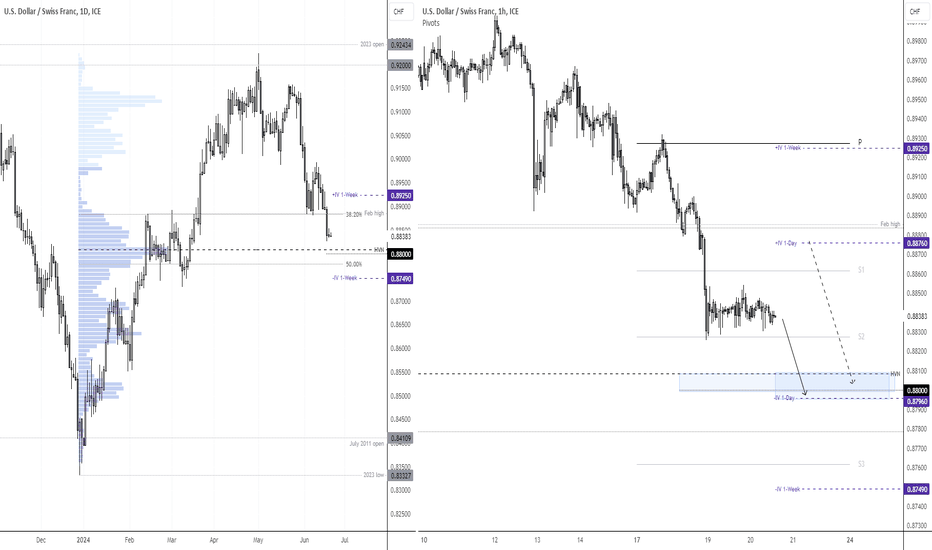
There is quite a bit of uncertainty with today's SNB rate decision, over whether they'll cut or hold. And that has seen the 1--day implied volatility level more than double its 20-day average. The market is clearly in a downtrend on the daily chart, having broken key support on Tuesday. Prices are now consolidating above the weekly S1 pivot on the hourly chart....
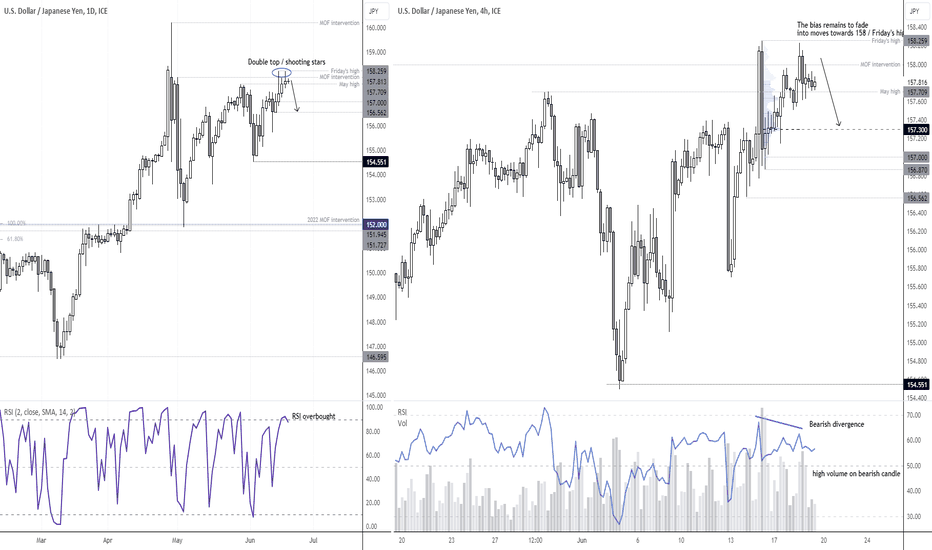
Over the past three days we have seen two false breaks above 158, both resulting with a daily shooting star reversal. The upper wicks also serve as a double top above 158, and with US economic data slowly souring, the case for a top on USD/JPY is building. Prices have found support around the May high, and another crack at 158 would not come as a surprise. Yet...
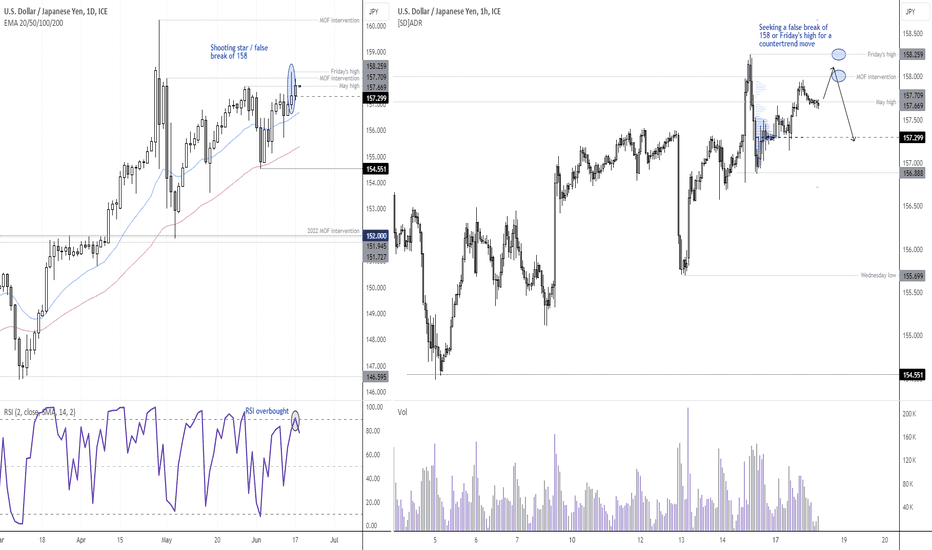
On Friday we saw USD/JPY failed to hold onto intraday gains above 158 following the BOJ meeting, and close the day back beneath the prior 'MOF intervention' level to form a shooting star candle. Prices drifted higher on Monday on relatively low volume, putting us once again on guard for either a false break of 158 or Friday's high. We're seeing a simple...
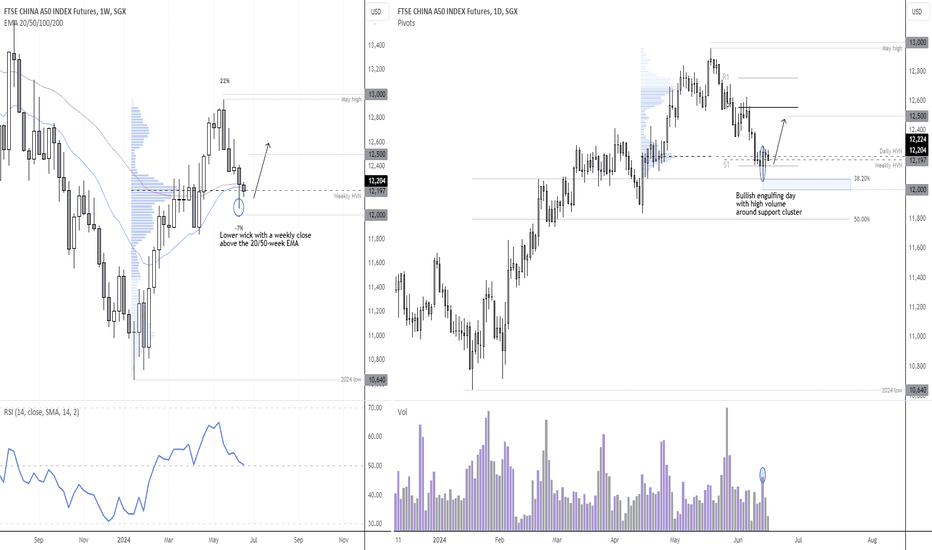
The China A50 rose over 20% from it January low to earn its 'technical bull market' status. Yet prices couldn't quite reach 13k before embarking on a -7% retracement over the next four weeks. Yet with it showing early signs of stability above support zones, perhaps a swing low is near - if not in place already. The daily chart shows a bullish engulfing candle on...
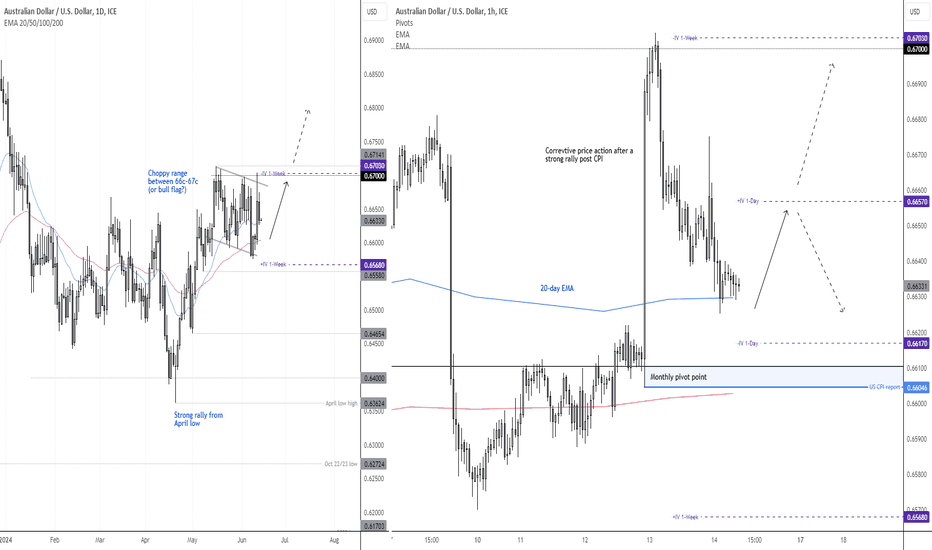
AUD posted a strong rally of 5% from the April low, before 67c capped as resistance. A choppy rage has since formed between 66c-67c, although it could also be a bull flag in the making. Whilst we wait for it to decide which of the two it is, we're looking at a cheeky swing trade long idea heading into the weekend. The 1-hour chart shows a strong rally from US...
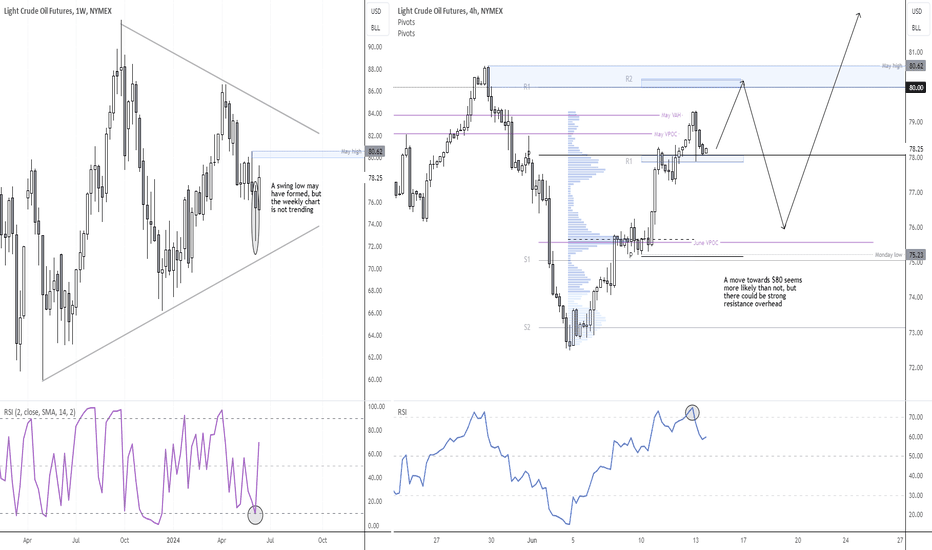
WTI is on track for a bullish engulfing week to snap a 3-week losing streak. And as it fell over 17% from the April high, it could pave the way for further gains in the coming weeks. However, there are plenty of resistance levels around the $80 that could spur bears from the side lines. The May VPOC and VAH sit around Wednesday's high, and the monthly R1 and...
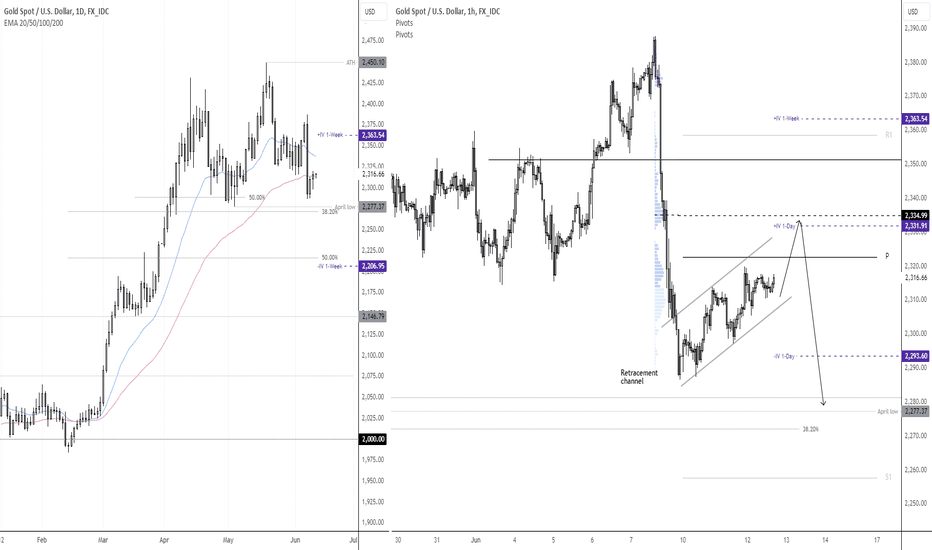
Gold managed to rose for a second day after Friday's strong NFP selloff, but bulls clearly lack conviction looking at the small bullish candles on the daily chart. This has allowed a retracement channel to form on the 1-hour chart, which suggests momentum could eventually turn lower. With US CPI potentially coming in hot and the Fed pushing back on cuts, it could...
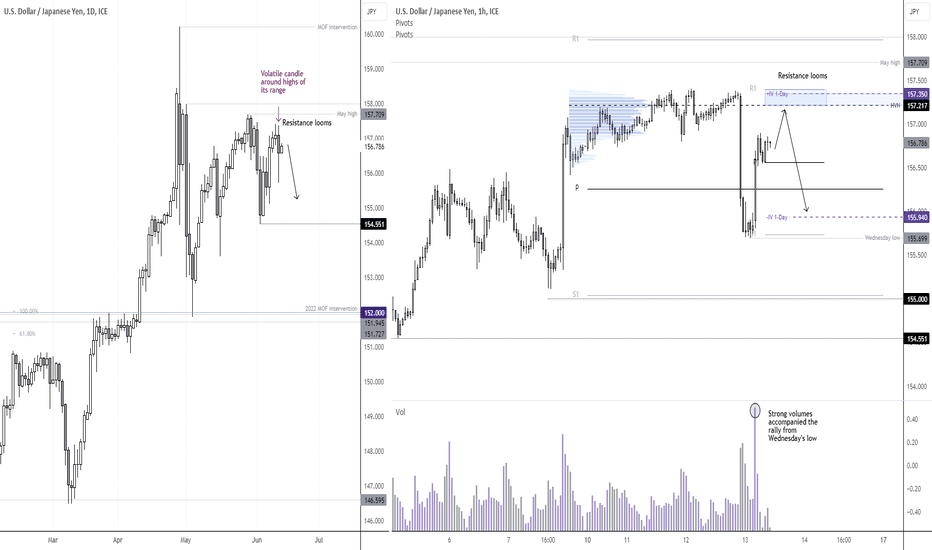
The whipsaws for the US dollar around US CPI and the FOMC meeting made its mark on USD/JPY, which closed the day with a large hanging man candle beneath the May high. Markets are still deciding whether to pay closer attention to softer inflation data or the Fed's relatively hawkish meeting, and that likely means confusing price action on USD pairs. The 1-hour...
