Market analysis from City Index
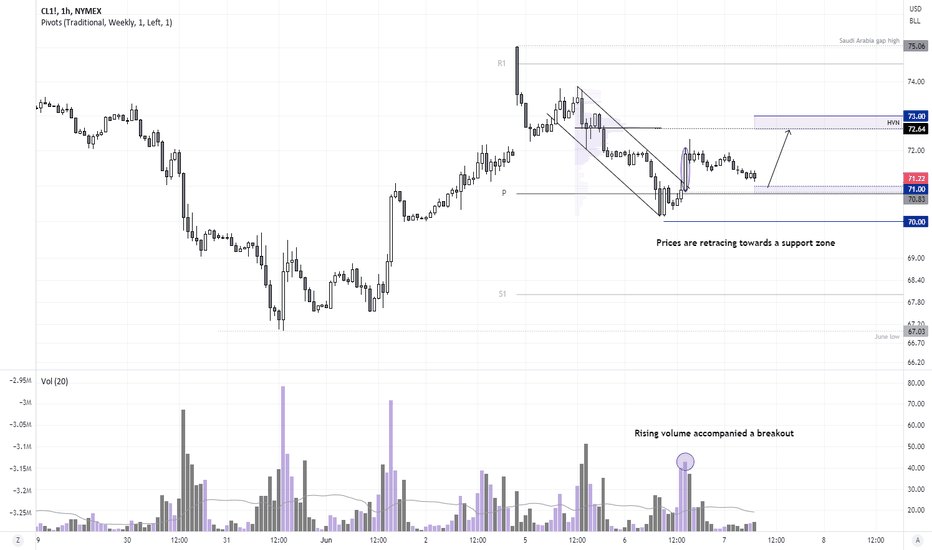
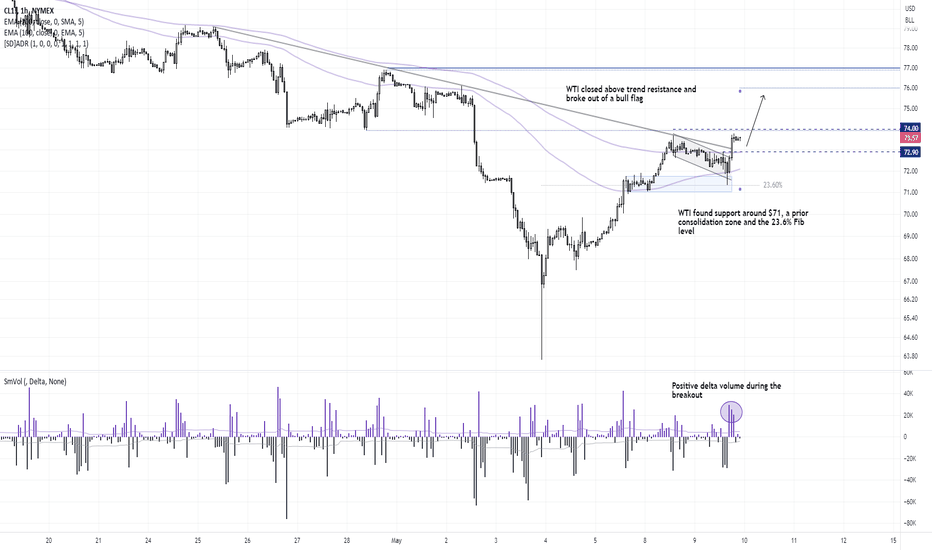
Oil prices are trading quite erratically on the daily chart, making it a much less appealing market to trade on that timeframe. But that doesn't mean we cannot find potential inflection points at the intraday level. Monday's opening gap has been filled, and earlier losses on Tuesday were fully recouped to print a bullish pinbar on the daily chart which found...
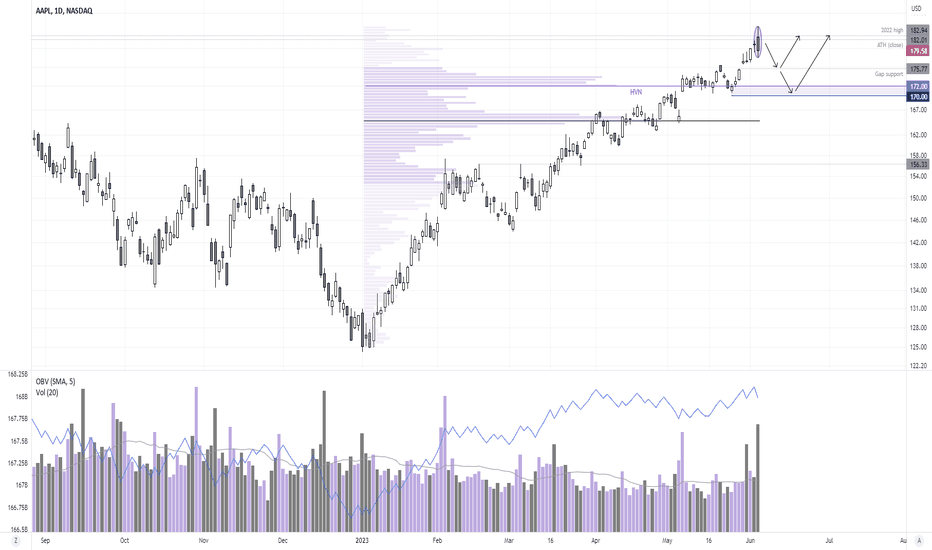
What costs $3500 and leaves the user vulnerable to being pranked from ‘friends’ whilst wearing it? Yes, Apple’s augmented reality headset, which comes in ~3x more than one made by Meta. You can read up on all its features and Apple’s latest announcements elsewhere. As what we’re focussing on today is that Apple’s stock closed lower on the day it unveiled its...
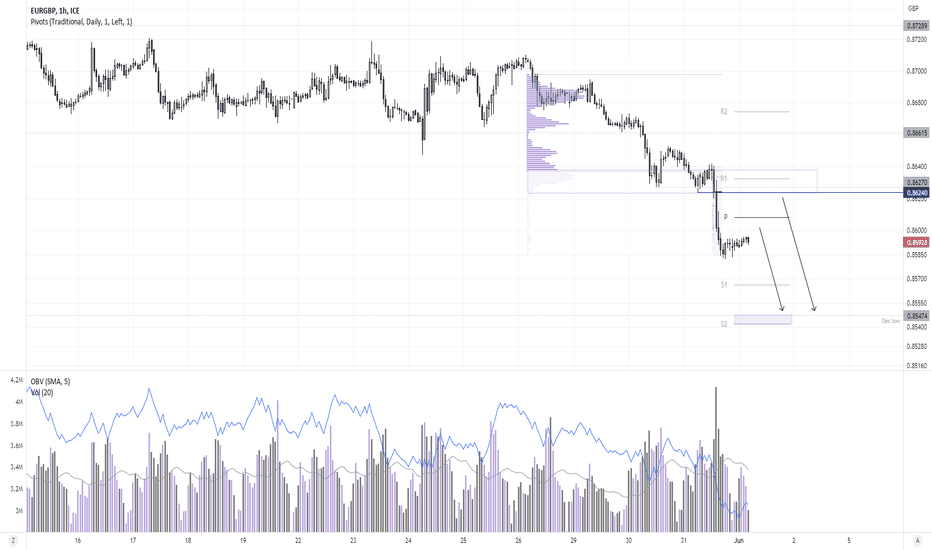
EUR/GBP has just suffered its worst month in ten, thanks to renewed bets of a more-hawkish BOE and soft inflation reports across Europe. Volumes increased during the recent leg lower to show fresh bearish bets being placed and the OBV (on balance volume) has also confirmed the move lower on prices. Prices are consolidating near the cycle lows on the 1-hour chart...
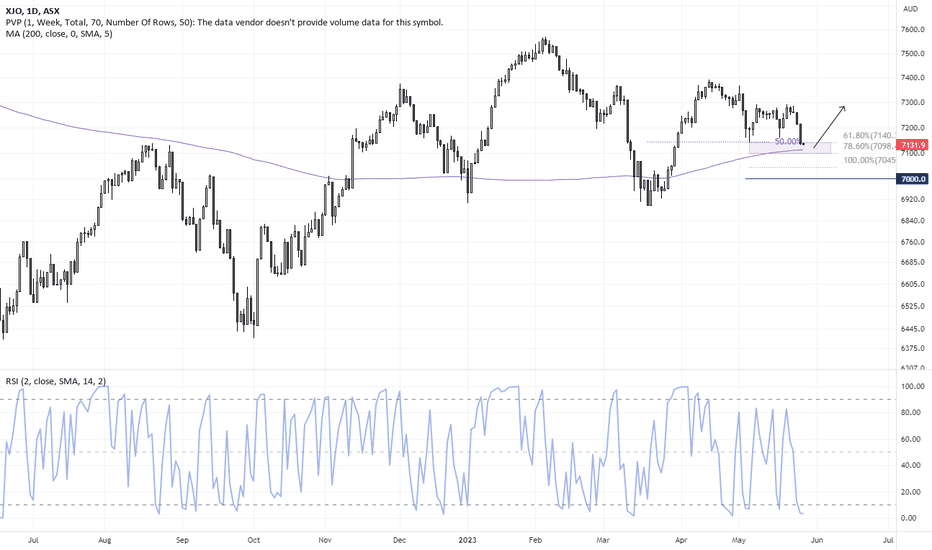
I suspect it could be a case of now or never for ASX bulls. Whilst it suffered its worst day in 9-weeks on Thursday, this could be part of an ABC correction and the 200-day MA is nearby as a probably support level, even if it breaks lower today. Futures markets shows heavy volume occurred around yesterday's lows (bears piled in around the lows) yet sentiment...
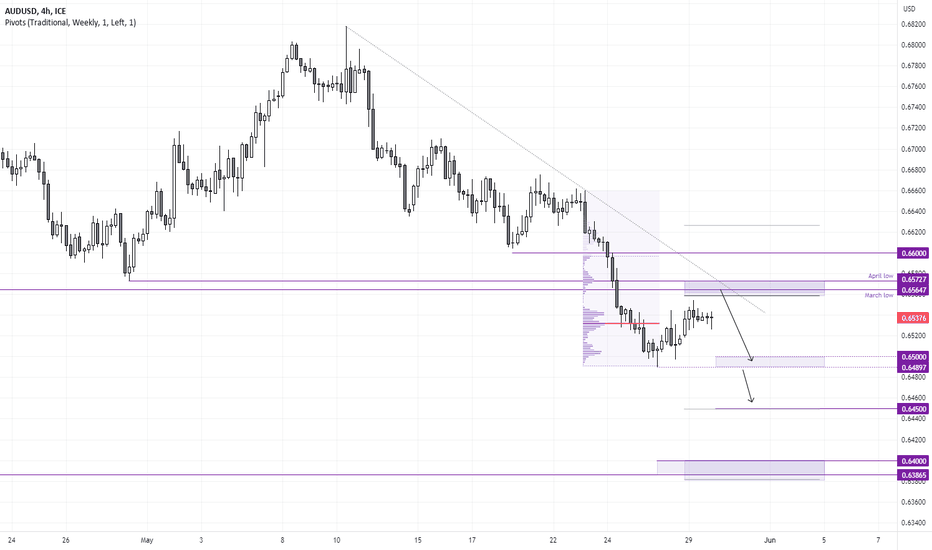
The AUS/USD is within an established bear trend on the 4-hour chart, and closed to a fresh YTD low on Friday having broken beneath the March and April lows. Prices have managed to retrace over the past two days during lower-liquidity trade whilst the US dollar’s rally took a breather. For now, we’re looking for evidence of a swing high below or around the 0.6550...
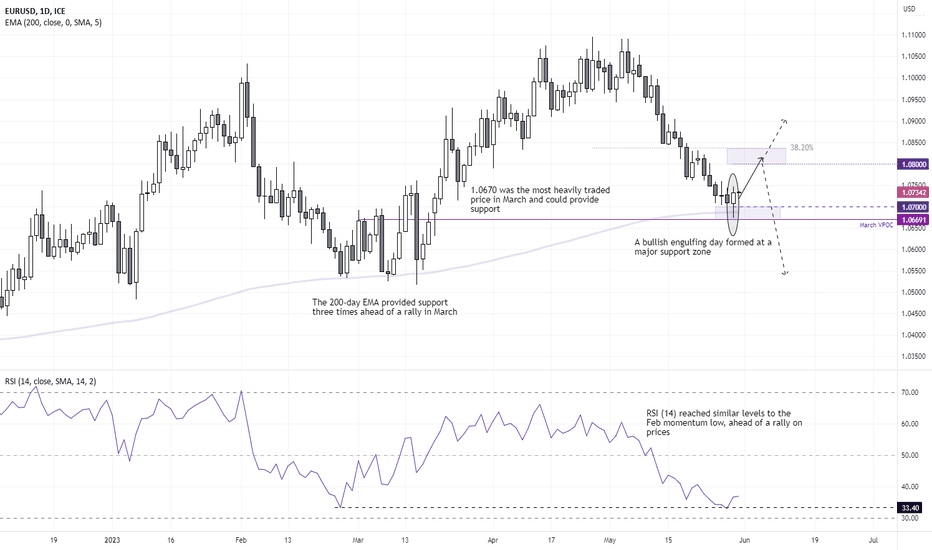
A bullish engulfing candle has formed on the EUR/USD daily chart, which could carry some weight given the technical levels of support it sits upon. Despite an intraday break below 1.0700, the market rebounded and closed back above this big round number. The 200-day EMA also provided support following an intraday false break beneath it, and it is worth mentioning...
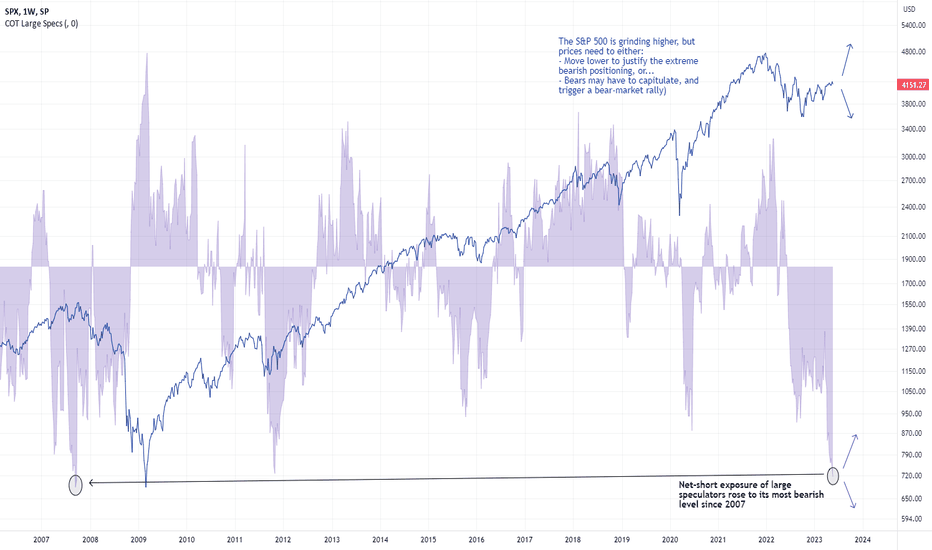
Whilst this year's 'rally' on the S&P 500 has been mediocre at best, the increase in net-short exposure to S&P futures has been impressive. As of last Tuesday, large speculators pushed their net-short exposure to the futures contract to their most bearish level since late 2007. Yet with prices rising whilst speculators increase bearish exposure, there is a clear...
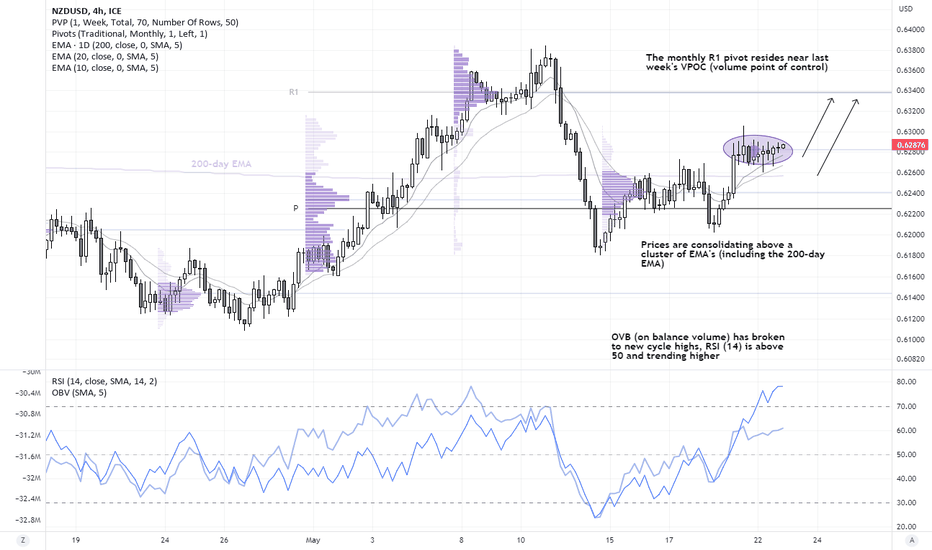
There are a growing number of calls for the RBNZ to deliver a hawkish 25bp hike tomorrow, due to the government's 'inflationary' budget delivered last week. This could also potentially result in the RBNZ upgrading their terminal rate in their quarterly forecasts. NZDUSD is consolidating on the 4-hour chart, having found support above the 200-day EMA. RSI (14)...
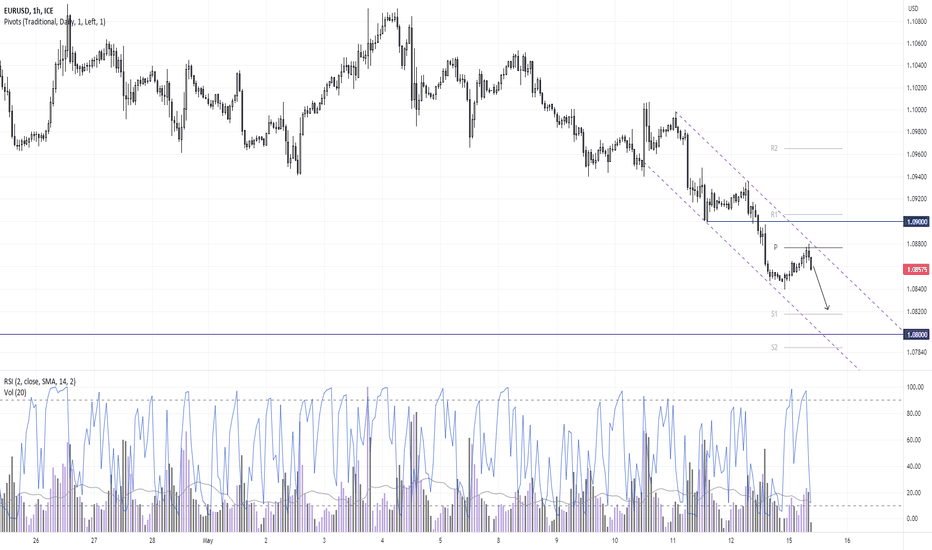
The 10hour chart remains within an established downtrend within a bearish channel. Prices retraced towards the daily pivot point and upper trendline whilst a bearish RSI divergence formed on RSI, yet volumes were notably lower to suggest the rise was corrective. Momentum has turned lower, so perhaps the swig high has already been seen. - The bias is bearish...
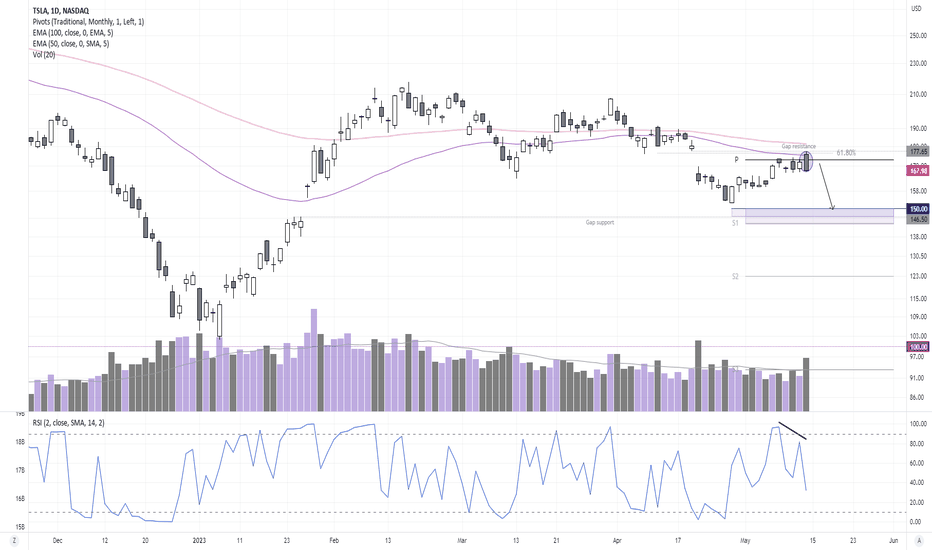
Tesla's share price has made a mediocre attempt to rise above $180, yet Friday's bearish engulfing / outside day seems to have different plans. The fact the candle occurred on high volume following a bearish RSI divergence suggests it may have reached (or is close to) a swing high. Furthermore, the reversal candle has formed around the monthly pivot, 61.8%...
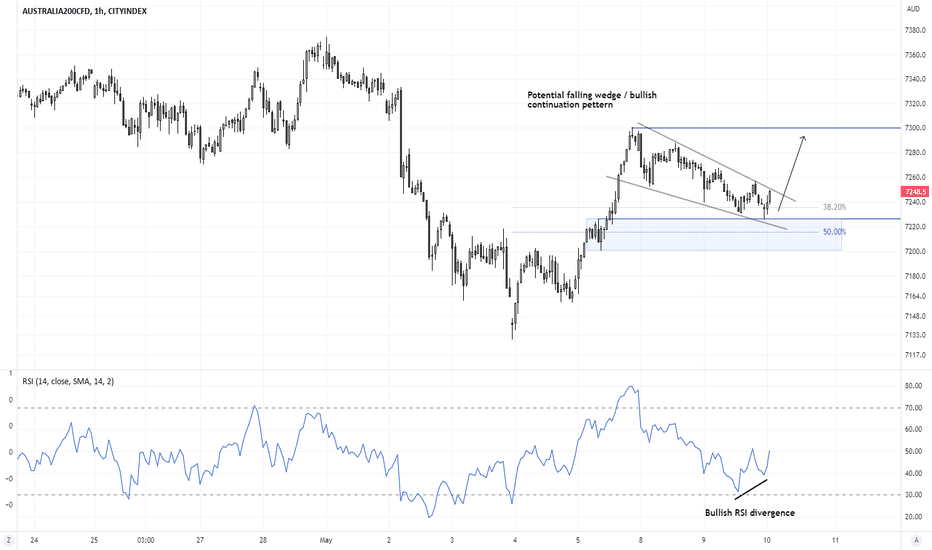
The possible 'sympathy bounce' towards 7300 highlighted last week played out nicely. Whilst we're on guard for bearish momentum to return as part of the seasonal 'sell in May and go away', we retain a bullish bias over the near-term. Prices have since pulled back from those highs and price action on the intraday chart appears to be corrective, in the form of a...
Whilst prices are expected to open lower, we’re on guard for a small countertrend bounce. A bullish hammer formed on the daily chart at the lower Bollinger band which found support at the 50% retracement level and 200-day EMA. A bullish divergence has formed on the RSI (2) within the overbought zone. A break above yesterday’s high could potentially see it retest...
We suspect volatility may be on the quiet side with a US inflation report looming, but this provides the opportunity for markets to consolidate and traders plan trades. Should we see the pace of inflation to continue slowing, it could strengthen oil prices for two basic reasons. 1 - A weaker US dollar, as traders bring forward rate cut bets / solidifies bets of...
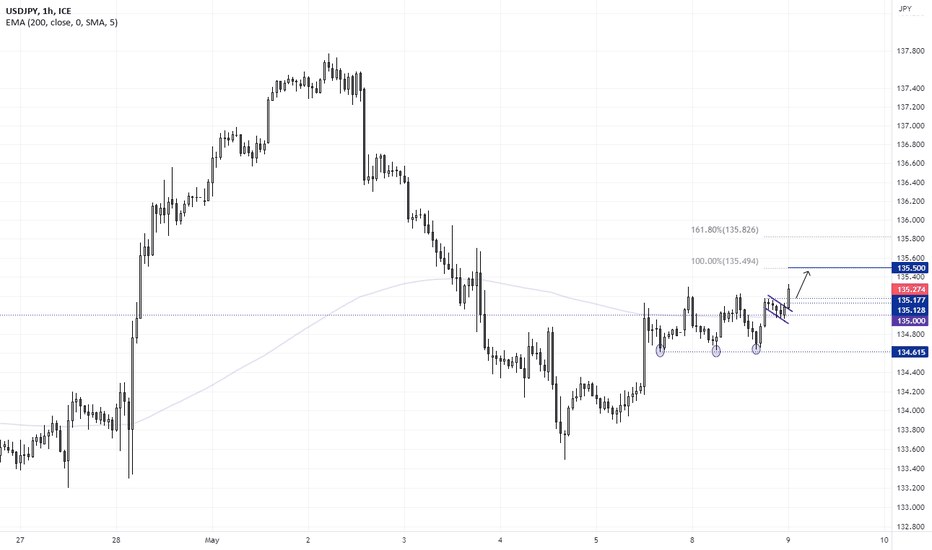
Tokyo has just opened and we see futures traders shorting the yen with decent volume, which suggests institutions have a bearish bias today on the local currency. This has pushed USD/JPY up to a 4-day high, and keeps a bull-flag breakout in play on the 1-hour chart. The flag projects a target around 135.50, but we're looking for prices to retrace towards the...
The DAX has remained within a tight consolidation just beneath its ATH (all-time high) over the past three weeks. Whilst it has so far failed to break higher, neither has it sold off. The OBV (on balance volume) indictor has moved to a new cycle high which suggests underlying bullish power, and Friday's lower wick (and bullish hammer) shows demand around the March...
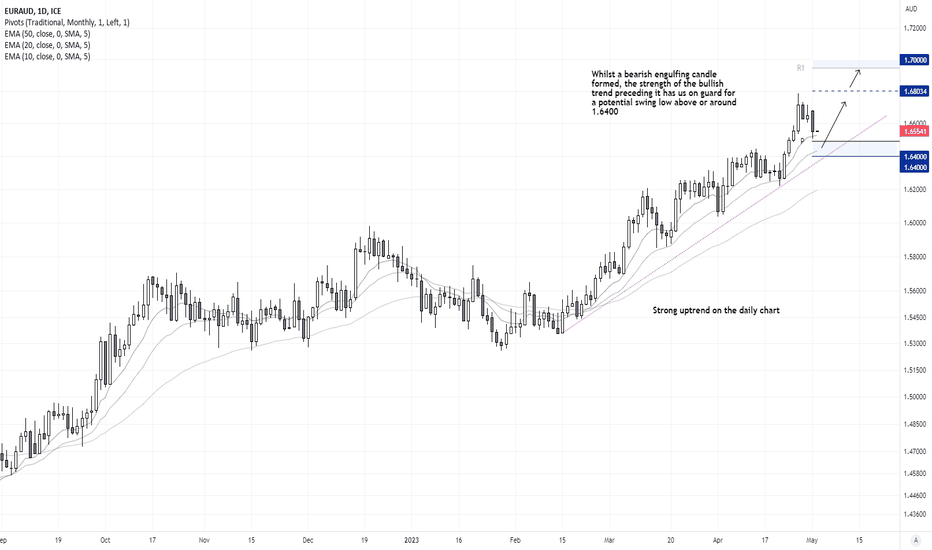
With the RBA due to meet and eurozone CPI data released tonight, EUR/AUD has caught our eye. It remains within a strong uptrend on the daily chart, although a bearish-outside day ahs slammed prices down to a 4-day low. But we’re keen on long opportunities if prices can remain above 1.6400, given the levels of technical support nearby including the 2021 high,...
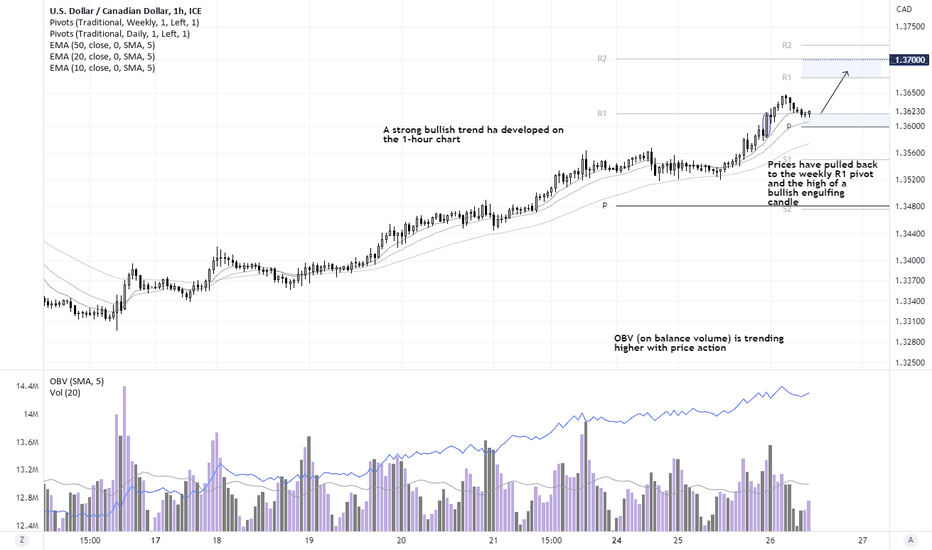
A strong bullish trend has developed on the 1-hour chart of USD/CAD, which is underscored by its timely yet shallow retracements. It's found support along the 10-bar EMA to show bullish momentum is increasing and the OBV (on balance volume) is trending higher with prices. A retracement has also found support around the weekly R1 pivot and the high of a prior...
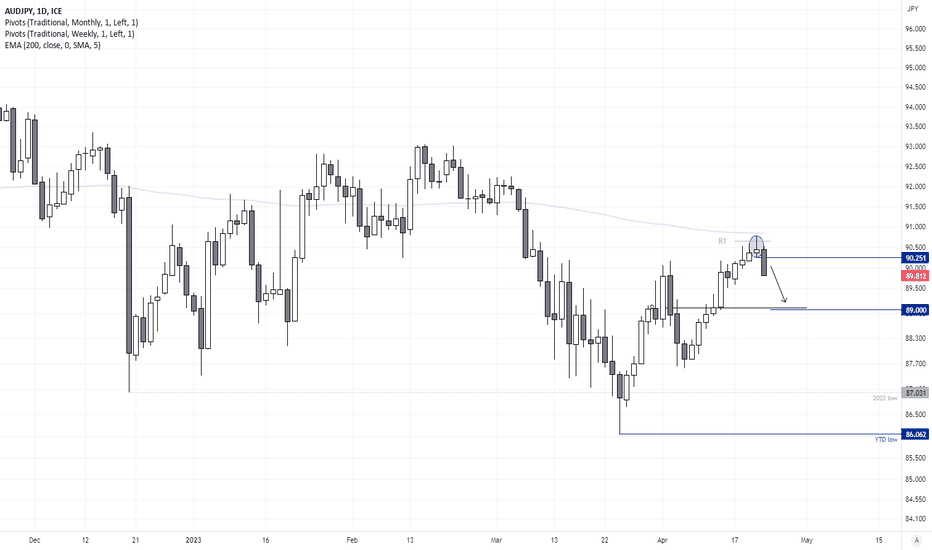
A 3-wave rally has stalled at the 200-day EMA with a bearish Pinbar. This begs the question as to whether we've seen the end of an ABC correction and the cross is to now break to new lows. Perhaps. But over the near-term, yen strength is favoured due to sticky inflation data from Japan, rumours that the BOJ are considering tweaking their YCC band later this year...
