Market analysis from City Index
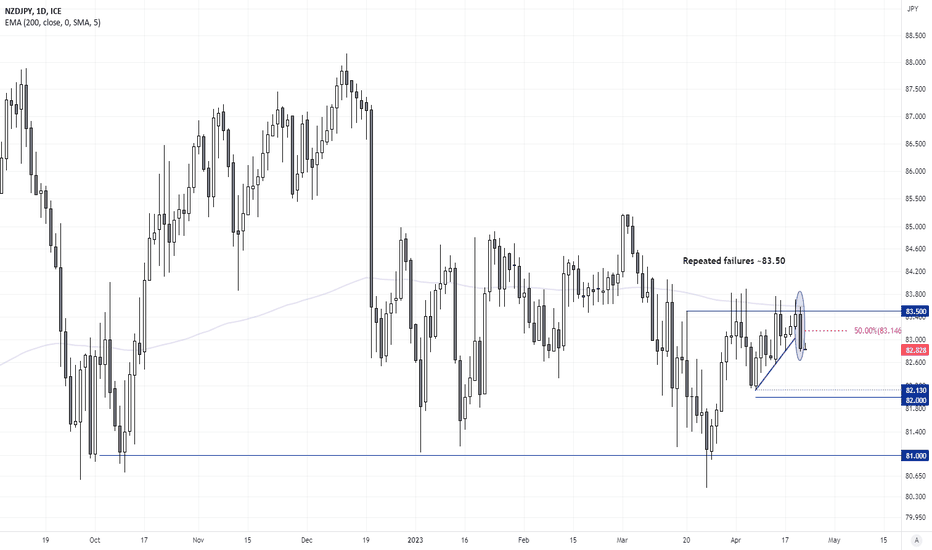
A soft inflation report from New Zealand weighed broadly on the Kiwi dollar yesterday, as traders began to price in the prospects of a 25bp hike (down form 50bp) or even a pause at the RBNZ's next meeting. The slight risk-off tone saw flows into the yen, and risk-currencies such as AUD and NZD were lower which has placed ZD/JPY on our shirt watchlist. The cross...
We'll look at the US dollar index and outline a few technical and fundamental reasons as to why the US dollar index (DXY) could be set for a bounce.
A divergent them is in play between the Fed and BOJ which could help it recover some more of last week's losses. BOJ governor Ueda reiterated the central bank's ultra-dovish stance whilst US 1-year consumer inflation expectations spikes 0.8% pct point and the Fed's Waller delivered his latest hawkish remarks (inflation remains too high and we've not done enough...
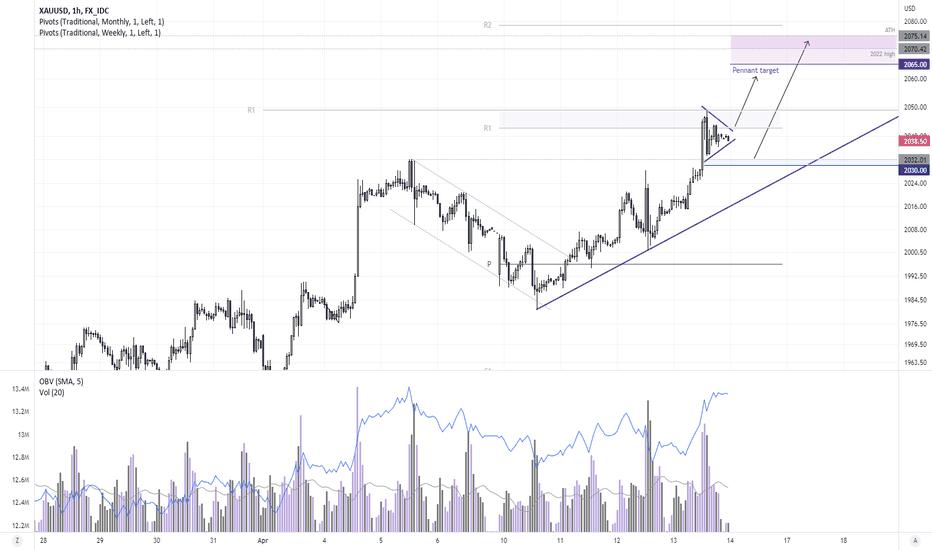
Gold reached a 12-month high and is within striking distance of its all-time high. Its bullish trend has accelerated on the hourly chart and is now consolidating within a potential pennant pattern, which projects a target around 2065. Incidentally this is just beneath the all-time, which is a likely area to witness a pullback due to profit taking. Volumes were...
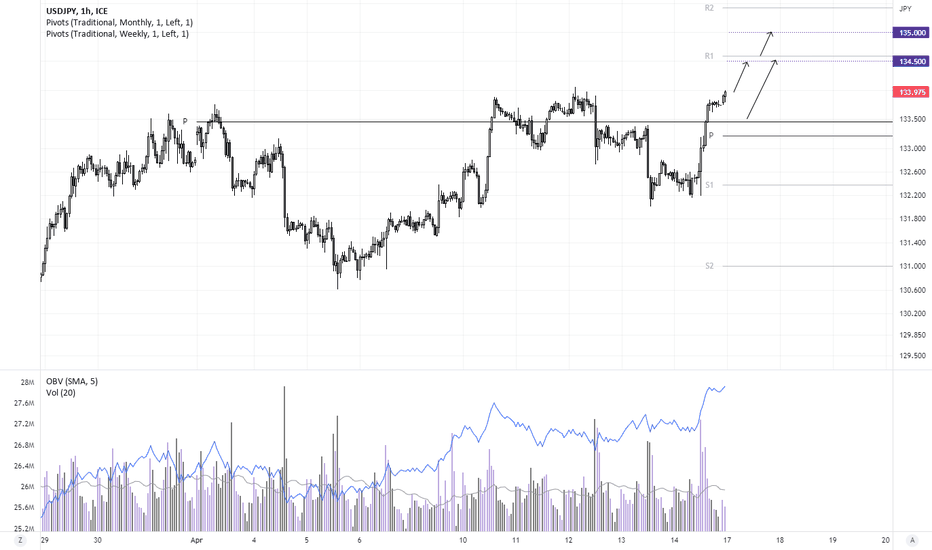
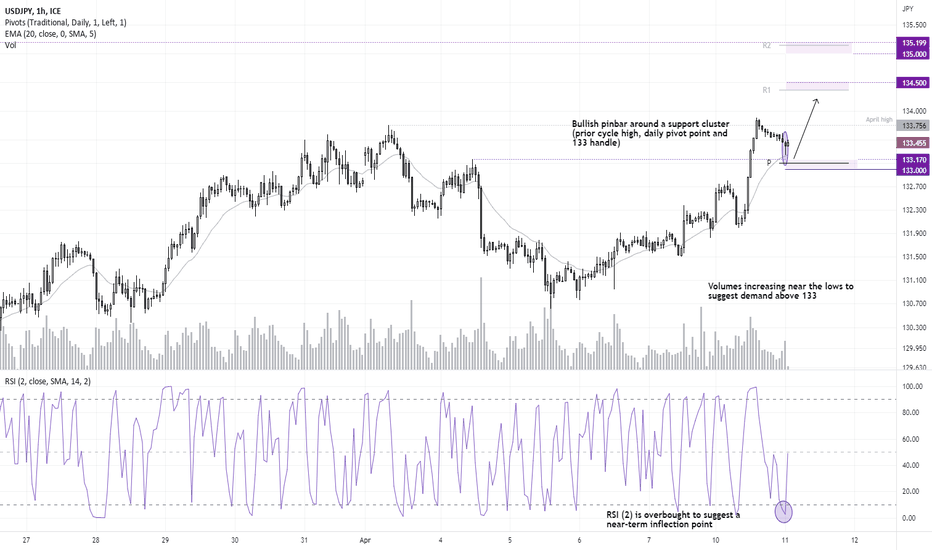
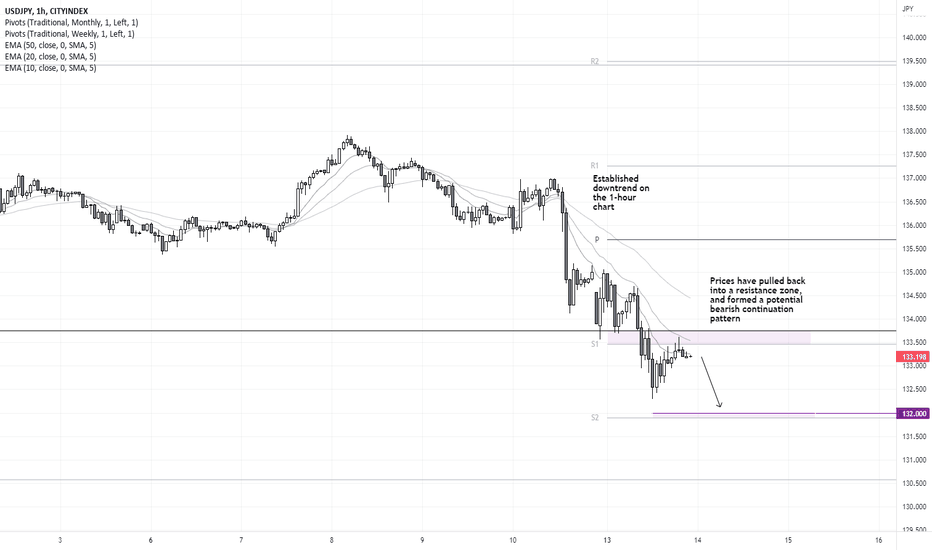
USD/JPY has pulled back from the April high, yet the strong bullish structure of the 1-hour chart suggests it can try to break to a new cycle high. Today’s low has found support at the 20-hour EMA and April 4th high. And volumes are now trending higher, and a bullish pinbar on higher volumes suggests demand above 133, which is just beneath the daily pivot point....
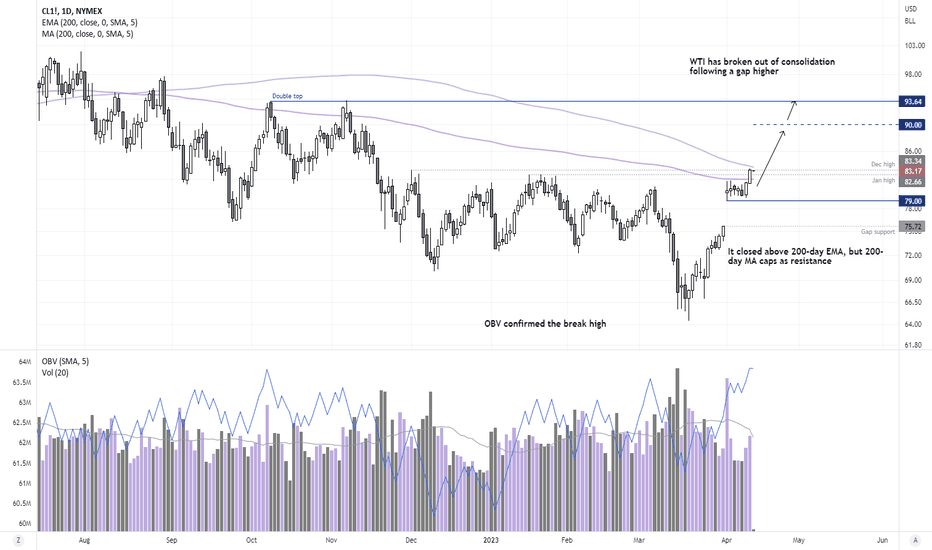
WTI broke out of consolidation and closed above its 200-day EMA and resistance zone. The OBV (on balance indicator) confirmed the breakout with a move to a new cycle high, and volumes (whilst below average) are turning higher to show buyers stepping back in. Furthermore, we saw a gap ahead of the consolidation above HKEX:79 , although using classic definitions...
AUD/CHF is within an established downtrend on the daily chart, and the current dynamics present a divergent theme which could send it lower from here. Yesterday closed with a bearish engulfing candle at its lowest level since April 2020. The moving average remain 'within order' and fanning out, and the 10-day EMA is now capping as resistance as prices try to...
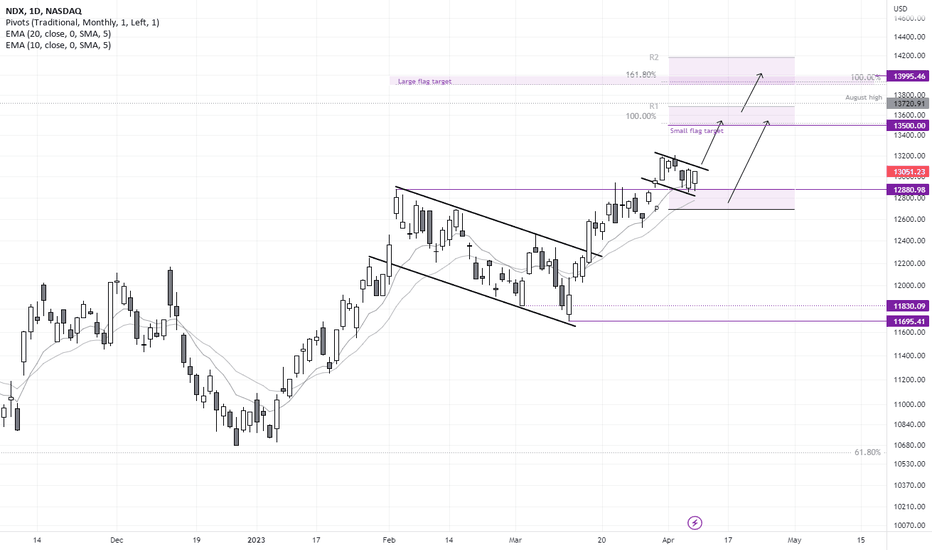
The Nasdaq is holding above the February high and forming a potential bull flag pattern, which projects an approximate target around 13,500. A larger flag pattern also remains in play with a target just below 14,000, although the October high and monthly R1 around 13700 provide a likely resistance area. The daily trend is respecting the 10 and 20-day EMA's and the...
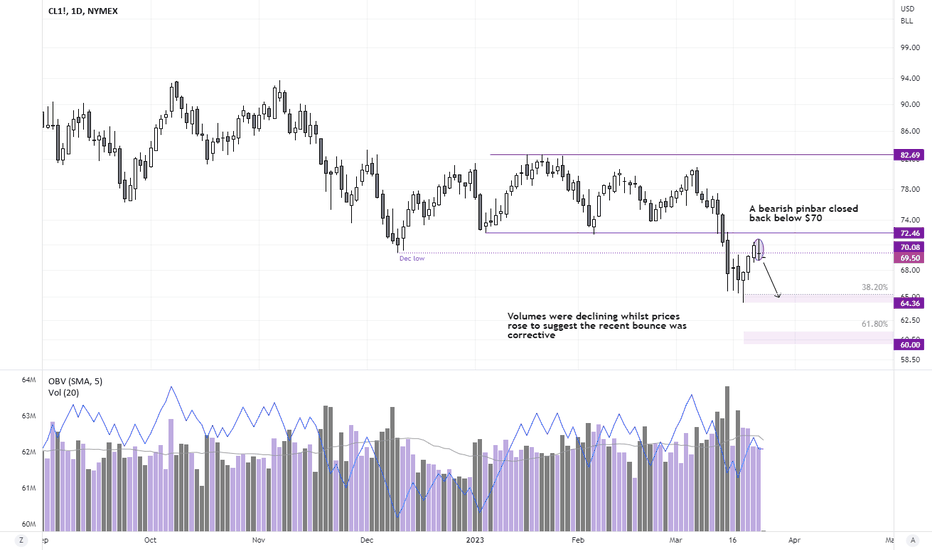
Oil prices fell to a 15-month low as investors fretted over the potential for a financial meltdown. Whilst that is yet to fully materialise (or if it does at all), investors remain a little on edge - with news of the latest Hindenburg report accusing Block (SQ) of fraudulent activity not likely to quell fears. WTI has manged to lift itself from its 15-month...
A bullish trend is developing on the 30-minute chart and prices are consolidating near yesterday’s highs, within a potential bullish continuation pattern. The OBV indicator (on balance volume) is also confirming the rally higher to suggest bullish volume remains dominant. The weekly pivot point is capping as resistance, so perhaps we’ll see a pullback prior to a...
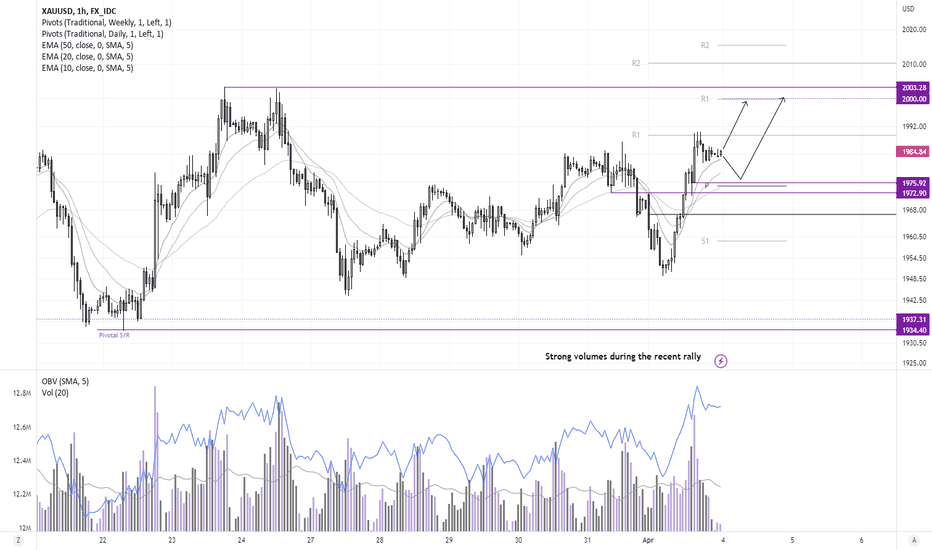
Well, gold did make it to $1980 - just not the way we'd hoped. Still, a bullish structure has formed on the 1-hour chart which has regained our interest. A bullish outside day formed yesterday and its lower wick shows strong demand around 1950. Prices are now consolidating within a potential bullish continuation pattern on the 1-hour chart, having pulled back...
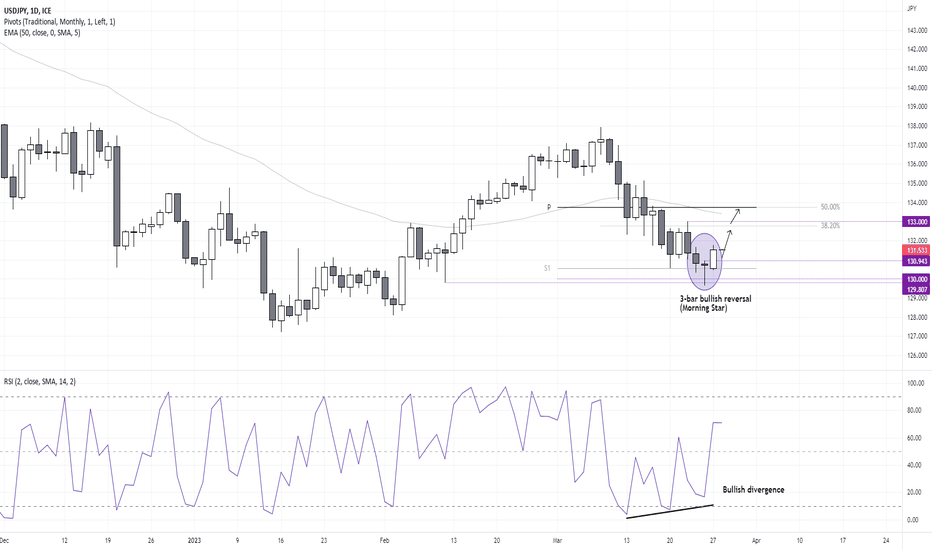
After an extended pullback on the USD/JPY daily chart, we think it is time for the pair to revert higher. A bullish divergence formed with the RSI (2) and a bullish pinbar formed on after a failed attempt to break below 130. Being a round number, there's reasonable chance of demand down at that level, and yesterday's up day is part of a 3-day bullish reversal...
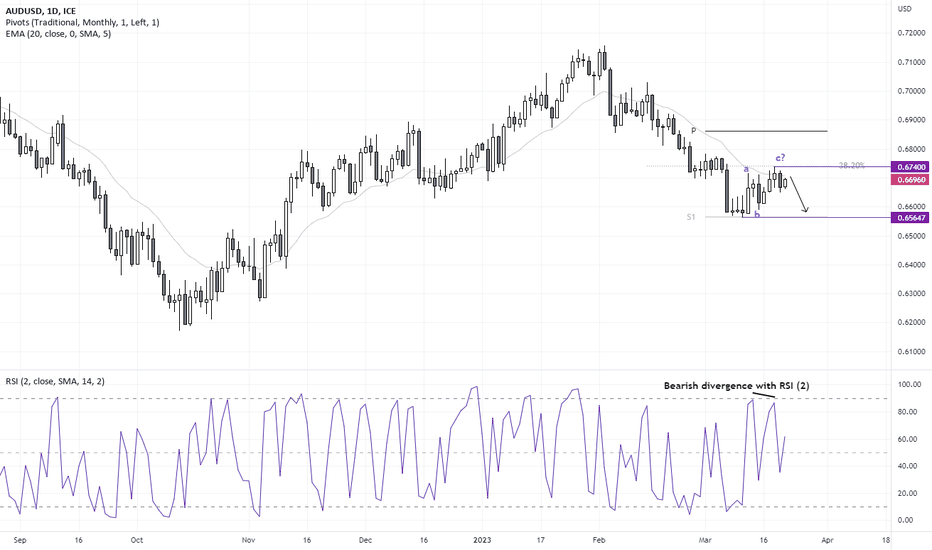
AUD/USD is hinting at a potential swing high on the daily chart. And if my hunch that the Fed won’t be as dovish as market pricing currently suggest, it leaves room for USD strength and a lower Aussie. AUD/USD seems to have completed a 3-wave retracement which perfectly respected a 38.2% Fibonacci ratio. Our bias remains bearish beneath the cycle highs, and we...
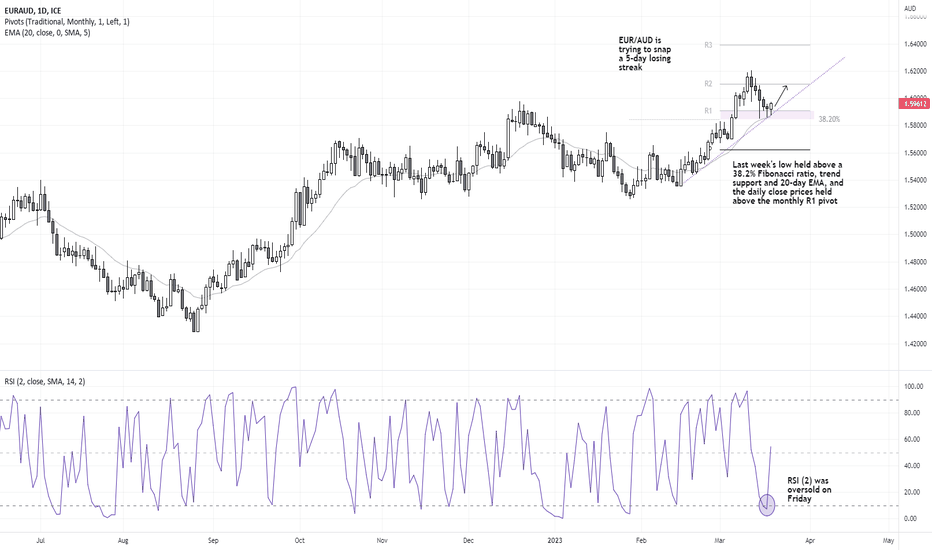
EUR/AUD closed lower for five consecutive days last week during a week of volatility and turbulence. With the Fed and five other central banks announcing a coordinated effort to provide liquidity for US swaps, and UBS agreeing to purchase Credit Suisse over the weekend, perhaps there's potential for it to confirm a swing low. Last week's low found support at the...
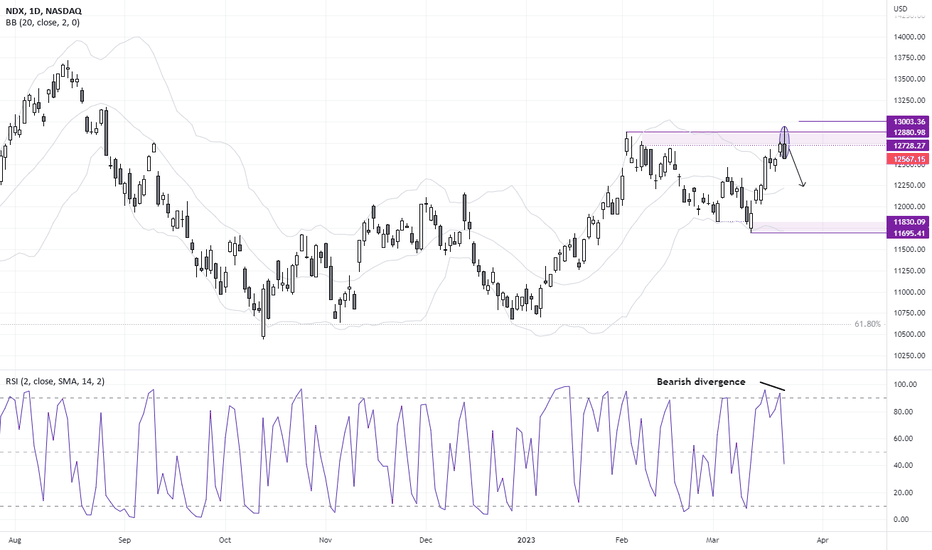
Sentiment on Wall Street took a turn for the worse by yesterday's close. Janet Yellen conceded that she has not considered a "blanket insurance" for US banking deposits, and Jerome Powell pushed back on any hopes of rate cuts from the Fed this year. The Nasdaq 100 came close to reaching out 13k target before momentum reversed sharply lower, closing the day with a...
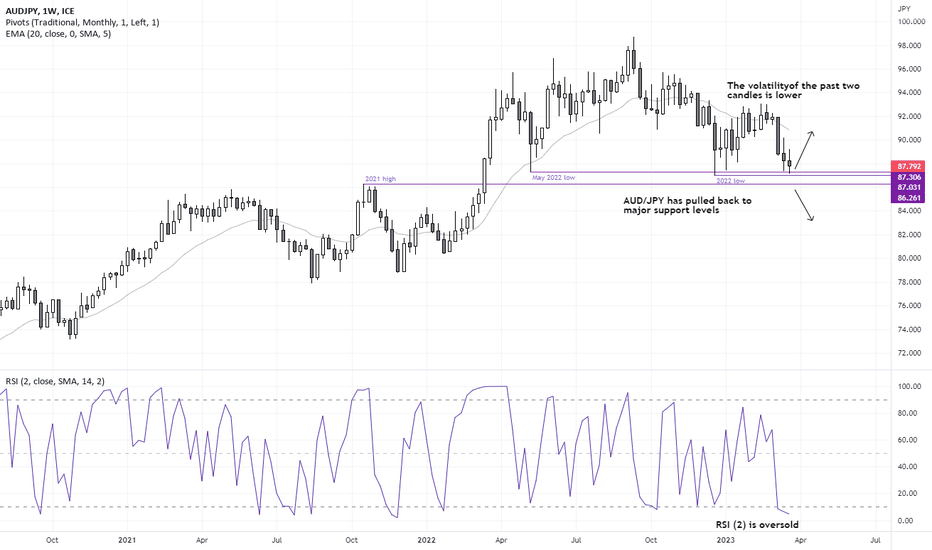
Despite the turbulence across global assets these past two weeks, AUD/JPY is opting to hold above key support and resistance levels including the 2022 low and 2021 high. Investors remain on edge as they cannot be sure that the worst is behind us, and there is a risk that another bank will 'break' under the pressure of higher rates, bad management and / or face...
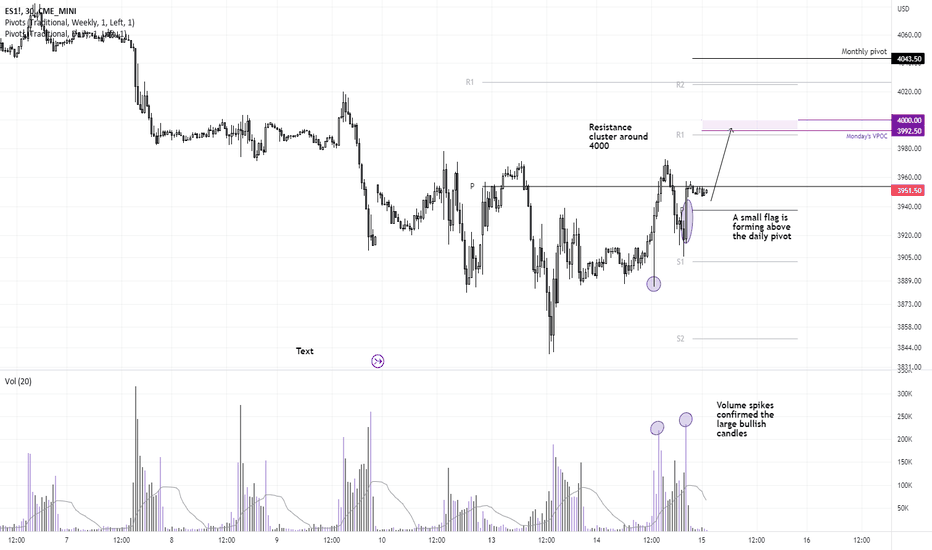
It was about as much of a risk-on day Tuesday could have been for US markets, with bond yields and indices rising with commodity FX. It allowed the S&P 500 E-mini futures contract to break a 3-day losing streak and form a 3-bar bullish reversal pattern (Morning Star), so perhaps the low for the week is in place? The 15-min chart shows prices hovering just below...
The US dollar has continued to face selling pressure following the collapse of Silicon Valley Bank, as traders bet that the Fed may pause their tightening cycle at next month's meeting. Whilst Fed fund futures imply a 60.5% chance of a 25bp hike (or 39.5% odds of a pause), this is quite a sudden chance considering the curve suggested ~80% chance of a 50bp hike...
