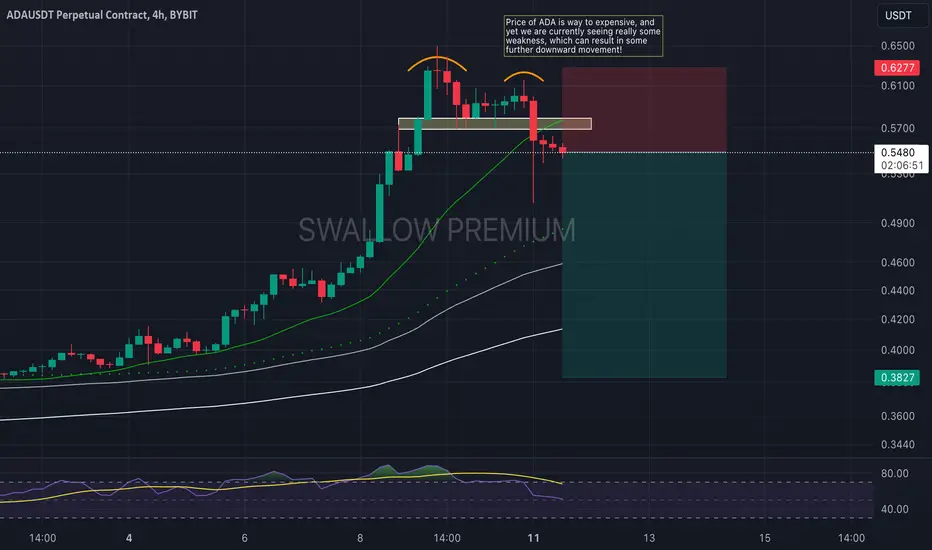
The current 4-hour ADAUSDT chart exhibits a notable retreat from recent highs, suggesting a cooling of bullish momentum. The price of ADA has formed a noticeable peak, leading to a substantial red candle that breaches the immediate support level. This shift implies a potential for continued bearish movement.
We are to monitor the Bollinger Bands closely; a sustained close below the middle band could signal further declines, potentially targeting the next significant support at $0.3827. The RSI shows no immediate signs of oversold conditions, which means we still have some room to fall
We are to monitor the Bollinger Bands closely; a sustained close below the middle band could signal further declines, potentially targeting the next significant support at $0.3827. The RSI shows no immediate signs of oversold conditions, which means we still have some room to fall
Note
After having a nice dump and a smaller dump as a follow-up, the price has gone straight back for a retest in potential upper zones.
As long as we are below the last ATH in our timeframe, we are good for further movement to lower zones, for sure!
ADA is way too overbought for bigger pictures!
Note
While ADA is still trying to push to the upper zones, we are also seeing a slow downward pressure here happening on the ADA coin.
Our major target is still $0.4351, and this movement can happen anytime soon! - Price Is Way Too Overbought!
🚨 Authentic Traders
⚡️ Short-Term + Mid-Term Trades
Keep an eye on us and you will not regret it. 😉
Telegram: t.me/+fiEDSn7M9pJkODA0
⚡️ Short-Term + Mid-Term Trades
Keep an eye on us and you will not regret it. 😉
Telegram: t.me/+fiEDSn7M9pJkODA0
Disclaimer
The information and publications are not meant to be, and do not constitute, financial, investment, trading, or other types of advice or recommendations supplied or endorsed by TradingView. Read more in the Terms of Use.